Late-Time Photometry of Type Ia Supernova SN 2012cg Reveals the Radioactive Decay of 57Co
Abstract
Seitenzahl et al. have predicted that roughly three years after its explosion, the light we receive from a Type Ia supernova (SN Ia) will come mostly from reprocessing of electrons and X-rays emitted by the radioactive decay chain , instead of positrons from the decay chain that dominates the SN light at earlier times. Using the Hubble Space Telescope, we followed the light curve of the SN Ia SN 2012cg out to days after maximum light. Our measurements are consistent with the light curves predicted by the contribution of energy from the reprocessing of electrons and X-rays emitted by the decay of 57Co, offering evidence that 57Co is produced in SN Ia explosions. However, the data are also consistent with a light echo mag fainter than SN 2012cg at peak. Assuming no light-echo contamination, the mass ratio of 57Ni and 56Ni produced by the explosion, a strong constraint on any SN Ia explosion model, is , roughly twice Solar. In the context of current explosion models, this value favors a progenitor white dwarf with a mass near the Chandrasekhar limit.
Subject headings:
nuclear reactions, nucleosynthesis, abundances – supernovae: general – supernovae: individual (SN 2012cg)I. Introduction
The declining light curves of Type Ia supernovae (SNe Ia), as well as some core-collapse SNe, are powered by the radioactive decay of , which releases -rays that thermalize with the expanding ejecta, to be re-emitted in the optical and near-infrared (Truran et al., 1967; Colgate & McKee, 1969). As the ejecta continue to expand, the column density decreases so that the ejecta become progressively more transparent to -rays. However, 19% of decays proceed via positron emission, and after days these positrons become the dominant energy source and continue to heat the ejecta (e.g., Arnett 1979; Chan & Lingenfelter 1993; Cappellaro et al. 1997; Milne et al. 1999). Assuming 100% trapping of the positrons emitted by these decays, the observed light curves of SNe Ia 300–600 days after explosion (e.g., Sollerman et al. 2004; Lair et al. 2006) are consistent with the decay of 56Co. However, the apparent slow-down of SN Ia light curves past 800 days, as seen in, e.g., SN 1992A (Cappellaro et al., 1997), SN 2003hv (Leloudas et al., 2009), and SN 2011fe (Kerzendorf et al., 2014), indicates that even complete trapping of the 56Co positrons cannot explain the observed luminosity; additional radioactive heating channels may be required. Seitenzahl et al. (2009) suggested that the slower decays of ( days) and ( days) will produce internal-conversion electrons, Auger electrons, and X-rays that would largely be trapped, deposit their energy, and slow down the decline of the light curve beginning days after maximum light.
While there is a wide consensus that SNe Ia are the result of a thermonuclear explosion of a carbon–oxygen white dwarf, it is still unclear how the white dwarf is detonated and consumed (for a recent review, see Maoz et al. 2014). Röpke et al. (2012) have used the leptonic energy injection mechanisms due to the decays of 57Co and 55Fe described above to provide a testable prediction for two popular SN Ia explosion scenarios: the “delayed-detonation” and “violent merger” models (Khokhlov, 1991; Pakmor et al., 2011, 2012). In the first scenario, a white dwarf with a mass close to the Chandrasekhar limit ( M⊙) first goes through a subsonic deflagration phase before transitioning to a supersonic detonation. In the second scenario, the white dwarf detonates due to a merger with a second, slightly lower-mass white dwarf, and both stars have sub-Chandra masses (1.1 and 0.9 M⊙). Each of these scenarios predicts that different amounts of and will be created during the explosion. For example, in the merger scenario, where the densities of the white dwarfs are g cm-3, most of the iron-group elements, including (which then decays to the longer-lived ), are produced in incomplete Si burning and -rich freezeout from nuclear statistical equilibrium. In contrast, the higher density of the delayed-detonation white dwarf leads to “normal” freezout (which sets in at g cm-3), which produces more (Thielemann et al., 1986). The different abundances of and then lead to bolometric light curves with appreciably different slopes at days after maximum light.
The late-time observations of the core-collapse SNe 1998bw (Seitenzahl et al., 2009) and 1987A (Seitenzahl et al., 2014) were shown to be consistent with the leptonic heating mechanism suggested by Seitenzahl et al. (2009). When this paper was submitted, this prediction had not been tested for any normal SN Ia (e.g., SN 2001el, observed by Stritzinger & Sollerman 2007, as well as the SNe Ia collected by Milne et al. 2001 and Lair et al. 2006, only go out to days after explosion). Tantalizingly, the very last data points on the light curves of SN 1992A ( days; Cappellaro et al. 1997) and SN 2003hv ( days; Leloudas et al. 2009) might be showing the beginning of a slow-down of their optical light curves. Very recently, Fransson & Jerkstrand (2015) published their analysis of the spectrum of SN 2011fe taken 1034 days after explosion by Taubenberger et al. (2015). At this epoch, they find strong evidence of the need for energy injection by 57Co and, in order to reproduce the observed flux level of the spectrum, require a production ratio of that is roughly times Solar. Here, we test the predictions made by Seitenzahl et al. (2009) and Röpke et al. (2012) by following the late-time lightcurve of the SN Ia SN 2012cg.
SN 2012cg was discovered on 2012 May 17 (UT) in the nearby spiral galaxy NGC 4424 (at a stellar-kinematics based distance of Mpc; Cortés et al. 2008) by the Lick Observatory Supernova Search (Filippenko et al., 2001; Kandrashoff et al., 2012) and spectroscopically classified as a SN Ia by Cenko et al. (2012) and Marion et al. (2012). Hubble Space Telescope (HST) pre-explosion images of NGC 4424 revealed no source at the location of the SN down to limits of and mags and excluded most supergiants as potential binary companions (Graur & Maoz, 2012). Chomiuk et al. (2012) did not detect the SN in the radio and constrained any possible circumstellar material to either lie at distances cm or be distributed in thin shells cm wide.
II. Observations
We imaged SN 2012cg (, ) with the HST Wide Field Camera 3 (WFC3) wide-band filters F350LP, F555W, F814W, and F160W under HST program GO–12880 (PI Riess) on 2013 December 24.9; 2014 January 1.2, 8.8, 17.1, 23.6, and 28.9; February 4.0, 11.8, 20.8, and 27.5; and March 9.6. At these dates the SN was –640 days past maximum light. We subsequently observed SN 2012cg under HST program GO–13799 (PI Graur) with the WFC3 filter F350LP on 2014 December 16.5, 2015 February 6.9, and 2015 April 26.6, when the SN was –1055 days beyond peak light. Here, we concentrate on observations carried out with the long-pass F350LP filter. Centered at wavelength nm and with a width of 475.8 nm, F350LP is the second-widest WFC3 filter, after F200LP, covering a wavelength range of – nm.
| Date | MJD | Phase | Filter | Exposure Time | Magnitude | (Magnitude) | Flux | (Flux) | HST Program |
| (days) | (days) | (s) | (AB mag) | (AB mag) | (Jy) | (Jy) | |||
| 2013 Dec 24.9 | 56650.9 | 567.9 | F350LP | 1200 | 23.094 | 0.039 | 2.10 | 0.08 | 12880 |
| 2013 Dec 24.9 | 56650.9 | 567.9 | F555W | 936 | 22.750 | 0.019 | 2.88 | 0.05 | 12880 |
| 2014 Jan 01.2 | 56658.2 | 575.2 | F350LP | 1200 | 23.217 | 0.040 | 1.88 | 0.07 | 12880 |
| 2014 Jan 01.2 | 56658.2 | 575.2 | F814W | 900 | 22.867 | 0.034 | 2.59 | 0.08 | 12880 |
| 2014 Jan 08.8 | 56665.8 | 582.8 | F350LP | 1260 | 23.271 | 0.041 | 1.78 | 0.07 | 12880 |
| 2014 Jan 08.8 | 56665.8 | 582.8 | F160W | 906 | 21.35 | 0.14 | 10.5 | 1.3 | 12880 |
| 2014 Jan 17.1 | 56674.1 | 591.1 | F350LP | 1200 | 23.341 | 0.042 | 1.67 | 0.06 | 12880 |
| 2014 Jan 17.1 | 56674.1 | 591.1 | F160W | 906 | 21.51 | 0.17 | 9.0 | 1.4 | 12880 |
| 2014 Jan 23.6 | 56680.6 | 597.6 | F350LP | 1230 | 23.404 | 0.043 | 1.58 | 0.06 | 12880 |
| 2014 Jan 23.6 | 56680.6 | 597.6 | F814W | 900 | 23.173 | 0.046 | 1.95 | 0.08 | 12880 |
| 2014 Jan 28.9 | 56685.9 | 602.9 | F350LP | 1200 | 23.439 | 0.043 | 1.53 | 0.06 | 12880 |
| 2014 Jan 28.9 | 56685.9 | 602.9 | F814W | 938 | 23.291 | 0.050 | 1.75 | 0.08 | 12880 |
| 2014 Feb 04.0 | 56692.0 | 609.0 | F350LP | 1260 | 23.506 | 0.044 | 1.44 | 0.06 | 12880 |
| 2014 Feb 04.0 | 56692.0 | 609.0 | F160W | 906 | 21.80 | 0.21 | 6.9 | 1.3 | 12880 |
| 2014 Feb 11.8 | 56699.8 | 616.8 | F350LP | 1260 | 23.570 | 0.045 | 1.35 | 0.06 | 12880 |
| 2014 Feb 11.8 | 56699.8 | 616.8 | F160W | 906 | 21.79 | 0.21 | 7.0 | 1.4 | 12880 |
| 2014 Feb 20.8 | 56708.8 | 625.8 | F350LP | 1230 | 23.640 | 0.047 | 1.27 | 0.06 | 12880 |
| 2014 Feb 20.8 | 56708.8 | 625.8 | F555W | 900 | 23.132 | 0.026 | 2.03 | 0.05 | 12880 |
| 2014 Feb 27.5 | 56715.5 | 632.5 | F350LP | 1230 | 23.738 | 0.048 | 1.16 | 0.05 | 12880 |
| 2014 Feb 27.5 | 56715.5 | 632.5 | F814W | 900 | 23.566 | 0.063 | 1.36 | 0.08 | 12880 |
| 2014 Mar 09.6 | 56725.6 | 642.6 | F350LP | 1260 | 23.785 | 0.050 | 1.11 | 0.05 | 12880 |
| 2014 Mar 09.6 | 56725.6 | 642.6 | F160W | 906 | 21.96 | 0.24 | 5.9 | 1.3 | 12880 |
| 2014 Dec 16.5 | 57007.5 | 924.5 | F350LP | 2688 | 25.76 | 0.22 | 0.18 | 0.04 | 13799 |
| 2015 Feb 06.9 | 57059.9 | 976.9 | F350LP | 2688 | 25.94 | 0.26 | 0.15 | 0.04 | 13799 |
| 2015 Apr 26.6 | 57138.6 | 1055.6 | F350LP | 2688 | 26.29 | 0.29 | 0.11 | 0.03 | 13799 |
| Note. All photometry is measured in an aperture with a diameter of (except for the final measurement on 2015 26.6, for which we | |||||||||
| used an aperture with a diameter of ). Phases are relative to -band maximum light on 2012 June 4.5. The measurements here have | |||||||||
| not been corrected for reddening by either Galactic or host-galaxy dust. | |||||||||
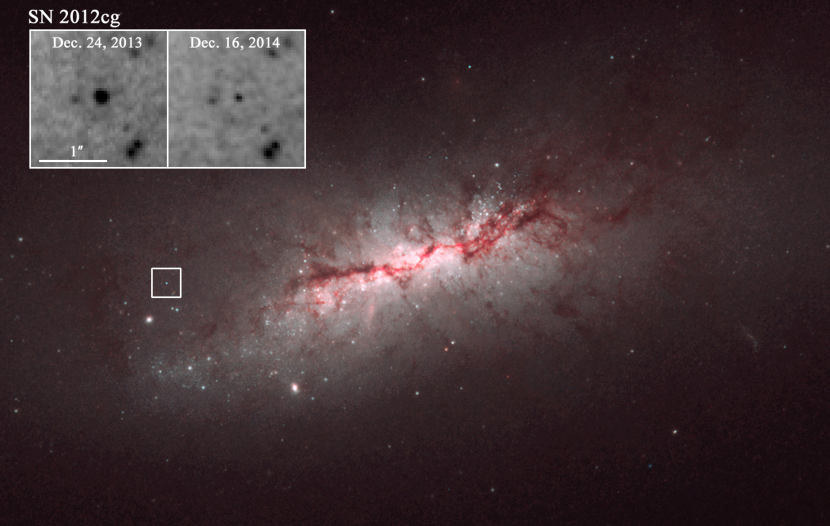
In Figure 1, we show a color composite of NGC 4424 and SN 2012cg along with an inset that shows F350LP observations of the SN taken a year apart. While the SN has faded appreciably between the two visits, it is still visible days after explosion. We present our measurements of the light curve of SN 2012cg in Figure 2.
III. Analysis
We performed aperture photometry of SN 2012cg in a -diameter aperture using the hstsnphot111https://github.com/srodney/hstsntools program used by the CLASH and CANDELS SN surveys (Graur et al., 2014a; Rodney et al., 2014), which is based on the IRAF222http://iraf.noao.edu/ apphot routine (Tody, 1986). Due to the faintness of the SN on the last observation epoch, 2015 April 26.6, we used a smaller aperture with a diameter of , along with a larger aperture correction, to capture the low flux counts. Zero points and aperture corrections were measured by the Space Telescope Science Institute.333http://www.stsci.edu/hst/wfc3/phot_zp_lbn Our photometry of SN 2012cg, uncorrected for Galactic or host-galaxy reddening, is reported in Table 1.
We correct our measurements for both Galactic extinction along the line of sight to SN 2012cg and the extinction caused by dust in the SN host galaxy. The Galactic line-of-sight extinction toward SN 2012cg in F350LP, F555W, F814W, and F160W is 0.054, 0.059, 0.032, and 0.011 mag, respectively (Schlafly & Finkbeiner, 2011). By using the Cardelli et al. (1989) reddening law, an mag reddening (Silverman et al., 2012; Marion et al., 2015), and assuming , we calculate host-galaxy extinctions of 0.515, 0.582, 0.333, and 0.114 mag in the same filters.
SN 2012cg peaked in the band sometime during 2012 June 2–5, at which point it reached an absolute magnitude similar to that of SN 2011fe (as measured by Munari et al. 2013). While it is similar to SN 2011fe in many respects (e.g., in its color evolution around peak, as well as the apperance of its nebular spectra; see Amanullah et al. 2015, but cf. Marion et al. 2015 for a possible early excess of blue light. For more information on SN 2011fe, see, e.g., Li et al. 2011; Chomiuk 2013; Kasen & Nugent 2013; Graur et al. 2014b), it has a slightly broader light curve. Specifically, by fitting early-time data, Silverman et al. (2012) measured , mag, and a -band light curve that was slightly narrower than SN 2011fe (the only work to reach such a conclusion). Munari et al. (2013) measured , mag, (compared to 1.108 for SN 2011fe), and a reconstructed bolometric light curve that reaches a similar (though slightly higher) peak luminosity as SN 2011fe, with a slightly broader shape overall (see their figure 4). Marion et al. (2015) measured an earlier , mag, and . Finally, Amanullah et al. (2015) found that and , where the latter is the Perlmutter et al. (1997) stretch parameter. Here, we adopt the value of peak -band light derived by Munari et al. (2013), so that all phases are reported relative to 2012 June 4.5.
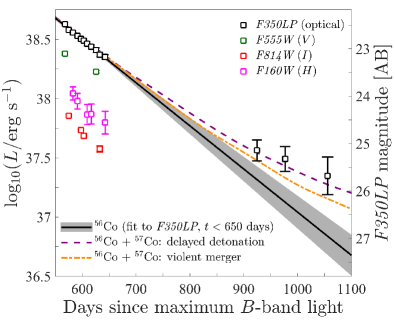
The decay of 56Co to 56Fe has a half-life time of days (Junde et al., 2011). Assuming that the shape of the light curve is set by 56Co decay, we fit an exponential function to the F350LP measurements at days and find a 56Co half-life of days with a value of for nine degrees of freedom. A similar fit to the F160W data results in a half-life of days with . These values are consistent with the half-life time obtained in the laboratory, and with each other. However, they also hint that at days, we may be seeing a redistribution of light from the infrared to the optical, as previously seen in observations of SN 1992A and SN 2003hv (though based on only one and two measurements, respectively; Cappellaro et al. 1997; Leloudas et al. 2009).
In Figure 2, we extrapolate the F350LP fit out to 1100 days to represent the expected light curve due solely to the decay of 56Co to 56Fe. The three F350LP measurements at days are brighter than the extrapolated fit by factors of –. To ascertain at what significance these measurements are inconsistent with the null hypothesis that the light curve is due solely to 56Co decay, we compare between the three days measurements and the model, while taking into account the uncertainties of both. When fitting these measurements, the values for the index and scaling of the decaying exponential function that resulted from fitting the days measurements receive a value of , which calls for a rejection of the null hypothesis at a significance of % (i.e., a -value of , comparable to a detection).
Next, we test whether the days F350LP measurements are consistent with the predictions for the delayed-detonation and violent merger progenitor scenarios. The original predictions are bolometric light curves of SN 2011fe, while we measure the optical component of the light curve of SN 2012cg captured by the F350LP filter. Although the predictions were made for a different SN Ia, SN 2012cg was observed to have a similar intrinsic maximal brightness as SN 2011fe but a slightly broader light curve. We solve both of these potential difficulties by comparing between the predicted bolometric light curve due to 56Co decay for SN 2011fe and our fit to the days F350LP observations of SN 2012cg and scaling down the predicted bolometric light curves accordingly. The F350LP measurements are consistent with the resultant scaled-down predictions but are not precise enough to discriminate with certainty between the two progenitor scenarios.
Here, we have assumed that the emission in F350LP scales with the bolometric luminosity. Milne et al. (2001) have shown that at days, a constant fraction of the luminosity is emitted in the band, which dominates the 3500–9700 Å wavelength range (the same range spanned by F350LP). Past days, the band becomes dominated by Fe lines (see Taubenberger et al. 2015), which, in the absence of the infrared catastrophe (cf. Fransson & Jerkstrand 2015), are the primary coolant of the SN ejecta and hence also proportional to the total luminosity of the SN.
As noted above, the two progenitor scenarios tested here differ, among other things, in the amounts of radioactive iron-group elements produced during the explosion. Thus, a measurement of the ratio between the amount of 56Ni and 57Ni produced during the explosion would provide a strong constraint for any progenitor and explosion model. Here, we compute the luminosity contributed by the decays of 56Co, 57Co, and 55Fe by using the solution to the Bateman equation in the following form (following Seitenzahl et al. 2014):
| (1) |
where is the scaling factor described above; is the atomic number of the decaying nucleus; is the inverse of the half-life time of the decay chain; is the average energy per decay carried by charged leptons and X-rays; is the time since explosion; and we fit for the masses, , of 56Co and 57Co. Our late-time measurements are not precise enough to also fit for the mass of 55Fe, so we set its mass by using a ratio of (model rpc32; Ohlmann et al., 2014). The values of and used here are enumerated in table 1 of Seitenzahl et al. (2009) and table 2 of Seitenzahl et al. (2014). For 57Co, we also take into account the energy emitted by the decay through the 14.4 keV line (1.32 keV per decay).
Several assumptions go into Equation 1:
-
1.
-rays are essentially free-streaming and their contribution to the heating is negligible.
-
2.
Positrons, electrons, and X-rays are fully trapped and instantaneously deposit all their energy.
-
3.
The luminosity is equal to the rate of energy deposition at every time, i.e., we do not take “freeze-out” into account (see, e.g., Kozma & Fransson 1998).
While these assumptions clearly constitute approximations, we presume they are applicable and justified since:
-
1.
The dominant opacity to -rays is Compton scattering. For homologous expansion, the column density, and therefore the opacity to -rays, decreases as . Since, e.g., Cappellaro et al. (1997) find that for a generic SN Ia model the trapping fraction of -rays at days is already down to 0.5%, we conclude that the contribution of -rays is probably safely negligible past days (with the exception of the very low-energy 14.4 keV -ray produced by 57Co decay, which we include in our analysis).
-
2.
The calculations of Seitenzahl et al. (2015) demonstrate that at days full trapping of X-rays produced in radioactive decay of Fe-group nuclei should be a good approximation. The possible escape of positrons is more uncertain. However, at present there is no real indication for positron escape in normal SNe Ia. On the contrary, recent analyses of very late SN Ia observations support full trapping of positrons even past 800 days (see, e.g., Leloudas et al. 2009; Kerzendorf et al. 2014; Fransson & Jerkstrand 2015). If positrons are fully trapped, the much lower-energy electrons would be trapped as well.
-
3.
Fransson & Jerkstrand (2015) demonstrated that, for the case of the similar SN 2011fe, freeze-out effects are essentially negligible out to days in the band, which dominates the emission in F350LP, taking the Taubenberger et al. (2015) SN 2011fe spectrum at 1034 days past explosion as our best guess for the spectral-energy distribution. Furthermore, their freeze-out corrections remain smaller than our measurement uncertainties even at days. Freeze-out effects, therefore, constitute a small correction that would not change our conclusions qualitatively.
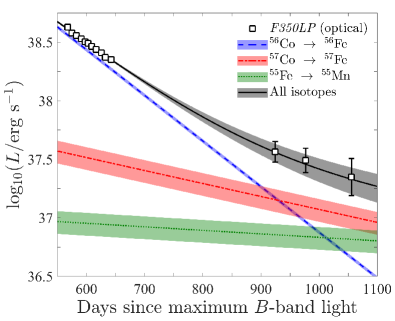
With a value of 2.1 for 12 degrees of freedom, we find a best-fitting 56Co mass of and a mass ratio of . We show the luminosity contributions from each decay chain in Figure 3. Restricting the fit to account only for 56Co and 57Co results in the same 56Co mass but a mass ratio of , larger by a factor of (with a value of ). We do not quote an uncertainty for the 56Co mass as its value is degenerate with the scaling factor . Without a full bolometric light curve, we cannot measure this quantity precisely, but note that it is consistent with 56Ni masses measured in other SNe Ia (Scalzo et al., 2014). The mass ratio, however, is independent of the scaling factor. In Section IV.1, below, we examine the value of the mass ratio in the context of expected yields from various SN Ia explosion models.
Here, we have used to correct for the host-galaxy reddening suffered by SN 2012cg. However, based on the observed colors of SN 2012cg around maximum light, Amanullah et al. (2015) find a lower value of . While this value is consistent with the one we use here, we note that the value of has no effect on the value of , as it depends only on the slope of the F350LP photometry, not their absolute values.
IV. Discussion
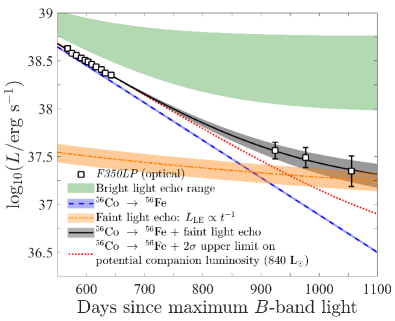
In this section, we first place the mass ratio found above in the context of current SN Ia explosion models. Then, we address two other possible explanations for the slow-down of the decline of the light curve at days: contamination by light echoes or the light from a surviving binary companion. We show the effects of these possible contaminants in Figure 4.
IV.1. Expected 57Co yields from SN Ia explosion models
Here, we assume that nearly all of the mass of the iron-group elements produced by the explosion originates in the decay of various Ni isotopes, so we can approximate (Truran et al., 1967; Woosley et al., 1973). Under this approximation, the mass ratio we measure here is roughly twice the corresponding 57Fe/56Fe ratio measured for the Sun (Asplund et al., 2009). This value is slightly higher than the predictions of near- explosion models: W7 of Iwamoto et al. (1999) predicts 1.7 times Solar, the pure turbulent deflagration models of Fink et al. (2014) predict times Solar, the delayed-detonation models of CO WDs of Seitenzahl et al. (2013) predict times Solar, the delayed-detonation models of WDs with carbon-depleted cores of Ohlmann et al. (2014) predict times Solar, and the gravitationally confined detonation models of Meakin et al. (2009) predict 0.8–1.2 times Solar.
There is a trend that models with larger progenitor metallicity (see Seitenzahl et al. 2013) and models that experience enhanced in-situ neutronization (e.g., W7) yield higher 57Ni/56Ni ratios. This is naturally explained by the fact that 57Ni is a neutron-rich isotope (28 protons, 29 neutrons) and its production relative to the self-conjugate 56Ni (28 protons, 28 neutrons) therefore tends to be enhanced in neutron-rich environments. Model yields where the primary WD is significantly less massive than predict even lower 57Ni/56Ni ratios: the merger model of a CO WD with a CO WD of Pakmor et al. (2012) predicts times Solar and the pure detonation models of CO and ONe WDs of Marquardt et al. (2015) predict around 0.3–0.5 times Solar.
Parikh et al. (2013) have found that the 57Ni/56Ni production ratio is very robust (at the 10% level) to individual changes of nuclear reaction rates by a factor of 10; rate uncertainties are therefore unlikely to solely account for the difference. Therefore, the high 57Co/56Co ratio we find appears to point toward a near- progenitor. This is in agreement with Marion et al. (2015), who interpret the observed early UV excess of SN 2012cg as evidence that the SN occurred as an explosion of a near- WD in the single-degenerate channel.
IV.2. Contamination by a light echo?
Light echoes have been found for other SNe Ia at similar phases hundreds of days after their explosion, e.g., SN1991T (Schmidt et al., 1994; Sparks et al., 1999), SN1995E (Quinn et al., 2006), SN1998bu (Cappellaro et al., 2001), SN2006X (Wang et al., 2008), SN2007af (Drozdov et al., 2015), and SN2014J (Crotts, 2015). Typically, these light echoes were between 10–12 mag fainter than the SNe at peak. Due to observational bias, these observed light echoes are at the bright tail of the distribution of expected light-echo brightnesses (Patat, 2005). Therefore, the excess flux of SN 2012cg at days, which is mag fainter than the SN at peak, is consistent with a light echo. In the following, we investigate this possibility in more detail.
There is no evidence of a resolved light echo at the location of SN 2012cg in the three -day epochs. Using Dolphot,444http://americano.dolphinsim.com/dolphot/ a modified version of HSTphot (Dolphin, 2000), we subtracted a model of the F350LP point-spread function (PSF) from the location of the SN. In each epoch, a visual inspection of the residual map produced by Dolphot revealed no resolved features. To quantify this statement, we compared the root-mean-square (RMS) of the pixel values at the location of the PSF-subtracted SN, measured in rectangular apertures of , , and pixels2, to the distribution of RMS values measured in 100 apertures at random locations up to 15 pixels away in any direction from the SN. In each of the three epochs, the RMS value was within the 16th and 84th percentiles of the distribution, i.e., consistent with the background noise.
We now address the possibility of a non-resolved light echo within the PSF. Let us first consider the shape of the light curve. As we have argued above, the observed excess flux surface brightness is well within the range expected for light echoes. With the reasonable assumption that the scattering dust structures do not vary significantly on the length scales associated with the light echo, the surface brightness of light echoes decays as (e.g., Chevalier 1986; Sugerman 2003). As the light echo is not resolved, we must also take into account that its angular size, which is proportional to the circumference, increases with time, so that the light echo should fade as . We test this hypothesis by fitting a combination of 56Co decay and a light echo decaying as to the data, with the light echo normalization set as a free parameter. Figure 4 shows that this model, with , fits the data well.
Next, we consider whether the observed colors are consistent with the light echo above. Light-echo flux is dominated by the light of the SN around peak, so to first order the color of the light echo is similar to the color of the SN at peak. In addition, the scattering by the dust favors blue light, which can shift the color of the light curve bluewards by a few tenths of a magnitude, depending on the scattering angle (e.g., Rest et al. 2012).
At days, Amanullah et al. (2015) measure mag (Vega, corrected for Galactic extinction). Our photometry allows us to measure the F555WF814W color (similar to ) of SN 2012cg at 570–640 days. As our F555W and F814W measurements were not taken on the same days, we use the python AstroML package (Ivezić et al., 2014)555http://www.astroml.org/ to perform Gaussian process regression and measure the color at any phase within this range. At 600 days, we measure mag (Vega, corrected for Galactic extinction). Hence, at 600 days, SN 2012cg was redder than it was at peak. However, at 600 days there is no excess flux, assuming the light curve is powered solely by 56Co decay (see Figure 2). The combination of 56Co decay and a faint light echo shown in Figure 4 would mean a flux excess of 11%, relative to the 56Co component. Therefore, any contamination by a faint light echo would only minimally change the observed combined color. Thus, the observed color of SN 2012cg at 600 days is consistent with either no light echo or a light echo faint enough that it leaves no trace at this phase. At days, where the excess flux dominates the observed flux and the light-echo hypothesis could be tested best with the color, we only have observations in one filter.
Without much fine-tuning, a light echo can explain the observed colors and light-curve shape. Thus, with no spectrum or color information at late times, we cannot conclusively rule out contamination of our measurements by a light echo. It is a coincidence of nature that the functional forms of the light-echo and 57Co-decay luminosities exhibit the same behavior in the time range probed here, as can be seen by comparing Figures 3 and 4. Unfortunately, further observations of SN 2012cg cannot inform this issue. Our final F350LP measurement already had a signal-to-noise ratio of 3.3; by now, the SN should be as faint or fainter than the background light of NGC 4424.
IV.3. Contamination by a surviving binary companion?
To test whether our measurements at days indicate that the SN had faded to the point where a surviving binary companion could shine through, we first fit all F350LP measurements with a combination of an exponential function, for the SN light curve, and a constant luminosity from the presumptive companion. The best-fitting companion has a luminosity of (, consistent with a red giant. However, pre-explosion HST Wide-Field Planetary Camera 2 images of the location of the SN have produced upper limits of and mag (Graur & Maoz, 2012). Taking into account Galactic and host-galaxy extinctions for these filters results in a upper limit on the F350LP luminosity of a companion star of , as shown in Figure 4. Such a luminosity is consistent with either a red giant or a main-sequence star, but constitutes only % of our measured F350LP luminosities at days. Our upper limit is consistent with the conclusion of Marion et al. (2015) that the pre-maximum UV excess observed in SN 2012cg is the possible signature of interaction between the SN ejecta and a main-sequence companion. We conclude that, while we cannot rule out the presence of a surviving companion star, even if it is present, its contribution to the light curve is still negligible.
V. Conclusions
In conclusion, observations of the SN Ia SN 2012cg more than 900 days after its explosion allow us to reject, at a significance of % (i.e., ), the null hypothesis that the light curve of this SN Ia is powered solely by the radioactive decay chain . Instead, we have shown that our measurements are consistent with predictions that at these late times, the light curve becomes dominated by reprocessing of internal-conversion and Auger electrons, as well as X-rays, emitted by the decay of 57Co into 57Fe, as predicted by Seitenzahl et al. (2009). This constitutes the first evidence for the synthesis of radioactive 57Co during a SN Ia explosion.
We have tested whether the late-time behavior of the light curve of SN 2012cg could be due to contamination by either a light echo or the luminosity from a surviving binary companion. Pre-explosion imaging sets an upper limit on the latter, which makes it a negligible source of contamination. A combination of 56Co decay and a faint light echo, mag fainter than SN 2012cg at peak, fits the data well. Unfortunately, without spectra or colors at late times, we cannot rule out the possibility of light-echo contamination.
Assuming no contamination by light echoes, we have measured a ratio of between the masses of 57Co and 56Co produced by the decay of Ni isotopes synthesized in the explosion. This ratio, which is roughly twice the corresponding Solar 57Fe/56Fe ratio, implies that the progenitor of this SN was probably a near- WD. After this paper was submitted, Fransson & Jerkstrand (2015) found that a ratio times the Solar value was required to fit a spectrum of SN 2011fe days after explosion. It remains to be seen whether observations of other SNe Ia at such late times provide similar ratios and whether SN Ia light curves days after explosion will reveal conclusive evidence of similar leptonic energy-injection channels from the decay of the longer-lived 55Fe.
Facility: HST (WFC3)
References
- Amanullah et al. (2015) Amanullah, R., Johansson, J., Goobar, A., et al. 2015, MNRAS, 453, 3300
- Arnett (1979) Arnett, W. D. 1979, ApJ, 230, L37
- Asplund et al. (2009) Asplund, M., Grevesse, N., Sauval, A. J., & Scott, P. 2009, ARA&A, 47, 481
- Cappellaro et al. (1997) Cappellaro, E., Mazzali, P. A., Benetti, S., Danziger, I. J., Turatto, M., della Valle, M., & Patat, F. 1997, A&A, 328, 203
- Cappellaro et al. (2001) Cappellaro, E., Patat, F., Mazzali, P. A., et al. 2001, ApJ, 549, L215
- Cardelli et al. (1989) Cardelli, J. A., Clayton, G. C., & Mathis, J. S. 1989, ApJ, 345, 245
- Cenko et al. (2012) Cenko, S. B., Filippenko, A. V., Silverman, J. M., Gal-Yam, A., Pei, L., Nguyen, M., Carson, D., & Barth, A. J. 2012, CBET, 3111, 2
- Chan & Lingenfelter (1993) Chan, K.-W., & Lingenfelter, R. E. 1993, ApJ, 405, 614
- Chevalier (1986) Chevalier, R. A. 1986, ApJ, 308, 225
- Chomiuk (2013) Chomiuk, L. 2013, PASA, 30, 46
- Chomiuk et al. (2012) Chomiuk, L., Soderberg, A., Simon, J., & Foley, R. 2012, The Astronomer’s Telegram, 4453, 1
- Colgate & McKee (1969) Colgate, S. A., & McKee, C. 1969, ApJ, 157, 623
- Cortés et al. (2008) Cortés, J. R., Kenney, J. D. P., & Hardy, E. 2008, ApJ, 683, 78
- Crotts (2015) Crotts, A. P. S. 2015, ApJ, 804, L37
- Dolphin (2000) Dolphin, A. E. 2000, PASP, 112, 1383
- Drozdov et al. (2015) Drozdov, D., Leising, M. D., Milne, P. A., Pearcy, J., Riess, A. G., Macri, L. M., Bryngelson, G. L., & Garnavich, P. M. 2015, ApJ, 805, 71
- Filippenko et al. (2001) Filippenko, A. V., Li, W. D., Treffers, R. R., & Modjaz, M. 2001, in Astronomical Society of the Pacific Conference Series, Vol. 246, IAU Colloq. 183: Small Telescope Astronomy on Global Scales, ed. B. Paczynski, W.-P. Chen, & C. Lemme, 121
- Fink et al. (2014) Fink, M., Kromer, M., Seitenzahl, I. R., et al. 2014, MNRAS, 438, 1762
- Fransson & Jerkstrand (2015) Fransson, C., & Jerkstrand, A. 2015, ApJ, 814, L2
- Graur & Maoz (2012) Graur, O., & Maoz, D. 2012, The Astronomer’s Telegram, 4226, 1
- Graur et al. (2014b) Graur, O., Maoz, D., & Shara, M. M. 2014b, MNRAS, 442, L28
- Graur et al. (2014a) Graur, O., Rodney, S. A., Maoz, D., et al. 2014a, ApJ, 783, 28
- Ivezić et al. (2014) Ivezić, Ž., Connolly, A., Vanderplas, J., & Gray, A. 2014, Statistics, Data Mining and Machine Learning in Astronomy (Princeton University Press)
- Iwamoto et al. (1999) Iwamoto, K., Brachwitz, F., Nomoto, K., Kishimoto, N., Umeda, H., Hix, W. R., & Thielemann, F.-K. 1999, ApJS, 125, 439
- Junde et al. (2011) Junde, H., Su, H., & Dong, Y. 2011, Nuclear Data Sheets, 112, 1513
- Kandrashoff et al. (2012) Kandrashoff, M., Cenko, S. B., Li, W., et al. 2012, CBET, 3111, 1
- Kasen & Nugent (2013) Kasen, D., & Nugent, P. E. 2013, ARNPS, 63, 153
- Kerzendorf et al. (2014) Kerzendorf, W. E., Taubenberger, S., Seitenzahl, I. R., & Ruiter, A. J. 2014, ApJ, 796, L26
- Khokhlov (1991) Khokhlov, A. M. 1991, A&A, 245, 114
- Kozma & Fransson (1998) Kozma, C., & Fransson, C. 1998, ApJ, 496, 946
- Lair et al. (2006) Lair, J. C., Leising, M. D., Milne, P. A., & Williams, G. G. 2006, AJ, 132, 2024
- Leloudas et al. (2009) Leloudas, G., Stritzinger, M. D., Sollerman, J., et al. 2009, A&A, 505, 265
- Li et al. (2011) Li, W., Bloom, J. S., Podsiadlowski, P., et al. 2011, Nature, 480, 348
- Maoz et al. (2014) Maoz, D., Mannucci, F., & Nelemans, G. 2014, ARA&A, 52, 107
- Marion et al. (2012) Marion, G. H., Kirshner, R. P., Foley, R. J., Challis, P., & Irwin, J. 2012, CBET, 3111, 3
- Marion et al. (2015) Marion, G. H., Brown, P. J., Vinkó, J., et al. 2015, arXiv:1507.07261
- Marquardt et al. (2015) Marquardt, K. S., Sim, S. A., Ruiter, A. J., Seitenzahl, I. R., Ohlmann, S. T., Kromer, M., Pakmor, R., & Röpke, F. K. 2015, A&A, 580, A118
- Meakin et al. (2009) Meakin, C. A., Seitenzahl, I., Townsley, D., Jordan, IV, G. C., Truran, J., & Lamb, D. 2009, ApJ, 693, 1188
- Milne et al. (1999) Milne, P. A., The, L.-S., & Leising, M. D. 1999, ApJS, 124, 503
- Milne et al. (2001) —. 2001, ApJ, 559, 1019
- Munari et al. (2013) Munari, U., Henden, A., Belligoli, R., Castellani, F., Cherini, G., Righetti, G. L., & Vagnozzi, A. 2013, New A, 20, 30
- Ohlmann et al. (2014) Ohlmann, S. T., Kromer, M., Fink, M., Pakmor, R., Seitenzahl, I. R., Sim, S. A., & Röpke, F. K. 2014, A&A, 572, A57
- Pakmor et al. (2011) Pakmor, R., Hachinger, S., Röpke, F. K., & Hillebrandt, W. 2011, A&A, 528, A117
- Pakmor et al. (2012) Pakmor, R., Kromer, M., Taubenberger, S., Sim, S. A., Röpke, F. K., & Hillebrandt, W. 2012, ApJ, 747, L10
- Parikh et al. (2013) Parikh, A., José, J., Seitenzahl, I. R., & Röpke, F. K. 2013, A&A, 557, A3
- Patat (2005) Patat, F. 2005, MNRAS, 357, 1161
- Perlmutter et al. (1997) Perlmutter, S., Gabi, S., Goldhaber, G., et al. 1997, ApJ, 483, 565
- Quinn et al. (2006) Quinn, J. L., Garnavich, P. M., Li, W., Panagia, N., Riess, A., Schmidt, B. P., & Della Valle, M. 2006, ApJ, 652, 512
- Rest et al. (2012) Rest, A., Sinnott, B., & Welch, D. L. 2012, PASA, 29, 466
- Rodney et al. (2014) Rodney, S. A., Riess, A. G., Strolger, L.-G., et al. 2014, AJ, 148, 13
- Röpke et al. (2012) Röpke, F. K., Kromer, M., Seitenzahl, I. R., et al. 2012, ApJ, 750, L19
- Scalzo et al. (2014) Scalzo, R. A., Ruiter, A. J., & Sim, S. A. 2014, MNRAS, 445, 2535
- Schlafly & Finkbeiner (2011) Schlafly, E. F., & Finkbeiner, D. P. 2011, ApJ, 737, 103
- Schmidt et al. (1994) Schmidt, B. P., Kirshner, R. P., Leibundgut, B., Wells, L. A., Porter, A. C., Ruiz-Lapuente, P., Challis, P., & Filippenko, A. V. 1994, ApJ, 434, L19
- Seitenzahl et al. (2009) Seitenzahl, I. R., Taubenberger, S., & Sim, S. A. 2009, MNRAS, 400, 531
- Seitenzahl et al. (2014) Seitenzahl, I. R., Timmes, F. X., & Magkotsios, G. 2014, ApJ, 792, 10
- Seitenzahl et al. (2013) Seitenzahl, I. R., Ciaraldi-Schoolmann, F., Röpke, F. K., et al. 2013, MNRAS, 429, 1156
- Seitenzahl et al. (2015) Seitenzahl, I. R., Summa, A., Krauß, F., et al. 2015, MNRAS, 447, 1484
- Silverman et al. (2012) Silverman, J. M., Ganeshalingam, M., Cenko, S. B., et al. 2012, ApJ, 756, L7
- Sollerman et al. (2004) Sollerman, J., Lindahl, J., Kozma, C., et al. 2004, A&A, 428, 555
- Sparks et al. (1999) Sparks, W. B., Macchetto, F., Panagia, N., Boffi, F. R., Branch, D., Hazen, M. L., & Della Valle, M. 1999, ApJ, 523, 585
- Stritzinger & Sollerman (2007) Stritzinger, M., & Sollerman, J. 2007, A&A, 470, L1
- Sugerman (2003) Sugerman, B. E. K. 2003, AJ, 126, 1939
- Taubenberger et al. (2015) Taubenberger, S., Elias-Rosa, N., Kerzendorf, W. E., et al. 2015, MNRAS, 448, L48
- Thielemann et al. (1986) Thielemann, F.-K., Nomoto, K., & Yokoi, K. 1986, A&A, 158, 17
- Tody (1986) Tody, D. 1986, in Society of Photo-Optical Instrumentation Engineers (SPIE) Conference Series, Vol. 627, Society of Photo-Optical Instrumentation Engineers (SPIE) Conference Series, ed. D. L. Crawford, 733–+
- Truran et al. (1967) Truran, J. W., Arnett, W. D., & Cameron, A. G. W. 1967, Canadian Journal of Physics, 45, 2315
- Wang et al. (2008) Wang, X., Li, W., Filippenko, A. V., Foley, R. J., Smith, N., & Wang, L. 2008, ApJ, 677, 1060
- Woosley et al. (1973) Woosley, S. E., Arnett, W. D., & Clayton, D. D. 1973, ApJS, 26, 231