Superconducting gap and vortex lattice of the heavy fermion compound
Abstract
The order parameter and pairing mechanism for superconductivity in heavy fermion compounds are still poorly understood. Scanning tunneling microscopy and spectroscopy at ultra-low temperatures can yield important information about the superconducting order parameter and the gap structure. Here, we study the first heavy fermion superconductor, CeCu2Si2. Our data show the superconducting gap which is not fully formed and exhibits features that point to a multi-gap order parameter. Spatial mapping of the zero bias conductance in magnetic field reveals the vortex lattice, which allows us to unequivocally link the observed conductance gap to superconductivity in CeCu2Si2. The vortex lattice is found to be predominantly triangular with distortions at fields close to .
pacs:
74.55.+v, 74.70.Tx, 74.25.UvSuperconductivity in heavy fermion materials was first observed in CeCu2Si2 Steglich1979 and was unexpected. The formation of heavy fermion bands is usually ascribed to the interaction between delocalized conduction electrons and localized magnetic moments, whereas localized magnetic moments in conventional superconductors rapidly destroy superconductivity. Since this discovery, superconductivity has been found in a range of other heavy fermion materials, often in close proximity to a quantum phase transition between a magnetically ordered phase and a phase dominated by Kondo screening. This proximity of superconductivity to a magnetic quantum critical point found in many Ce-based compounds mathur1998 indicates that magnetic fluctuations and the influence of the quantum critical point might promote superconductivity in these materials. The physics near the quantum critical point sensitively depends on the balance between screening of the local magnetic moments and interactions between themDoniach . In CeCu2Si2, slight changes in the exact composition (specifically the Cu-to-Si ratio) result in superconducting crystals ( type), magnetically ordered samples ( type) or samples which exhibit competing phases ( type) Feyerherm ; seiro2010 . Superconductivity occurs close to a spin density wave-type quantum critical point and is expected to be unconventional in nature. Neutron scattering data indicate that superconductivity is mediated by spin fluctuations rather than by phonons stockert2011 . Despite intense research, the precise form of the superconducting order parameter remains elusive. Measurements of the relaxation rate of the nuclear quadrupolar resonance Ishida ; Fujiwara and specific heat under pressure Lengyel have yielded evidence for an unconventional order parameter. Angle-resolved resistivity measurements of the upper critical field exhibit a fourfold symmetry of consistent with a symmetry of the order parameter vieyra2011 . In contrast, recent thermodynamic measurements offer evidence for nodeless multiband superconductivity in , challenging the view that the pairing symmetry is of nodal -wave type Kittaka2014 . Also from theory, different symmetries of the order parameters and different coupling mechanisms have been proposed, e.g. a -wave symmetry for superconductivity mediated by magnetic fluctuations Eremin2008 and, very recently, -wave symmetry emerging from magnetic fluctuations of higher orderIkeda2015 .
Scanning tunneling microscopy and spectroscopy has been successfully employed to study heavy fermion materialsschmidt2010 ; Aynajian2010 as well as Kondo lattice compoundsErnst2011 ; Wahl2011 . Yet, due to the low temperatures required for these experiments, STM and STS have only been applied to few heavy fermion superconductors successfully sakata2000 ; suderow2004 ; yazdani2012 ; Maldonado2012 ; Allan2013 ; Zhou2013 , despite these having been thoroughly studied using macroscopic techniques (see, e.g., ref. Pfleiderer for a review). In particular, quasiparticle interference imaging provides evidence for a pairing symmetry in CeCoIn5 Allan2013 ; Zhou2013 . Imaging the vortex lattice and transitions in the vortex lattice arrangement can yield additional insight into the structure of the superconducting gap Zhou2013 . Here we use a dilution refrigerator-based STM to study the superconducting properties of CeCu2Si2 at temperatures down to 20 mK udai2013 . Experiments have been performed on an type single crystal with a superconducting transition temperature and an upper critical field along of .
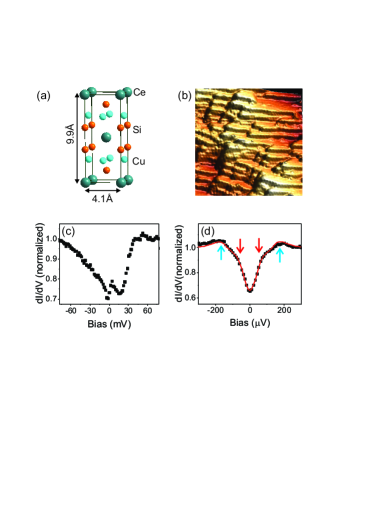
CeCu2Si2 crystallizes in the 4/ body-centered tetragonal structure with lattice parameters and seiro2010 , see Fig. 1(a). Many materials with the same crystal structure cleave easily perpendicular to the crystallographic -axis (e.g. the 122 iron pnictides, YbRh2Si2, CeRh2Si2, YbCo2Si2 and URu2Si2), due to differences in the bond strengths favoring breakage of the crystal within specific planes. CeCu2Si2 crystals do not cleave in a way which yields extended, atomically flat terraces. The bonds within the unit cell appear to be of rather similar strength which prevents the development of a preferred cleaving planecleavenote . Out of more than thirty single crystals which we cleaved, only two resulted in images which exhibit atomic periodicity and atomically flat terraces as reported below.
To promote cleaving in the plane, a groove was cut around the perimeter of the sample in a plane perpendicular to the axis. In order to avoid surface contamination the sample was cleaved in-situ in cryogenic vacuum at a cleaving stage fixed to the plate of the cryostat. After cleaving, the sample was immediately transferred into the STM head. Differential conductance spectra were measured with a lock-in amplifier, with a bias modulation of between 10 and 40 (unless stated otherwise). The base temperature of the instrument is below , the electronic temperature of the instrument has been determined previously to be udai2013 .
After successful cleavage of the sample, flat regions in an area of several hundred nanometers were found. In the absence of a natural cleavage plane, different cleaves result in different surface terminations, and also across the sample, the termination is not the same everywhere. Fig. 1(b) shows an example of atomically flat terraces with steps of a height of in between. For the specific area shown in fig. 1(b), we can analyze the atomic periodicity and tilt angle and can attribute it to a (105) surface. Spectra taken in a range of show a W-shaped feature close to the Fermi level(see Fig. 1(c)), reproducible across different surface terminations. It is suggestive to interpret the peak-like feature near zero bias as a signature of the heavy 4f-bands, its position is consistent with the energy of the Kondo resonance determined from angular resolved photoemissionEhm2007 .
At the lowest temperature achieved, , the differential tunneling conductance measured on this surface reveals a gap-like feature on an energy scale of which we attribute to the superconducting gap, see Fig. 1(d). The spectra do not show a strong dependence on the location on the surface. The tunneling spectrum of the superconducting gap exhibits a rather complex structure with weak coherence peaks at , additional shoulders at and a substantial zero bias conductance of about of the normal state differential conductance. We have attempted to describe the data by different models for the superconducting gap (for details of the fits see epaps ). We find an excellent agreement for two gaps, one which describes the low energy features by a superconducting gap with a -wave symmetry and a second one describing the high energy features by a gap with -wave symmetry. The extracted fitting parameters give for the -wave gap and for the -wave gap. These findings point towards a rather complex multi-gap superconducting order parameter. The ratio of the gap magnitudes of the large and the small gap obtained from the best fit to the tunneling data compares well with the ratio of 2.5 deduced from specific heat Kittaka2014 . The shape of the tunneling spectra is similar to the ones observed in CeCoIn5Zhou2013 ; Allan2013 .
Fig. 2(a) shows for comparison tunneling spectra taken at () at zero magnetic field and at a field of parallel to , close to the upper critical field seiro2010 . As can be seen from the spectrum measured at , the gap has almost closed completely. The temperature dependence of the spectra as shown in Fig. 2(b) reveals that the gap vanishes as the temperature rises from to .
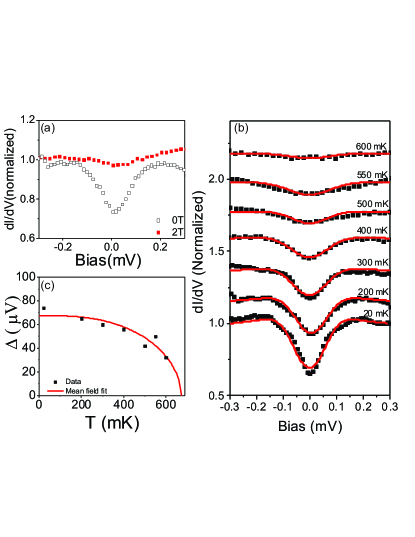
To assess the temperature dependence of the gap size in a more quantitative way, we have used the Dynes equation Dynes1978 to fit the spectra in Fig. 2(b) with a single isotropic -wave gap. While a multi-gap order parameter would be more appropriate, the fit becomes unstable as the features of the spectra become broadened at higher temperatures. The broadening parameter has been fixed to its value at base temperature, and is likely dominated by gap anisotropy and the multigap structure. In addition we have accounted for broadening due to the finite temperature and resolution. While the fits yield overall good agreement with the data, there are also clear deviations, especially for the spectra obtained at the lowest temperatures. We attribute both the fit quality and the large broadening parameter to the fact that the superconducting order parameter in is more complex than just a single -wave gap. We expect the characteristic gap size extracted in this way to be qualitatively representative of the behaviour of the true gap. The temperature dependence of the gap size obtained in this way is shown in Fig. 2(c). It reveals similarity to a mean-field BCS behaviour (red solid line) ruckenstein1987mean . Extrapolation of the gap size to zero Kelvin (see fig. 2(c)) yields a value of , slightly smaller than what is found from an isotropic -wave fit at base temperature ( at ). The difference of the temperature dependence of the gap size for -wave and -wave order parameters is rather minor, so that we would not expect to be able to distinguish them from the temperature dependence of the gap sizewon1994 .
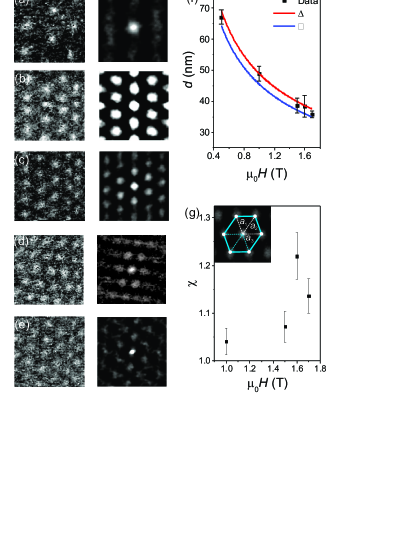
Spatial maps of the zero bias tunneling conductance (ZBTC) at finite magnetic fields can reveal the vortex latticeHess1989 . Observation of the vortex lattice can provide further information on the order parameter. For isotropic order parameter and electronic structure, the vortices usually arrange themselves in a triangular Abrikosov latticeblatter2004 . Other symmetries of the vortex lattice can occur if there is an anisotropic interaction between the vortex cores, e.g. due to the symmetry of the superconducting order parameter or anisotropies of the electronic structure tokuyasu1990vortex ; xu1996structures ; ichioka1996vortex . Maps of the differential conductance at zero bias were taken at magnetic fields of , see Fig. 3(a to e). As expected, the number of vortices is proportional to the applied magnetic field. Despite the rather rough surface morphology, our data show an ordered vortex lattice which is close to triangular symmetry.
We have analyzed the distance between the vortex cores from the autocorrelation of the ZBTC maps along the high symmetry directions of the vortex lattice. The average distance between the neighboring vortices as a function of magnetic field reveals a behaviour consistent with a triangular lattice (fig. 3(f)). As can be seen from figs. 3(a)-(e), our data indicate a distortion of the vortex lattice away from regular triangular symmetry, which becomes largest at magnetic fields of . At this field, the vortex lattice also appears with a different orientation than at smaller or larger fields. We define
| (1) |
as a measure for the asymmetry of the vortex lattice, with corresponding to a regular triangular vortex lattice (see inset in fig. 3(g)). The magnetic field dependence of is plotted in fig. 3(g), confirming a significant distortion of the vortex lattice specifically at a field of comment05 . This distortion is robust across multiple data sets taken with different parameters, excluding drift as a possible reason. Also the surface roughness is unlikely the cause for the anisotropy, because this is similar for the images in fig. 3(a-e).
Further insight into the properties of superconductivity can be obtained by analyzing individual vortex cores. In fig. 4(a), we show the decrease of the zero bias conductance, , as a function of distance from the center of the vortex core, as superconductivity recovers. The characteristic length scale of this recovery, which is a measure of the superconducting coherence length, is determined by fitting an exponential decay to the radial profile of the ZBTC Pan2000 ,
| (2) |
where is the additional conductance in the vortex core and accounts for a constant background. We obtain averaging the decay lengths obtained from the data shown in fig 4(a). This value of is close to the one obtained previously for the coherence length ()Rauchschwalbe1982 .
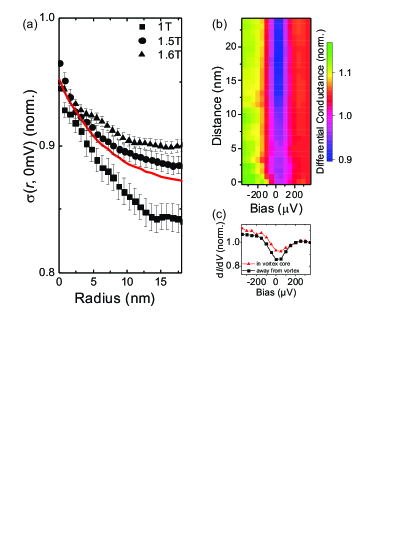
For superconductors with an isotropic gap and which are in the clean limit, strong vortex bound states are expected near the Fermi level Caroli1964 , which give rise to a strong peak in differential conductance spectra recorded in the center of a vortex coreHess1989 . Spectra of the differential conductance acquired inside a vortex core and away from it show no evidence for a vortex bound state (see Fig. 4(b, c)). This behaviour is consistent with a not fully formed gap on some bands or a considerable amount of scattering in the superconductor (or at the surface). The mean free path in is on the order of Rauchschwalbe1982 , therefore the material is not in the clean limit.
The zero bias conductance extracted from tunneling spectra at zero field agrees reasonably well with specific heat data of Kittaka et al. Kittaka2014 : at zero field and , our tunneling spectra yield a ZBTC of of the normal state conductance, whereas the normalized specific heat at () is about of the one in the normal state. This shows that the superconducting gap we detect in tunneling spectra at the surface is consistent with what one would expect from bulk superconductivity as measured by specific heattsutsumi2014 .
It is interesting to compare our observations to the case of , where experiments suggest a -wave symmetry of the order parameterAllan2013 ; Zhou2013 . The spectra we have observed at base temperature (see fig. 1(d)) show a striking similarity with tunneling spectra of the superconducting gap in the heavy fermion superconductor CeCoIn5 Allan2013 ; Zhou2013 . Small angle neutron scattering of the vortex lattice in has previously shown substantial variations from triangular to square and rhombic lattice symmetriesBianchi2008 .
In conclusion, our tunneling spectroscopic measurements on the first discovered heavy fermion superconductor, CeCu2Si2, show clear evidence for superconductivity with at least two distinct gaps, with the best fits obtained for the smaller with -wave character and the larger with -wave character. Although the observed gap does not open fully, the temperature and magnetic field dependent measurements establish its link to superconductivity. Characterization of the vortex lattice shows a triangular vortex lattice at low fields with significant distortion at fields around indicating an anisotropic interaction between vortex cores. The features observed in the tunneling spectra at low energy support a multi-gap scenario. The shape of the gap detected in tunneling spectroscopy as well as the distortion of the vortex lattice indicate similarities with superconductivity in CeCoIn5.
We gratefully acknowledge K. Machida and Y. Fasano for stimulating discussions. ZS acknowledges support from NWO (grant no. 680.50.1119).
References
- (1) F. Steglich, J. Aarts, C. D. Bredl, W. Lieke, D. Meschede, W. Franz, H. Schäfer, Phys. Rev. Lett. 43, 1892, (1979).
- (2) N.D. Mathur, F.M. Grosche, S.R. Julian, I.R. Walker, D.M. Freye, R.K.W. Haselwimmer and G.G. Lonzarich, Nature 394, 39 (1998).
- (3) S. Doniach, Physica B 91, 231 (1977).
- (4) R. Feyerherm, et al., Phys. Rev. B 56, 699 (1997).
- (5) S. Seiro, M. Deppe, H. Jeevan, U. Burkhardt and C. Geibel, Phys. Status Solidi B 247, 614–616 (2010).
- (6) O. Stockert, J. Aarndt, E. Faulhaber, C. Geibel, H.S. Jeevan, S. Kirchner, M. Loewenhaupt, K. Schmalzl, W. Schmidt, Q. Si, F. Steglich Nat. Phys. 7, 119, (2011).
- (7) K. Ishida, et al., Phys. Rev. Lett. 82, 5353 (1999).
- (8) K. Fujiwara, et al., J. Phys. Soc. Jpn. 77, 123711 (2008).
- (9) E. Lengyel, et al., Phys. Rev. B 80, 140513 (2009).
- (10) H. A. Vieyra, N. Oeschler, S. Seiro, H. S. Jeevan, C. Geibel, D. Parker, F. Steglich, Phys. Rev. Lett. 106, 207001, (2011).
- (11) S. Kittaka, Y. Aoki, Y. Shimura, T. Sakakibara, S. Seiro, C. Geibel, F. Steglich, H. Ikeda, and K. Machida Phys. Rev. Lett. 112, 067002 (2014).
- (12) I. Eremin, G. Zwicknagl, P. Thalmeier, and P. Fulde, Phys. Rev. Lett. 101, 187001 (2008).
- (13) H. Ikeda, M.-T. Suzuki, and R. Arita Phys. Rev. Lett. 114, 147003 (2015).
- (14) A.R. Schmidt, M. H. Hamidian, P. Wahl, F. Meier, A. V. Balatsky, J. D. Garrett, T. J.Williams, G. M. Luke and J. C. Davis, Nature 465, 570 (2010).
- (15) P. Aynajian, E.H. da Silva Neto, C. V. Parker, Y. Huang, A. Pasupathy, J. Mydosh, and A. Yazdani, Proc. Natl. Acad. Sci. 107, 10383 (2010).
- (16) S. Ernst, S. Kirchner, C. Krellner, C. Geibel, G. Zwicknagl, F. Steglich, and S. Wirth, Nature 474, 362–366 (2011).
- (17) P. Wahl, L. Diekhöner, M.A. Schneider, F. Treubel, C.T. Lin, and K. Kern, Phys. Rev. B. 84, 245131 (2011).
- (18) P. Aynajian, E. H. da Silva Neto, A. Gyenis, R. E. Baumbach, J. D. Thompson, Z. Fisk, E. D. Bauer, and A. Yazdani, Nature 486, 201 (2012)
- (19) A. Maldonado, I. Guillamon, J. G. Rodrigo, H. Suderow, S. Vieira, D. Aoki, and J. Flouquet, Phys. Rev. B. 85, 214512 (2012).
- (20) H. Sakata, N. Nishida, M. Hedo, K. Sakurai, Y. Inada, Y. Onuki, E. Yamamoto, Y. Haga, J. Phys. Soc. J. 69, 1970–1973, (2000).
- (21) H. Suderow, S. Vieira, J.D. Strand, S. Bud’ko, P.C. Canfield, Phys. Rev. B 69, 060504, (2004).
- (22) B. B. Zhou, S. Misra, E. H. da Silva Neto, P. Aynajian, R. E. Baumbach, J. D. Thompson, E. D. Bauer and A. Yazdani, Nat. Phys. 9, 474–479, (2013).
- (23) M. P. Allan, F. Massee, D. K. Morr, J. Van Dyke, A. W. Rost, A. P. Mackenzie, C. Petrovic and J. C. Davis, Nat. Phys. 9, 468–473, (2013).
- (24) C. Pfleiderer, Rev. Mod. Phys. 81, 1551–1624 (2009).
- (25) U. Singh, M. Enayat, S. White, and P. Wahl, Rev. Sci. Instrum. 84, 013708 (2013).
- (26) This is likely related to the comparatively small c/a ratio, which indicates a so-called collapsed structure with strong Si-Si bonds between adjacent Cu-Si layers.
- (27) D. Ehm, S. Hüfner, F. Reinert, J. Kroha, P. Wölfle, O. Stockert, C. Geibel, and H. v. Löhneysen, Phys. Rev. B 76, 045117 (2007).
- (28) see supplementary information in the EPAPS.
- (29) R.C. Dynes, V. Narayanamurti, and J. P. Garno, Phys. Rev. Lett. 41, 1509 (1978).
- (30) Ruckenstein, A. E. and Hirschfeld, P. J. and Appel, J., Phys. Rev. B. 36, 857 (1987).
- (31) H. Won and K. Maki, -wave superconductor as a model of high- superconductors, Phys. Rev. B 49, 1397 (1994).
- (32) H.F. Hess, R.B. Robinson, R.C. Dynes, J.M. Valles, and J.V. Waszczak, Phys. Rev. Lett. 62, 214 (1989).
- (33) G. Blatter, M. V. Feigelman, V. B. Geshkenbein, A. I. Larkin, V. M. Vinokur Rev. Mod. Phys. 66, 1125 (1994).
- (34) Tokuyasu, T.A. and Hess, D.W. and Sauls, J.A., Phys. Rev. B., 41, 8891 (1990),
- (35) Ji-Hai Xu and Yong Ren and Chin-Sen Ting, Phys. Rev. B., 53, R2991 (1996),
- (36) Ichioka, M. and Hayashi, N. and Enomoto, N. and Machida, K., Phys. Rev. B., 53, 15316 (1996).
- (37) There is also a deviation at , where however we observe only a few vortex cores within the field view and therefore it is difficult to extract lattice distances.
- (38) S.H. Pan, E.W. Hudson, A.K. Gupta, K.-W. Ng, H. Eisaki, S. Uchida, and J.C. Davis, Phys. Rev. Lett. 85, 1536–1539 (2000).
- (39) U. Rauchschwalbe, W. Lieke, C. D. Bredl, F. Steglich, J. Aarts, K. M. Martini, A. C. Mota, Phys. Rev. Lett. 49, 1448–1451, (1982)
- (40) C. Caroli, P.G. de Gennes, and J. Matricon Phys. Lett. 9, 307–309, (1964).
- (41) Y. Tsutsumi, K. Machida and M. Ichioka, Phys. Rev. B 92, 020502 (2015).
- (42) A.D. Bianchi, et al., Science 319, 177–180 (2008).