Discovery of a young planetary mass companion to the nearby M dwarf VHS J125601.92-125723.9 ∗
Abstract
In a search for common proper motion companions using the VISTA Hemisphere Survey (VHS) and the 2MASS catalogs we have identified a very red ( mag) late-L dwarf companion of a previously unrecognized M dwarf VHS J125601.92-125723.9 (hereafter VHS 1256-1257), located at a projected angular separation of 806 003. In this work we present a suite of astrometric, photometric, and spectroscopic observations of this new pair in an effort to confirm the companionship and characterize the components. From low-resolution ( 130–600) optical and near-infrared spectroscopy we classified the primary and the companion as an M and L, respectively. The primary shows slightly weaker alkali lines than field dwarfs of similar spectral type, but still consistent with either a high-gravity dwarf or a younger object of hundreds of millions of years. The secondary shows spectral features characteristic for low surface gravity objects at ages below several hundred million years, like the peaked triangular shape of the -band continuum and alkali lines weaker than in field dwarfs of the same spectral type. The absence of lithium in the atmosphere of the primary and the likely kinematic membership to the Local Association allowed us to constrain the age of the system to the range of 150–300 Myr. We report a measurement of the trigonometric parallax = 78.8 6.4 mas, which translates into a distance of 12.7 1.0 pc; the pair thus has a projected physical separation of 102 9 AU. We derived the bolometric luminosities of the components and compared them with theoretical evolutionary models to estimate the masses and effective temperatures. For the primary, we determined a luminosity of , and inferred a mass of 73 at the boundary between stars and brown dwarfs and an effective temperature of K. For the companion we obtained a luminosity of and a mass of 11.2 placing it near the deuterium-burning mass limit. The effective temperature derived from evolutionary models is 880 K, about 400–700 K cooler than the temperature expected for field late-L dwarfs.
Subject headings:
stars: brown dwarfs – stars: imaging – infrared: planetary systems – stars: individual (VHS J125601.92-125723.9)1. Introduction
Very low-mass stars and brown dwarfs directly imaged around stars constitute an important group for studies of the properties of substellar objects. We can infer the distance and metallicity of the companion from the brighter, more easily characterizable primary star. Most importantly, we can constrain the age of the system and thus overcome the intrinsic degeneracy between mass and age for the temperature and luminosity of objects below the hydrogen burning limit. This allows for a more thorough characterization and offers the opportunity to better understand their physical properties and to test evolutionary and atmospheric models (e.g., Pinfield et al. 2006,Faherty et al. 2010). There are about 1500 objects spectrally classified as M7 and later, the vast majority is found to be isolated, single sources that appear to have spectral energy distributions, photometric colors, and kinematics consistent with a field population with ages in the range from 2 to 8 Gyr (Knapp et al., 2004; Cruz et al., 2007; Faherty et al., 2009). About 120 ultracool dwarfs (late-M, L, T, and Y dwarfs) have been confirmed as components of binary or multiple systems (Faherty et al., 2010; Deacon et al., 2014). These objects discovered over the last two decades have exhibited a large diversity in ages, atmospheric properties, and chemical compositions.
Surveys aimed at identifying low-mass companions of young stars (e.g., Wahhaj et al., 2011; Bowler et al., 2013; Chauvin et al., 2014), and the least massive members of young star clusters (e.g., Béjar et al., 2011; Peña Ramírez et al., 2012; Zapatero Osorio et al., 2014b), as well as searches for L and T dwarfs in the field using large sky area surveys (Kirkpatrick et al., 2006; Cruz et al., 2009) have revealed a number of ultracool dwarfs that exhibit photometric and spectral properties different from typical late-type objects of the field population. Some of these peculiarities have been attributed to low surface gravities and cloudy atmospheres, occurring at the early stages of evolution, below several hundred million years (Cruz et al., 2009; Allers & Liu, 2013; Zapatero Osorio et al., 2014a). Young L dwarfs, either free-floating or as companions to stars, were found to share similar characteristics. They have very red colors ( 2 mag), -band absolute magnitudes fainter than their old, field counterparts, and show distinctive spectral features such as, for example, a sharply peaked, triangal-shaped continuum in the band and weaker sodium and potassium lines.
Recent studies have revealed a strong resemblance between the young L dwarfs and directly imaged planetary mass companions (e.g., 2MASS 1207-39 b, Chauvin et al. 2005, HR 8799 bcde, Marois et al. 2008, 2010, GJ 504 b Kuzuhara et al. 2013, Pic b, Lagrange et al. 2009). They have similar near-infrared (near-IR) colors and absolute magnitudes, overlapping effective temperature regimes of 1000–1500 K and masses of a few to a few tens of Jupiter masses (Barman et al., 2011a; Bowler et al., 2013; Faherty et al., 2013b, 2014; Liu et al., 2013). Spectroscopic and photometric studies of young substellar objects can provide information on the physical properties of gas giant exoplanets found by transit and radial velocity surveys, in particular, on the characteristics and composition of their complex atmospheres.
In this work we present the identification and characterization of a nearby, young binary system with components that we classify as M and L. In Section 2 we describe the data and search method that led to the identification of the pair. Section 3 contains the description of observations aimed at confirming their companionship and characterization. In Section 4 we discuss their physical properties. We classify their spectral types, and determine the distance and radial and space velocities. We constrain the possible age of the system and estimate the luminosities, masses, and effective temperatures of the two components. Final remarks and conclusions are presented in Section 5.
2. Identification of the system
2.1. VISTA Hemisphere Survey Data
The reported common proper motion pair was identified using the VISTA Hemisphere Survey (VHS) data and the 2MASS (Skrutskie et al., 2006). The VHS is a near-IR ESO public survey designed to map the entire southern hemisphere in the and broad-band filters with average 5 depths of mag and mag (McMahon et al., 2013). In some particular areas also observations in the and bands are also performed. The 4-m VISTA telescope (Emerson, 2001; Emerson et al., 2004) has operated since 2009 at ESO’s Cerro Paranal Observatory in Chile and has thus far covered about 8000 deg2 of the sky. It is equipped with a wide-field infrared camera VIRCAM (Dalton et al., 2006) composed of 16 Raytheon detectors 20482048 pixel array each, with a mean plate scale of 034, giving a field of view of 1.65 in diameter.
The VHS images are processed and calibrated automatically by a dedicated science pipeline implemented by the Cambridge Astronomical Survey Unit (CASU). Standard reduction and processing steps include dark and sky subtraction, flat-field correction, linearity correction, destripe, and jitter stacking. For a detailed description we refer the reader to the CASU webpage http://casu.ast.cam.ac.uk/surveys-projects/vista as well as to Irwin et al. (2004) and Lewis et al. (2010).
The photometry provided in the VHS catalog is calibrated using the 2MASS magnitudes of all matching stars converted onto the VISTA system applying color equations666http://casu.ast.cam.ac.uk/surveys-projects/vista/technical/photometric-properties, which include terms accounting for the interstellar reddening. Photometric calibrations are determined to an accuracy of 1%–2%. The astrometric solution for VHS observations is obtained through the CASU pipeline, using the 2MASS point source catalog. The objects on the catalogs extracted from each detector are matched to their counterparts in 2MASS using a correlation radius of 1″. Because 2MASS has a high degree of internal consistency it is possible to calibrate the world coordinate system of VISTA images to relative accuracy better than 01.
2.2. Search Method
Using VHS data, we carried out a search for high proper motion objects, by cross-matching VHS sources with the 2MASS Point Source Catalog (Skrutskie et al., 2006). The search focused on objects that had moved at least 2″and a maximum of 30″from 2MASS to VHS. The time baseline between the two surveys is typically about 12 yr, which gives proper motions of approximately 0.15–3.0 arcsec yr-1. Over the common area of 5000 deg2 between 2MASS and VHS we found more than 6000 objects with magnitudes in the range 11–17 mag and proper motion higher than 150 mas yr-1. We have cross-correlated this catalog with WISE (Wright et al., 2010), so that near and mid-infrared information is available for each target. Most of the high proper motion objects are relatively nearby M dwarfs with estimated photometric distances 50 pc (A. Perez-Garrido et al., in preparation). We have searched for common proper motion pairs and multiples among these objects with proper motion consistent within 40 mas yr-1 in both right ascension and declination (, ). VHS 1256-1257 system was one of the identified candidates. The pair was observed with the VISTA filters and with a seeing of 11 on 2011 July 1. The primary and the secondary were cataloged in 2MASS with designations 2MASS J125602.15-125721.7 and 2MASS J125601.83-125727.6, respectively. The primary was also listed as SIPS 1256-1257 in the sample of low-mass stars with yr-1 from Deacon & Hambly (2007), with measured proper motion amplitude = 0357 yr-1 and the position angle of the proper motion vector of 244.76°.
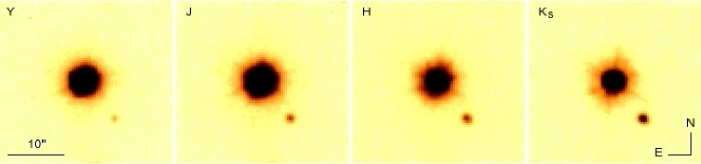
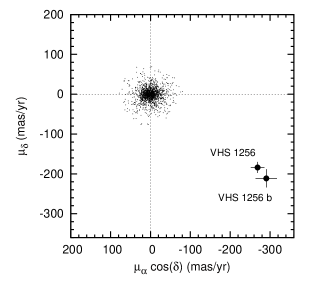
VISTA images of the pair are presented in Fig. 1 and the photometry is given in Table 2. The companion is located at a projected angular separation of 806003, at a position angle of 218102. This separation corresponds to a projected orbital separation of AU at the estimated distance of the system (Section 4.2). The two components share a common proper motion, which significantly differs from the proper motion of background stars as shown in Fig. 2. The and measured from the VHS and 2MASS positions of the sources, were , and and mas yr-1, for the primary and secondary, respectively. The uncertainties in proper motion of each component correspond to the rms of and of the background stars within a one-degree radius around the primary, and magnitudes similar to that of the given component. Time baseline between the two epochs is 12.3 yr. The primary has mag and mag (2MASS photometry, VIRCAM is out of the linear range) The secondary is roughly six magnitudes fainter in the band ( mag) and has a very red color of 2.47 mag indicating its significantly cooler type and lower mass with respect to the primary.
| Obs. Date | Tel/Instrument | Mode | Wavelength | Exp. Time | Seeing | Slit | Grating | Scale | Res. |
|---|---|---|---|---|---|---|---|---|---|
| (UT) | (m) | (s) | (″) | (″) | (″/pix) | Power | |||
| 2011 Jul 01aafootnotemark: | VISTA/VIRCAM | Img | 15, 15, 7.5, 7.5 | 1.0 | – | – | 0.34 | – | |
| 2014 Mar 02bbfootnotemark: | GTC/OSIRIS | Spec | 0.48–1.00 | 120 | 0.57 | 1.5 | R500R | 0.25 | 320 |
| 2014 Mar 12aafootnotemark: | NTT/SofI | Spec | 0.95–1.64 | 4600 | 0.8 | 1.0 | Blue | 0.29 | 600 |
| 2014 Mar 12aafootnotemark: | NTT/SofI | Spec | 1.53–2.52 | 4900 | 0.8 | 1.0 | Red | 0.29 | 600 |
| 2014 Apr 22, May 04bbfootnotemark: | NOT/ALFOSC | Spec | 0.63–0.68 | 900, 4900 | 0.8–1.1 | 1.3 | Grism#17 | 0.19 | 4700 |
| 2014 Apr 27aafootnotemark: | NTT/SofI | Img | 92 | 1.0–1.3 | – | – | 0.29 | – | |
| 2014 May 14bbfootnotemark: | GTC/OSIRIS | Spec | 0.56–0.77 | 3600 | 0.56 | 0.6 | R2500R | 0.25 | 3000 |
| 2014 Jun 03aafootnotemark: | GTC/OSIRIS | Spec | 0.48–1.00 | 3600 | 0.63 | 1.5 | R300R | 0.25 | 130 |
| 2014 Jul 01, 09, 10bbfootnotemark: | VLT/UVES | Spec | 0.37–0.49 | 33300 | 0.5–1.7 | 1.0 | CD2, 4 | 0.22 | 40000 |
| 2014 Jul 01, 09, 10bbfootnotemark: | VLT/UVES | Spec | 0.56–0.95 | 33300 | 0.5–1.7 | 1.0 | CD2, 4 | 0.16 | 40000 |
| 2014 Jul 15bbfootnotemark: | IAC80/CAMELOT | Img | 300 | 1.1 | – | – | 0.30 | – | |
| 2014 Jul 17aafootnotemark: | WHT/ACAM | Img | Sloan | 930, 930 | 0.85 | – | – | 0.25 | – |
| 2014 Jul 18aafootnotemark: | WHT/LIRIS | Img | 592 | 0.7 | – | – | 0.25 | – | |
| 2014 Dec 19, 20bbfootnotemark: | IAC80/CAMELOT | Img | 6300 | 1.5, 1.2 | – | – | 0.30 | – |
3. Follow-up observations and data reduction
3.1. NTT/SofI Near-infrared Spectroscopy and Imaging
To measure the infrared spectral types of the VHS 1256-1257 components we performed follow-up near-IR spectroscopy using the Son of ISAAC (SofI) spectro-imager installed on the 3.6 m New Technology Telescope (NTT) on 2014 March 12. SofI is equipped with a Hawaii HgCdTe detector with 10241024 pixel array offering a field of view of 4.94.9 arcmin2 with a 0288 pixel scale. We have used blue and red grisms covering the 950–1640 and 1530–2520 nm range, combined with a slit of 1″, orientated along the position angle of the components of the system. This instrumental configuration provides a nominal dispersion of 6.96 and 10.22 Å pix-1 for the Blue and Red grating, respectively. To subtract the sky background we used an ABBA nodding pattern with an offset of 20″between the two positions. Individual exposure times were 600 and 900 s for the red and blue grism, respectively. Right after VHS 1256-1257 we observed a telluric standard star HD 112304 ( mag, A0V, Høg et al., 2000; van Leeuwen, 2007). The sky conditions during the observations were clear with sub-arcsecond seeing.
The two-dimensional (2D) images were reduced and combined using the ESO SofI pipeline run within the environment. The traces of the primary and the companion spectra on the 2D images were clearly separated and there was no contamination between the two sources. The two spectra of the VHS 1256-1257 system and of HD 112304 were then extracted using standard IRAF routines within the apall package and wavelength calibrated via Xenon arc lines. The dispersion solution had an rms of 0.4 and 0.35 Å for the blue and red part of the spectrum, respectively. The final resolution of the spectrum was 24 Å ( 600). Telluric absorption lines were corrected, dividing the spectra by the A0V telluric standard HD 112304 observed at a similar airmass, and multiplying by a blackbody of a corresponding effective temperature of 9480 K. The obtained NTT SofI spectra of VHS 1256-1257 primary and companion normalized at 1.6 m are displayed in Figure 3.
On 2014 April 27 we used SofI in imaging mode, to perform - and -band observations at an additional epoch. We used a nine-position dither pattern with individual exposures of 5 s. The weather was clear, with a seeing of 115–130. Raw images were reduced using the ESO SofI Pipeline within Gasgano, which includes bias subtraction, flat-field correction, plane re-centering, and co-addition of individual frames to a final image. Images were employed for determining the trigonometric parallax of the system and for performing relative astrometry between the two components as described in Section 4.2. Table 4 provides these measurements.
3.2. GTC/OSIRIS Optical Spectroscopy
We obtained low-resolution optical spectroscopy of VHS 1256-1257 with the Optical System for Imaging and low-intermediate Resolution Integrated Spectroscopy (OSIRIS; Cepa, 2010) mounted on the 10.4-m Gran Telescopio de Canarias (GTC) telescope in La Palma. OSIRIS is equipped with two 20484096 Marconi CCD42-82 detectors offering a field of view approximately 77 arcmin2 with an unbinned pixel scale of 0125. We observed the primary star using two different gratings: R500R, which allowed us to measure the general spectral energy distribution at a resolution of 320, covering the 0.48–1.00 m range, and R2500R providing a resolution of 3000 in the 0.56–0.77 m region, which we used to study the H and Li i lines. Observations with R500R and R2500R were acquired on 2014 March 2 and May 14, respectively. On 2014 June 3, both the primary and secondary were aligned on the 15-width slit and were observed simultaneously using the R300R grating. This instrumental setup provided optical spectra with a resolving power of 130, which is optimal to maximize the signal-to-noise ratio of the faint companion data. Observations were performed in service mode (Table 1) as part of a GTC filler program (number GTC5-14A; PI Lodieu). The nights were dark with a clear sky and a seeing of 06. Details of the used instrumental configurations and exposure times are provided in Table 1. The spectrophotometric standards, Hiltner 600, GD 153, and Ross 640 (Høg et al., 1998, 2000; Pancino et al., 2012) were observed with the R500R+GR, R2500R, and R300R gratings, respectively, on the same night of the scientific observations. Observations of the standards with R300R and R500R were done with the same grating combined with the Sloan filter to correct for second-order contamination beyond 9200 Å (see procedure in Zapatero Osorio et al. 2014a). Bias frames, continuum lamp flat fields, and Neon Xenon arc lamps were observed by the observatory staff during the afternoon preceding the observations.
We reduced the OSIRIS spectra using routines within iraf. We subtracted the raw spectra by a median-combined bias and divided by a normalized continuum lamp flat field. From the optimally combined 2D images we extracted the spectra using the apall routine and calibrated in wavelength with the lines from the combined arc lamp. To improve the detection of the secondary in observations with R300R we inserted both components in the slit and used the trace of the primary as a reference to combine the individual exposures. Correction of the instrumental response was done using the corresponding spectrophotometric standards observed during the same nights. The obtained spectra are displayed in Figures 3, 4 and 6.
3.3. NOT/ALFOSC Optical Spectroscopy
For a first estimate of the radial velocity of the primary star, intermediate-resolution optical spectroscopy was acquired for VHS 1256-1257 A using the Andalucia Faint Object Spectrograph and Camera (ALFOSC) instrument of the 2.5 m Nordic Optical Telescope (NOT) operating at the Observatorio del Roque de los Muchachos, La Palma. The camera uses a E2V back illuminated CCD42-40 chip with 2k2k pixels with a scale of 0.19 arcsec pix-1, providing a field of view of 6.46.4 arcmin2. We observed the primary in two different epochs, on the nights of 2014 April 22 and May 5. For the instrument setup we chose Grism#17 and a 13 slit providing a wavelength range of 6330.4–6853.6 Å and a nominal resolution of 0.255 Å pix-1. On the first night one useful exposure of 900 s was obtained under the presence of variable clouds. On the second night four exposures of 900 s were taken, under clear sky conditions. The seeing was similar on both nights (08–11), and hence the final resolution of the spectra was also very similar: 1.5 Å ( 4700). During the same nights using the same instrumental configuration, we also observed the star GJ 388, which is a M4.5V with a precise radial velocity determination of km s-1 by Chubak et al. (2012).
Raw data were reduced using routines within the iraf environment. Two dimension images were bias corrected and flat fielded using continuum lamps normalized using the response routine. Spectra were optimally extracted using the apall routine and were wavelength calibrated using HeNe lamps and a cubic spline function fit of the order of three, providing an rms better than 0.06 Å. Final spectra were corrected by the instrumental response using the spectrophotometric standard HZ44.
3.4. VLT/UVES Optical Spectroscopy
To measure a more precise radial velocity and to investigate in detail the spectral signatures of youth of the primary star, like the Li i line at 670.82 nm we also obtained a high-resolution spectrum of VHS 1256-1257 A using the Ultraviolet and Visual Echelle Spectrograph (UVES) mounted on the Kueyen unit of the ESO Very Large Telescope. UVES is a two-arm crossdispersed echelle spectrograph covering the wavelength range 300–500 nm (blue) and 420–1100 nm (red), with the possibility to use dichroic beam splitters. The instrument is equipped with a single chip in the blue arm and a mosaic of two chips in the red arm. The blue CCD is a 2K4K, 15 m pixel size thinned EEV CCD-44. The red CCD mosaic is made of an EEV chip of the same type and the MIT/LL CCID-20 chip. Each arm has two cross disperser gratings working in first spectral order; the typical order of separation is 10″. We have used the standard dichroic mode setting, which covers the 565–950 nm spectral range in the red arm, with the central wavelength at 760 nm, and a 373–499 nm range in the blue arm, centered at 437 nm. This configuration, with 1 arcsec slit, provides spectral resolution of 40 000 (25 mA/pix). Observations were performed in service mode under the ESO DDT program 293.C-5014(A) on 2014 July 1, 9 and 10, with clear sky conditions. The total integration time was 9900 s divided into three exposures of 3300 s.
The spectra were reduced, extracted, and calibrated using the ESO UVES pipelines under the ESO Recipe Flexible Execution Workbench environment (Reflex, Freudling et al., 2013). The reduction steps of the workflow executed by the software include creation of master flat and bias frames, with the corresponding corrections of science data and detection of the order positions on the detector. Subsequently, a wavelength calibration solution is obtained from an input arc-lamp frames. We have used the ThAr arcs acquired in both blue and red arms, during the afternoon preceding the observations. Instrument characteristics description provides a note of caution in that in the spectral region above 700 nm the ThAr lamp has some very bright Argon lines that saturate the CCDs, and the heavily saturated lines may contain remnants in the following exposures. Here the calibration frames were taken more than four hours before the night, i.e. more than the typical time after which the remnants vanish. Then, the spectrum from each order is extracted and merged. Last, the flux-calibration of the science spectrum is carried out, using the appropriate instrument response curve, in the blue part obtained from a standard star observation, and from the instrument master response curve in the red part. We have corrected the telluric absorption features in the spectrum using the ESO Molecfit software (Smette et al., 2015; Kausch et al., 2015). The results obtained using the UVES data are described in Section 4.4, with the final spectra presented in Figures 10 and 11.
| Astrometry | Primary | Companion |
|---|---|---|
| R.A. (J2000)aafootnotemark: | 12h56m01s.922 | 12h56m01s.586 |
| Decl. (J2000)aafootnotemark: | 12°57′23990 | 12°57′30310 |
| 2MASS ID | J125602.15-125721.7 | J125601.83-125727.6 |
| Separation (arcsec)aafootnotemark: | 8.06 0.03 | |
| Separation (AU) | ||
| Position angle (deg)aafootnotemark: | 218.1 0.2 | |
| (mas yr-1) | ||
| (mas yr-1) | ||
| Parallax (mas) | ||
| Distance (pc) | ||
| (km s-1) | … | |
| U (km s-1) | … | |
| V (km s-1) | … | |
| W (km s-1) | … | |
| Photometry | ||
| (mag) | … | |
| (mag) | … | |
| Sloan (mag) | … | |
| Sloan (mag) | … | |
| 2MASS (mag) | ||
| 2MASS (mag) | ||
| 2MASS (mag) | ||
| VHS (mag) | 11.72 bbfootnotemark: | |
| VHS (mag) | 11.36 bbfootnotemark: | |
| VHS (mag) | 11.02 bbfootnotemark: | |
| VHS (mag) | 10.42 bbfootnotemark: | |
| WISE W1 (mag) | ||
| WISE W2 (mag) | ||
| WISE W3 (mag) | 11.8 | |
| WISE W4 (mag) | 8.65 | |
| Spectral Classification | ||
| Optical | M | L |
| Near-IR | M | L |
| Near-IR | M | L |
| H2O index | M | L4.0 |
| H2OD index | L0 | L |
| H2O-1 index | M | … |
| H2O-2 index | M | … |
| Adopted spectral type | M | L |
| Near-IR gravity class | INT-G | VL-G |
| Physical Properties | ||
| Age (Myr) | 150 – 300 | |
| Mass () | 73 | 11.2 |
| (K) | 880 | |
| 4.25 | ||
3.5. IAC80/CAMELOT Imaging
On 2014 July 15 and December 19 and 20 we performed imaging observations of the primary using CCD Camera CAMELOT of the 0.8 m IAC80 telescope at the Teide Observatory on Tenerife. We aimed to obtain optical photometry in the (Johnson-Bessell’s) filters. The images were also used in the parallax determination. The camera contains a E2V 20482048 back illuminated chip with 0304 pixels corresponding to a 10.410.4 arcmin2 field of view. Individual exposures of 300 s were obtained in the and filters. On the night of July 15, right after the scientific target, we observed two standard star fields at similar airmass, containing eight standard stars used for the photometry calibration. Weather conditions were clear/photometric with seeing of 11–13.
The data were reduced automatically using a dedicated PyRAF script that includes a standard bias and flat-field corrections procedure. We carried out aperture photometry with the phot task within the iraf environment. Photometric calibration of the instrumental magnitudes in each filter was obtained using eight standard stars (Landolt, 1992, 2009) from the two observed fields. The uncertainty of the calibration is 0.04 mag. The measured magnitudes of the primary and other photometric data of the primary and the companion are listed in Table 2.
3.6. WHT/ACAM and LIRIS Imaging
To complement the photometric information at different wavelengths, we also acquired optical images of the pair using the Sloan and broad-band filters. The final -band image was also employed to constrain the trigonometric parallax (Section 4.2.2). Observations were done using the ACAM camera at the 4.2-m William Herschel Telescope (WHT) on 2014 July 17. ACAM uses a 2k2k pixels EEV CCD detector with 0.25 arcsec pix-1 scale, providing a circular field of view with a 8.3 arcmin2 diameter. We used a nine-point dither pattern with individual exposures of 30 s. On the same observing run on July 18 we have obtained -band observations using the Long-slit Intermediate Resolution Infrared Spectrograph (LIRIS) spectrograph and imager on the WHT, for an additional astrometry epoch of the binary used to constrain the parallax measurement. LIRIS uses a 1k1k HAWAII detector with a pixel scale of 0.25 arcsec pix-1, yielding a field of view of 4.274.27 arcmin2. We used a sequence of five dither patterns of 9 positions and 2 s individual exposures, giving a total exposure time of 90 s. Weather conditions were clear during the observations, with average seeing of 085 on the first and 066–068 on the second night.
We carried out the data reduction of the LIRIS images with the LIRIS data reduction package777www.ing.iac.es/Astronomy/instruments/liris/liris_ql.html. The procedure consisted of subtracting the sky made from the dithered images, correction for flat field, vertical gradient observed on the detector and the geometrical distortion. ACAM images were reduced with standard procedures using iraf. Master sky flat frames were obtained from science images by combining by the median the individual exposures of the dither sequence. Corrected images were aligned and average combined. The aperture photometry of the companion was obtained using the phot task within iraf. To calibrate the instrumental magnitudes we measured the photometry of stars in a field observed after VHS 1256-1257, under similar weather and airmass conditions. We selected 10 point sources with a good signal-to-noise ratio and available measurement in the SDSS Photometric Catalog (Ahn et al., 2012). The obtained i and z magnitudes are listed in Table 2. The primary was saturated in the individual exposures.

3.7. WISE Data
The Wide-field Infrared Survey Explorer (WISE; Wright et al., 2010) conducted a survey of the entire sky in the 3.4, 4.6, 12 and 22 m mid-infrared bandpasses (hereafter , , and ). The WISE All-Sky Source Catalog (see explanatory supplement document by Cutri et al. http://wise2.ipac.caltech.edu/docs/release/allsky/expsup/ includes the photometry of VHS 1256-1257 in the four bands, but does not detect VHS 1256-1257 b. The AllWISE Source Catalog contains the deblended photometry of both the primary in the four bands and the secondary in the W1 and W2, but the later is contaminated by a diffraction spike of the bright star as indicated in the confusion flag. In order to obtain the correct values, we performed aperture photometry of VHS 1256-1257 b using daophot routine in the W1 and W2-band images after PSF subtraction of the primary using the scaled PSF of nearby stars in the field as references. A small aperture of 5 pixels was used and instrumental magnitudes was transformed into apparent magnitudes using the photometry of VHS 1256-1257. The AllWISE Source Catalog photometry of the primary and the derived photometry of the secondary are given in Table 2.
4. Physical properties of the system
4.1. Spectral Types and Spectral Characteristics
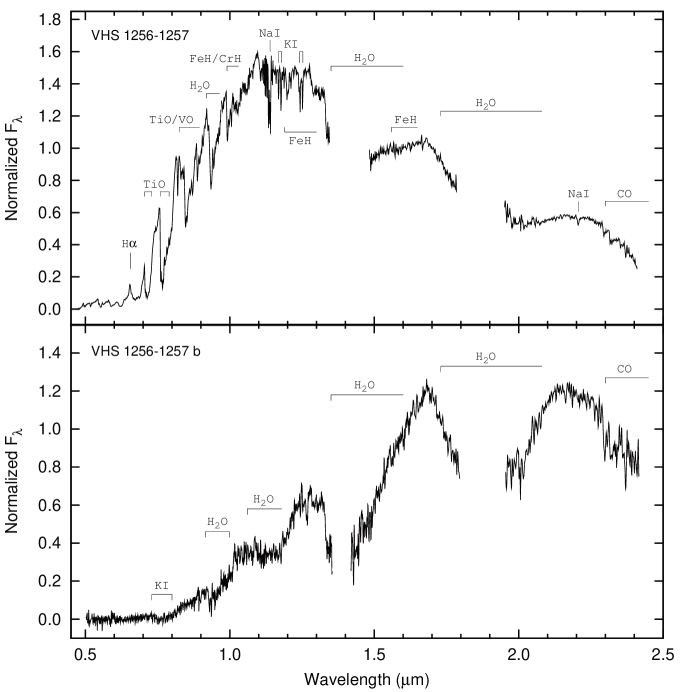
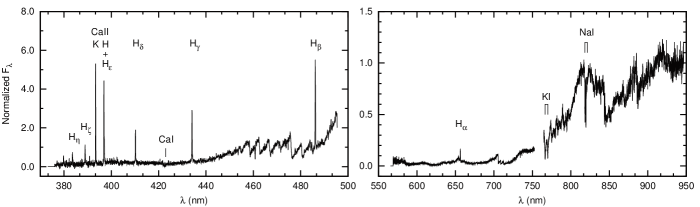
In Figure 3 we plot the merged low-resolution optical (0.5–1.0 m) and near-IR (1.0–2.4 m) spectra of each of the two components of VHS 1256-1257. The spectral energy distribution of the primary (top panel) corresponds to that of mid-/late-M dwarfs, with the highest flux in the band, broad water vapor absorption bands cutting out the continuum between and regions and numerous hydride, oxide (FeH, TiO, VO, CO), and alkali line (Na i, K i) absorption features. Also, a H emission line at 656 nm is detected. The overall appearance of the companion spectra (bottom panel) appears to resemble an L-type object, but it is significantly redder than field L dwarfs. Unlike a typical L dwarf, its flux peaks at the band, which has a triangular continuum shape, usually interpreted as a hallmark of low surface gravity and youth. In the following, we discuss in detail the spectral characteristics, determine the spectral types of the binary components, and analyze the gravity-sensitive features in the spectra.
4.1.1 The Primary
To determine the spectral types, we used our low-resolution optical and near-IR spectra. We classified the objects in a qualitative manner through visual comparison of the spectra with a set of field dwarf spectral templates, in the optical and near-IR separately. Subsequently, we used the spectral indices established by Allers & Liu (2013) to designate spectral types in a quantitative way, and estimate the gravity class. The final spectral types were then assigned by averaging the information from both approaches with their corresponding uncertainties.
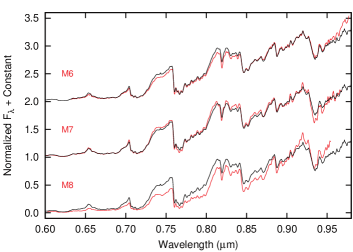
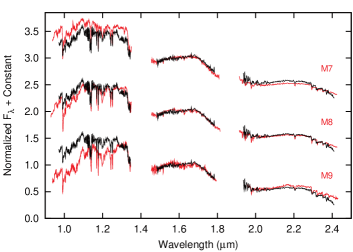
In Figure 4 we show the optical (left plot) and near-IR (right plot) spectra of the primary overplotted with the templates. In the optical, we compared our GTC/OSIRIS spectra normalized at 900 nm with a set of M dwarf spectral templates: Gl 406 (M6, Reid et al. 2008), vB 8 (M7, Kirkpatrick et al. 1997) and vB 10 (M8, Henry & Kirkpatrick 1990). In this wavelength range we find the best match with an M7-type dwarf, while a noticeably poorer fit to templates with one subtype difference. Thus, in the optical we assign a spectral type of M7 0.5. In an analogous manner, we compared the near-IR NTT/SofI spectra normalized at 1.6 m with M-dwarf spectral templates available in the IRTF Spectral Library888http://irtfweb.ifa.hawaii.edu/~spex/IRTF_Spectral_Library/ maintained by Michael Cushing (Rayner et al., 2009). On the right-hand side panel of Figure 4 we include a comparison of the primary spectra with vB 8 (M7, Cushing et al. 2005; Rayner et al. 2009), LP 412-31 (M8, Rayner et al. 2009) all smoothed to match resolution of 600 and the M9 standard LHS 2065 (Kirkpatrick et al., 1991) which we observed using SofI with the same configuration as for VHS 1256-1257. We found the best consistency with the M8 standard. Both M7- and M9-type standards provided significantly worse matches, especially in the band. We adopt a near-IR spectral type of M, one subtype later than the one designated from the optical.
| Line | Date (UT) | (nm) | pEW (Å) |
| Hη | 2014 Jul 01 | 383.5 | |
| Hζ | 2014 Jul 01 | 388.9 | |
| Ca ii K | 2014 Jul 01 | 393.4 | |
| Ca ii H+Hϵ | 2014 Jul 01 | 396.8 + 397.0 | |
| Hδ | 2014 Jul 01 | 410.2 | |
| Hγ | 2014 Jul 01 | 434.1 | |
| Hβ | 2014 Jul 01 | 486.1 | |
| Hα | 2014 Apr 22 | 656.3 | |
| Hα | 2014 May 04 | 656.3 | |
| Hα | 2014 Jul 01 | 656.3 | |
| Hα | 2014 Jul 09 | 656.3 | |
| Hα | 2014 Jul 10 | 656.3 | |
| Li i | 2014 Jul 01 | 670.8 | |
| K i doublet | 2014 Jul 01 | 766.5 / 769.9 | 9.350.17 / 5.940.16 |
| Na i doublet | 2014 Jul 01 | 818.3 / 819.8 | 1.800.06 / 2.880.06 |
| Na i | 2014 Mar 12 | 1139 | |
| K i doublet | 2014 Mar 12 | 1169 / 1177 | 3.00.6 / 4.20.7 |
| K i doublet | 2014 Mar 12 | 1244 / 1253 | 4.00.7 / 3.40.6 |
As mentioned above, in parallel to visual comparison of the overall spectral morphology with the standards, we calculated the spectral indices defined by Allers & Liu (2013). We used the H2O, H2OD, H2O-1, and H2O-2 indexes, optimized to avoid spectral features dependent on the surface gravity of the object and to have a well-established correlation with optical spectral types. The H2O index, which measures the slope of the steam absorption at the blue end of the band (1.50–1.57 m), yields a spectral type of M. From H2O-1 and H2O-2 indexes we obtained spectral types of M and M, respectively. Both from the comparison with templates and from the calculated indices, we found the typing to be consistent within the uncertainties. As the final spectral type we adopt an M, obtained as the mean of all the types inferred from visual comparison and from spectral indexes, weighted by their corresponding uncertainties.
To find out if the primary has characteristics of low surface gravity, we inspect the gravity-sensitive spectral features like the Na i and K i lines. In Fig. 5 we present a comparison of K i and Na i doublets in the optical at around 770 and 819 nm, respectively (top panels of the figure), and in the near-IR in a region of the band (bottom panel). In the optical, we plot in black the UVES spectrum of the primary VHS 1256-1257, in red the standard M7 dwarf vB 8 (using UVES spectra retrieved from the ESO Archive) and in blue the M8 member of the Pleiades, Teide 1 (Rebolo et al., 1996). In the near-IR, our NTT/SofI spectrum of VHS 1256-1257 (black line) is overplotted with the field dwarfs vB 8 (M7), LEHPM 2-436 (M8) observed by us with the same instrumental configuration, and with an M8 at 5–10 Myr, 2M 1207 A from Bonnefoy et al. (2014). The spectra were smoothed to match the resolution of VHS 1256-1256 data and, in the optical, convolved with a Gaussian function to adjust the FWHMs of the lines.
We find these absorption features of the primary to be slightly less intense than in the field counterparts, for example, the Na i lines at 818.3 and 819.8 nm have pEW of and Å, respectively. In comparison, from the vB 8 spectra we measure pEW of and Å. The same lines in the 120 Myr old M8-type counterpart Teide 1 are in turn less intense with pEW of and Å. Because the Na i subordinate lines are well known to be highly sensitive to atmospheric pressure at cool temperatures, this indicates that the primary likely has an intermediate surface gravity that lies between that of Pleiades and field M8-type dwarfs. We note, however, that all these comparisons are based on the assigned spectral types and assume that both targets and reference sources have the same metallicity. Furthermore, the intensity of the alkali lines also depend on the effective temperature (or spectral type). Given a half-subtype uncertainty in our typing of VHS 1256-1257 A, we found that the surface gravity of this object may be consistent with field objects considering an earlier type.
In Table 3 we provide the pEW of Na i, K i, and other lines measured in the optical and near-IR spectra of the primary. In order to quantify the gravity class we have calculated four spectral indices: FeHz, VOz, K iJ, and -continuum, identified to be related to gravity-dependent features and optimized to be employed with low-resolution near-IR spectra (Allers & Liu 2013 and references therein). Based on these indicators we considered field gravity (FLD-G), intermediate gravity (INT-G), or very low gravity (VL-G) of an object following the classification scheme of Allers & Liu (2013). For FeHz, which measures the depth of the FeH feature at 0.99 m, we obtained a value of . For the VOz index we assign a score of “n” since it is not gravity sensitive in this range of spectral types. For the K iJ index, which measures the depth of potassium absorption at 1.244 and 1.253 m, we got a value of and for the -cont index, which measures the slope of the band we got . For an M7.5 spectral type these index values correspond to a surface gravity intermediate between that of counterparts classified as very low gravity and of the old, field population.
4.1.2 The Secondary
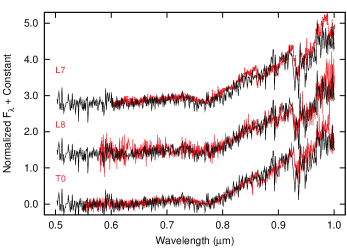
Our GTC/OSIRIS optical spectrum of the companion (left plot of Fig. 6) is of modest signal-to-noise ratio, and apart from the general spectral energy distribution only few spectral features are noticeable, like the strong K i resonance doublet and water vapor at 0.92 m. The lack of oxide features (TiO, VO) at the resolution of the visible spectrum suggest a type later than mid-L. On the left panel of Fig. 6 we show the spectra of the companion (black line) normalized at 0.9 m and overplotted with objects of spectral types L7 (2MASS J21522609+0937575, Reid et al. 2008), L8 (2MASS J03400942-6724051, Reid et al. 2008) and T0 (2MASS J04234858-0414035, Cruz et al. 2003). The template spectra were retrieved from the Ultracool RIZzo Spectral Library. Comparison with templates of field dwarfs yields a spectral type of L2.
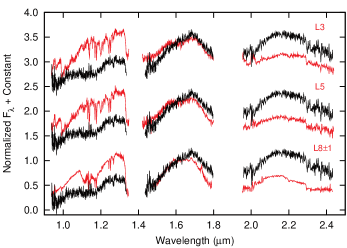
From the comparison of the NTT/SofI near-IR spectrum of the companion VHS 1256-1257 b to L-type objects with well-determined spectral types, we find that the overall 1.0–2.4 m spectral energy distribution does not match any early to late high-gravity field L dwarf. In the right-hand side plot of Fig. 6 we show a comparison of the companion near-IR spectra normalized at 1.6 m (black line) with an L3-type object DENIS-P J1058.7-1548 (Burgasser et al., 2010), L5 SDSS J053951.99-005902.0 (Cushing et al., 2005) and L WISE 1049-5319 A (Luhman, 2013). The spectra of these L dwarf templates were obtained by us using SofI instrument with the same configuration as for VHS 1256–1257 and were reduced in the same way. In the band, VHS 1256–1257 b is relatively less luminous than normal field L dwarfs and contrarily is significantly brighter in the band. Its -band continuum unlike the field L dwarfs has a distinctive triangular shape, interpreted as a signature of low surface gravity and youth. To measure the near-IR spectral type, we tried to find best matching field dwarf standards from the IRTF library, at the (1.07–1.40 m) and (1.90–2.20 m) windows separately, following the approach of Allers & Liu (2013). In this wavelength regions the shape of spectra continuum is expected to have a lower dependence on gravity. We estimate, in the and bands, respectively, a spectral type of L and L. In the band we assign an uncertainty of two subtypes because several standards provide similarly good fits.
Along with visual comparison, we calculated the H2OD index, well defined up to the range of late-L dwarfs. The other indexes are not valid for spectral types later than L5. The H2OD index value give a spectral type of L. In analogous manner as for the primary, from a mean of the types inferred through visual comparison and from the H2OD spectral index, weighted by the corresponding errors, we obtained an L7.0 type, which we adopt here as the spectral type of the companion, with an uncertainty of 1.5 subtype. Among the gravity-sensitive spectral indices, only the -continuum index is well defined up to L7 type objects. For VHS 1256-1257 b -cont indicates a very low gravity (VL-G). However, as noted by Allers & Liu (2013), the shape of the -band continuum is not the most reliable indicator, and can provide rather only a hint of low gravity. It should be used in combination with other gravity-sensitive indices, but for the spectral type in question none of them have yet been defined. The K i lines at 1.17 m (pEW 5 Å) and at 1.25 m (pEW 3 Å) appear weaker in the spectrum of the secondary than in the field mid- and late-L dwarfs (see Fig. 6). For example, in the spectrum of the L8 dwarf WISE 1049-5319 A obtained with the same instrument and setup we measured a pEW of the K i lines of 5.70.8 and 6.80.7 Å at 1.169 and 1.177 m and 3.40.4 and 6.10.4 Å at 1.244 and 1.253 m, respectively. This also indicates that the secondary has a lower gravity compared to field counterparts (2004ApJ...600.1020M).
| Epoch | JD-2400000 | Tel/Instrument | Filter | Pixel | Seeing | Primary | Secondary | ||||
|---|---|---|---|---|---|---|---|---|---|---|---|
| (UT) | (mas) | (′′) | (′′) | () | R.A. (mas) | Decl. (mas) | R.A. (mas) | Decl. (mas) | |||
| 1999 Mar 1aafootnotemark: | 51238.7109 | 2MASS | 999 | 3.1 | 7.350.21 | 217.11.5 | 3217103 | 2305153 | 3868115 | 2830178 | |
| 2011 Jul 1bbfootnotemark: | 55743.5676 | VISTA/VIRCAM | 339 | 1.0 | 8.060.03 | 218.10.2 | 0 | 0 | 0 | 0 | |
| 2014 Mar 13ccfootnotemark: | 56729.7276 | NTT/SofI | 288 | 0.8 | … | … | 633.924.8 | 604.927.6 | 660.322.2 | 566.830.6 | |
| 2014 Apr 27 | 56774.7212 | NTT/SofI | 288 | 1.3 | 8.080.03 | 218.00.2 | 727.36.6 | 590.66.0 | 722.217.6 | 621.911.5 | |
| 2014 Apr 27 | 56774.7224 | NTT/SofI | 288 | 1.0 | 8.050.03 | 217.90.2 | 756.025.3 | 607.821.0 | 728.725.3 | 610.221.0 | |
| 2014 Jul 15ddfootnotemark: | 56854.4126 | IAC80/CAMELOT | 304 | 1.1 | … | … | 871.526.7 | 645.425.2 | … | … | |
| 2014 Jul 15ddfootnotemark: | 56854.4139 | IAC80/CAMELOT | 304 | 1.1 | … | … | 834.314.9 | 682.311.6 | … | … | |
| 2014 Jul 17eefootnotemark: | 56856.3903 | WHT/ACAM | 254 | 0.9 | … | … | … | … | 833.017.5 | 647.217.5 | |
| 2014 Jul 18 | 56857.3642 | WHT/LIRIS | 250 | 0.7 | 8.060.04 | 218.00.3 | 855.116.8 | 578.615.5 | 842.616.7 | 583.615.5 | |
| 2014 Dec 19ddfootnotemark: | 57010.7372 | IAC80/CAMELOT | 304 | 1.5 | … | … | 835.328.0 | 738.831.0 | … | … | |
| 2014 Dec 19ddfootnotemark: | 57010.7447 | IAC80/CAMELOT | 304 | 1.5 | … | … | 799.830.0 | 762.232.4 | … | … | |
| 2014 Dec 20ddfootnotemark: | 57011.7568 | IAC80/CAMELOT | 304 | 1.2 | … | … | 825.835.7 | 744.138.8 | … | … | |
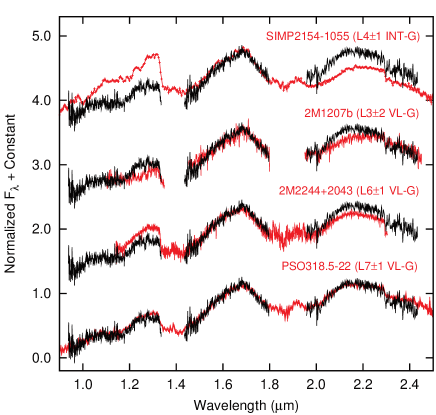
In addition to the comparison with field L-type templates, we have also compared the near-IR spectra of VHS 1256-1257 b with a set of known young low-gravity mid- and late-L dwarfs. In Figure 7 we overplot the companion spectra with SIMP J2154-1055, classified as an L with intermediate surface gravity (Gagné et al., 2014), a 5 planetary mass companion 2MASS 1207-3932 b at 8 Myr (Chauvin et al., 2005; Patience et al., 2010), 2MASS J22443167+2043433 classified as very low-gravity L type (McLean et al., 2003) and with the free-floating planetary mass object PSO J318.5-22 (Liu et al., 2013). In general, the spectrum of the companion fits much better to the spectra of young, very low-gravity L dwarfs than to the spectra of field objects. We find the best match with PSO J318.5-22 which is classified as an L, thus providing a further support of our spectral type classification. PSO J318.5-22 is a 6.5 object, possible member of the 12 Myr moving group Pictoris. Because of this strong resemblance, we state that the companion can be assigned to the very low-gravity (VL-G) class.
4.2. Distance Estimates
4.2.1 Spectrophotometric Distance
Having classified the spectral type of the primary, we used the photometry to estimate the distance of the system. We used the 2MASS catalog photometry, since at these magnitudes the VHS measurements start to get beyond the linear regime of the detector and could be uncertain. We employed the mean absolute magnitudes as a function of spectral type determined by Dupuy & Liu (2012) from a set including 8 M7.0, 9 M7.5, and 11 M8.0 type dwarfs with precise parallactic distance determination. Considering an M type of the primary, and assuming that it is a single object, we inferred spectroscopic distances of 12.0, 12.4 and 12.2 pc, using , , and photometry, respectively. Taking the average of three bands, we estimate a distance of 12.2 pc. The quoted errors account for uncertainties of the photometry, spectral type, and the intrinsic dispersion in absolute magnitudes for field dwarfs at a given spectral type.
In this case however, the estimation that employs the M dwarfs found in the field should be considered with caution, since the field objects have ages typically of more than 1 Gyr, and for VHS 1256-1257 we expect an age below 300 Myr (see Section 4.5). From the studies of young star clusters, it is known that the M dwarfs younger than 400–625 Myr can be overluminous with respect to their field counterparts (Bihain et al., 2006; Jameson et al., 2008; Zapatero Osorio et al., 2014c). For that reason we obtained an alternative estimation using near-IR photometry of M7–M8 dwarf members of the Pleiades cluster, compiled by Bihain et al. (2010). The Pleiades has an age of Myr (Basri et al., 1996; Martín et al., 1998; Stauffer et al., 1998) and is located at a distance of 133.5 pc (Soderblom et al., 2005; Melis et al., 2014). Averaging the estimates obtained in , , and yields a distance of 14.9 pc for VHS 1256-1257 if this binary had the age of the Pleiades.
4.2.2 Trigonometric Parallax
To derive the trigonometric parallax and proper motion of the pair we used an area of around the target and the images listed in Table 4, except for the 2MASS. We took advantage of the availability of these images for a first determination of a trigonometric distance to the system. In Table 4 we provide the observing epoch (including the Julian Date), telescope, and imaging instrument, filter, the average pixel projection onto the sky, and the mean seeing of the images. All data were properly reduced following standard steps for the optical and near-IR wavelengths as explained in Section 3. We selected the VISTA/VIRCAM -band observations of 2011 July as the fundamental frame to which all other images are compared. Using the daofind command within iraf we identified all sources with photon peaks with detection above 6 , where stands for the noise of the background, and FWHM resembles that of unresolved objects (i.e., extended sources were mostly avoided). In addition, we ensured that the detected sources lied within the linear regime of the detectors response (with the only exception of the primary component of the binary). The number of sources identified per image in common with the reference frame ranged from 25 to 40. The centroids of detected objects were computed by estimating the and pixel positions of the best fitting one-dimensional Gaussian functions in each axis; typical associated errors are about 3%–5% of a pixel or better.
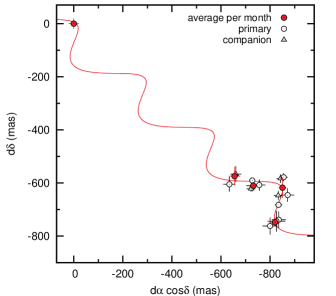
Pixel coordinates were transformed between different epochs using the geomap routine within iraf, which applied a polynomial of the third and fourth order in and and computed linear terms and distortions terms separately. The linear term included an and shift and an and scale factor, a rotation, and a skew. The distortion surface term consisted of a polynomial fit to the residuals of the linear term. The astrometric transformation between observing epochs and the reference epoch was an iterative step, which included the rejection of objects deviating by more than 1.5–2 , where corresponds to the dispersion of the transformation. Typical coordinates transformation dispersions ranged from 0.05 to 0.09 pixels; this is typically 15–25 mas. The centroids of the two components were calculated with an uncertainty similar to that of the astrometric reference sources. Errors associated with the astrometry are dominated by the errors in the coordinate transformations for each axis (R.A., decl.), which include the dispersion of all reference sources. We therefore assigned the dispersion of the coordinates transformation solutions to the errors associated with the differential astrometry of our targets listed in Table 4. We did not apply any correction for differential chromatic refraction since all of our data were taken at red wavelengths, where the corrections are smaller than the quoted astrometric uncertainty. The relative astrometry (conveniently derotated) was converted into d cos and d using the corresponding plate scales. The apparent trajectory of each component, which depends on proper motion (, ) and parallax (), is shown in Figure 8 and can be modeled with the following equations:
| (1) |
| (2) |
where stands for time, the subscript indicates the reference epoch, and and refer to the parallax factors in right ascension () and declination (), respectively. In our study, all the astrometric quantities are given in mas and the times and are measured in Julian Days. The parallax factors were computed by following the equations given in Green (1985) and obtaining the Earth barycenter from the DE405 Ephemeris999http://ssd.jpl.nasa.gov. We applied the least-squares fitting method to the set of Equations 1 and 2 to derive the parallax and the proper motion of the system. The two components were fit simultaneously. The best-fit solution yielded = mas yr-1, = mas yr-1 giving a total proper motion of = mas yr-1, position angle of the proper motion vector of , and a relative parallax = 77.79 6.4 mas. It is depicted with a solid curve in Figure 8. The amplitude and position angle of the proper motion we determined is in agreement with the measurement given by Deacon & Hambly (2007). From the fitting performed for each pair member individually we obtained proper motion of = mas yr-1, = mas yr-1 for the primary and = mas yr-1, = mas yr-1 for the companion. The above values are listed in Table 2. We have also tested the WISE, 2MASS, and available earlier epoch data (DENIS, USNO-B1.0, DSS) in the proper motion and parallax determination, but despite the longer baseline they introduced larger errors to the fitted values. Hence, for the determination of the parallax and proper motion we excluded these data, given that their associated uncertainties are at least one order of magnitude higher than those of the recent data. We remark that given the time coverage of our data, which span 3.0447 yr, the proper motion is more precisely determined than the parallax. Additional images, in particular taken on months that were not covered yet, are required for decreasing the uncertainty in the parallax measurement.
We did not correct our proper motion for the motions of the stars used as a reference because we assumed that these (small) motions are randomly orientated with a negligible net effect. However, we did apply the correction for converting the relative parallax into the absolute parallax. This takes into account that the reference stars are located at finite distances, which diminish part of the true parallax of our targets. We followed a procedure similar to the one described in Faherty et al. (2012) and Zapatero Osorio et al. (2014a). Using the 2MASS colors (Skrutskie et al., 2006) of the reference objects, we obtained their photometric distances by assuming that all of them are main sequence stars. We adopted the color–bolometric correction–spectral type relations given in Johnson (1966) for BAFGK stars and in Kirkpatrick et al. (1993) for late-K and M stars. The defined relations are valid for colors in the interval = 0.2 to 1.53 mag. We adopted the mode of the distribution of reference objects distances as the correction to be added to the relative parallax that comes directly from our fit to obtain the absolute parallax. The absolute parallax is = 78.79 6.4 mas, which translates into a distance of pc, consistent with the value from the spectrophotometric estimates using field counterparts. This suggests that the primary component is not an equal-mass binary.
4.3. Angular Separations and Orbital Motion
On the available images where both components were detected and the primary did not saturate we measured the projected angular separation () and position angle () of the companion using the centroid positions of the two sources in each of the images transformed into the VHS , coordinates as explained above. The determined values are given in Table 4. The angular separations and position angles of VHS 1256-1257 in the most recent epoch images over the last three years are consistent within mas and deg, respectively. Both components share the same proper motion, and given the low probability to find a very red young L dwarf (only a few tens found in the whole sky area) at this very short angular separation of 806, we conclude that both objects are gravitationally related. These results also indicate that we do not detect an orbital motion higher than 10 mas yr-1 (at the 1 level).
We expect an orbital period of about 3900 yr from the estimated masses of the primary and companion (Section 4.7) and a physical projected separation of 102 AU. Assuming a circular orbit, this implies that the displacement caused by orbital motion would be of 4–13 mas yr-1 depending on the orientation of the orbit, which is consistent with our results. The angular separation of the pair in the 2MASS images is lower, although consistent within 3. These differences (06 02) can not be explained by the orbital motion of the companion, since we expect no more than 13 mas yr-1 for a face-on circular orbit at the physical separation found, and may be attributed to systematic errors in the determination of the centroids in the 2MASS data probably due to small separation of the components and low resolution of the images.
4.4. Kinematics
To measure the heliocentric radial velocity of VHS 1256-1257 we employed the high spectral resolution UVES data (mean Modified Julian Date, MJD = 56838.3530) and the cross-correlation method against the M6V star GJ 406, which has a known, constant radial velocity of = 19.5 0.1 km s-1 (Nidever et al., 2002) and a small projected rotational velocity of sin 3 km s-1 (Reiners & Basri, 2010). GJ 406 was also observed with the VLT/UVES instrument (spectral resolution of 45,000) on 2009 March 14 (MJD = 54904.0839). We downloaded the reduced UVES spectrum of GJ 406 from the ESO data archive (program 082.D-0953). Although GJ 406 was observed with a non-standard instrumental setup in terms of wavelength coverage (see Fuhrmeister et al., 2011), the overlap between the M6V-type star and VHS 1256-1257 data is significant and secures a reliable velocity determination. The telluric contribution was removed from the data of GJ 406 in the same manner as we did for VHS 1256-1257 (see Section 3.4).
The telluric-free UVES spectra of VHS 1256-1257 and GJ 406 were cross-correlated using the task fxcor within iraf. We fit a Gaussian function to the peak of the cross-correlation distribution. The resulting relative displacement was corrected for the lunar, diurnal, and annual velocities to obtain the heliocentric radial velocity of VHS 1256-1257. All UVES spectra were calibrated in wavelength using ThAr arc lines taken some time after the science observations (Section 3.4). The typical stability of UVES along the spectral axis is on the order of a pixel over the course of a night; therefore, deviations of a km s-1 can be expected. To correct our velocity determination for this effect, we employed the absorption lines from the Earth’s atmosphere present in the data, which provide a reliable reference frame within 90 m s-1 (e.g., Griffin & Griffin, 1973). We used the UVES spectra of VHS 1256-1257 and GJ 406 before subtraction of the sharp telluric lines to determine the instrumental shifts of the wavelength solution for each object. We found them to be 0.62 0.20 km s-1 (VHS 1256-1257) and 0.14 0.20 km s-1 (VHS 1256-1257 versus GJ 406). The final corrected heliocentric radial velocity of VHS 1256-1257 is = 1.4 5.0 km s-1, where the error bar accounts for the uncertainties due to the cross-correlation procedure, the corrections of the wavelength reference frames, and the error associated with the velocity of the M6V standard star.
We checked this heliocentric velocity using the line centroid method, which is independent of any reference star. By measuring the centroids of alkali and other metallic lines in the three UVES spectra of VHS 1256-1257 and considering the correction for the wavelength reference frame and lunar, diurnal, and annual velocities as previously discussed, we found = 4.1 4.0 km s-1. Albeit having a much lower spectral resolution, the NOT/ALFOSC spectra of VHS 1256-1257 also yielded radial velocities that agree with the UVES result at the 1 level (where stands for the velocity uncertainty): = 0.1 7.0 km s-1 (MJD = 56769.0443) and 14.1 10.0 km s-1 (MJD = 56781.9229). The ALFOSC velocities were derived using the cross-correlation technique; the M4.5V star GJ 388 ( = 12.6215 km s-1, Bonfils et al. (2013); = 12.453 km s-1, Chubak et al. 2012) acted as the velocity reference source because its spectra were acquired with exactly the same instrumental configuration and observing dates as our target (Section 3.3). GJ 388 was found to be a radial velocity variable star by Bonfils et al. (2013). However, the amplitude of the variations is 0.25 km s-1, which is about 30 times smaller than the velocity precision we were able to achieve with the ALFOSC data. No obvious velocity change larger than 10 km s-1 is observed in VHS 1256-1257 over the 69 day interval of spectroscopic observations.

Having the measurements of proper motion, parallax, and radial velocity we can determine the three components of the Galactic space velocity, U, V, and W. We applied the formulas presented by Johnson & Soderblom (1987) to derive the UVW velocities listed in Table 2 and displayed in Figure 9. The uncertainties associated to all three Galactic velocities come from the proper motion, parallax, and radial velocity error bars. Figure 9 also illustrates the ellipsoids corresponding to well-known young stellar moving groups of the solar neighborhood (data compiled from Zuckerman & Song 2004 and Torres et al. 2008).
As seen in Figure 9, the space velocities of VHS 1256-1257 fits with the Pic Group and is consistent within error bars with the galactic velocities of Taurus-Auriga, TW Hya, and the Local Association groups. The stars in Pic, Taurus-Auriga, and TW Hya are younger than 20 Myr, and this age is incompatible with the non-detection of lithium in the atmosphere of the primary (see next section). Hence the kinematic and spectroscopic properties of VHS 1256-1257 is only compatible with the membership to the Local Association Group, a coherent kinematic stream of young stars (all below 300 Myr, Eggen 1992) with constituent clusters and associations such as the Pleiades (120 Myr), Persei (50–80 Myr), and IC 2602 (70 Myr). Membership in stellar moving groups is commonly used to constrain or confirm the ages especially of young ( Gyr) objects. We discuss in more detail the age of VHS 1256-1257 system in the following section.
4.5. Activity, Lithium and Age
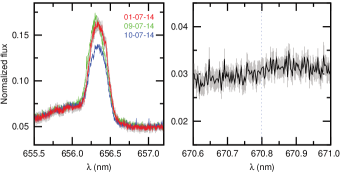
The high-resolution optical spectra of the primary (Fig. 10, 11) reveals emission features recognized as indicators of chromospheric activity in very low-mass stars. We detect the Balmer series emission lines of hydrogen, from Hα up to Hη, and single ionized calcium Ca ii H and K emission lines at 396.8 and 393.4 nm. Measurements of the lines pEW are given in Table 3. The pEW of Hα does not show a strong variability in timescales of days and months, but show small variations of the order of 1–2 Å along the observations, as can be seen in Fig. 11 and Table 3. These activity indicators of the primary are consistent with dwarfs of similar spectral types in the field and in intermediate age clusters like the Hyades (Reid & Hawley, 1999; West et al., 2011), and are less active than those of younger open clusters like Pleiades (Stauffer et al., 1998).
In the VLT/UVES spectrum of VHS 1256-1257, we did not detect the Li i resonance doublet at 670.8 nm, imposing an upper limit of 30 mÅ in the pEW of this atomic line (see the right panel of Fig. 11). This is much lower than the expected value for a full preservation of this element in the atmosphere of late-M dwarfs of EW = 0.5–1 Å (Stauffer et al., 1998; Zapatero Osorio et al., 2002). The Li element is rapidly destroyed in the interior of stars, on timescales shorter than 150 Myr, and in massive brown dwarfs on timescales of a few Gyr. Brown dwarfs with masses lower than 0.055–0.060 do not burn this element in their interiors because their central temperature is not high enough to produce this fusion reaction (Ushomirsky et al., 1998; Chabrier et al., 2000b). The non-detection of Li in VHS 1256-1257 impose a lower limit in the mass of the primary of 0.055–0.060 and also imposes a lower limit to the age of the system, since objects of similar spectral type in the Pleiades cluster (age 120 Myr) have fully preserved this element (Stauffer et al., 1998). Theoretical evolutionary models (Chabrier & Baraffe, 1997; Chabrier et al., 2000b) predict that objects with effective temperature 2600 K (which is the corresponding effective temperature of an M7.5) have preserved their Li content in timescales of less than 150 Myr, but have destroyed it for several orders of magnitude at ages larger than 200 Myr.
The gravity-dependent spectral features of the primary like Na and K alkaline lines are also consistent with intermediate gravities between those of the Pleiades and field dwarfs (Gorlova et al., 2003; Allers & Liu, 2013; Bonnefoy et al., 2014; Gálvez-Ortiz et al., 2014) On the other hand, the secondary shows spectral features, which are signposts of low gravity and youth like the sharp triangular shape of the band. Some authors attribute these features to objects with ages younger than 150 Myr (Cruz et al., 2009; Faherty et al., 2013a), which is in contradiction with the lower limit to the age of VHS 1256-1257, given by the non-detection of Li in the primary. Other authors suggest a more conservative range of ages up to 120–500 Myr (Zapatero Osorio et al., 2014a), which are in good agreement with the age constrain for this system.
The proper motion, radial velocity, and parallactic distance of the primary allow us to determine its galactic kinematic. The galactic velocities UVW of the VHS 1256-1257 indicate that the system probably belongs to the Local Association, whose members have estimated ages of 10–300 Myr (Asiain et al., 1999). In conclusion, based on the absence of lithium in the primary and the likely membership to the Local Association, we adopt a range of 150–300 M yr for the age of the VHS 1256-1257 system.
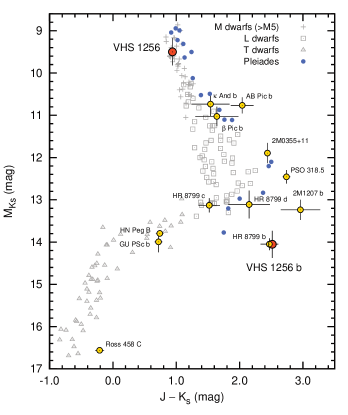
4.6. Versus Color-Magnitude Diagrams
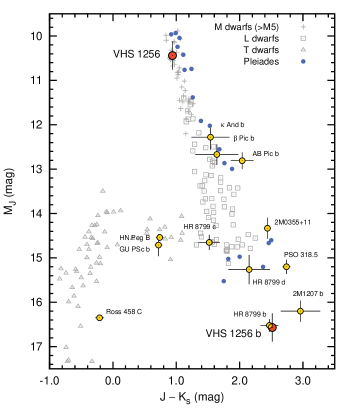
Average near-IR color of L7 dwarfs is (Faherty et al., 2013b). With = 2.47 0.03 mag, VHS 1256-1257 b is among the reddest known L dwarfs, next to 2M1207 b and PSO J318.5-22. These extreme colors are thought to originate from enhanced photospheric dust and broad-band changes in the spectral energy distribution induced by the low gravity of young objects. In Figure 12 we compare the absolute and magnitudes versus colors of VHS 1256-1257 with field mid–late-M, L and T dwarfs with measured parallaxes compiled by Dupuy & Liu (2012) and with several known substellar objects and giant planet companions. Based on parallactic distance we derived an absolute magnitude of the companion , which is about 2.2 mag fainter than the late-L field counterparts. In the band it is roughly one magnitude below the LT sequence. The location of VHS 1256-1257 b on the and versus color magnitude diagrams coincides with the young planetary mass companion 2M 1207 b and is almost the same as the 5–11 planet HR 8799 b.
4.7. Luminosity, Mass, and Effective Temperature
To derive the bolometric luminosities of the primary and the companion, we used the near-IR photometry and the parallactic distance. For the primary, which does not deviate strongly from the field sequence, we have obtained the bolometric magnitude applying the corresponding BCJ and BCK bolometric corrections determined for field objects, from Golimowski et al. (2004) and Dahn et al. (2002). These BCs combined with absolute magnitudes and mag for the Sun yield the luminosity of dex. The error accounts for the uncertainties in distance, photometry, and bolometric correction. Since the near-IR photometry of the companion differs significantly from the “normal” field L dwarfs, the bolometric corrections determined for field ultracool dwarfs are not valid (Luhman, 2012; Faherty et al., 2012; Zapatero Osorio et al., 2014a). We applied bolometric corrections (, 2MASS system) derived from the measurements of PSO J318.5-22 (Liu et al., 2013), which shows a strong similarity to VHS 1256-1257 b. Taking the mean value from the three bands, we obtained dex.
We used the calculated bolometric luminosities to infer the range of possible masses, effective temperatures, and gravities () from the evolutionary models, adopting an age of the system of 150–300 Myr. We have used the Lyon group models BT-Settl (Baraffe et al., 1998, 2003; Chabrier et al., 2000b) with the Caffau et al. (2011) solar abundances and the ‘hot start’ cloudy atmosphere evolutionary tracks of Saumon & Marley (2008), with sedimentation parameter = 2. Both models give consistent values of the derived parameters (masses, , ) within their corresponding uncertainties. For the primary, we obtained a mass of 73 , close to the boundary between stars and brown dwarfs regime which starts at masses below for solar metallicities. The effective temperature and found from the models are K and dex, respectively. This is consistent with typical temperatures of field M dwarfs being in the 2500–2600 K range (Leggett et al., 2000; Golimowski et al., 2004). The derived gravity is slightly lower but similar to the expected gravity for field dwarfs of similar spectral types ( = 5.0–5.5). This is consistent with what we have found spectroscopically.
For the companion, we obtained a mass of 11.2 , indicating that the object is near the mass limit at which the onset of deuterium fusion occurs. Given the uncertainty in the mass determination, it is currently unclear whether the object is above or below it. The effective temperature and of the companion obtained from the evolutionary models are 880 K and 4.24 dex. A typical effective temperature of field L6–L8 dwarf is between 1600 and 1300 K (Leggett et al., 2000; Golimowski et al., 2004; Vrba et al., 2004). The effective temperature of the companion indicated by the models is about 500 K lower than that and corresponds rather to a field mid-T dwarf. A similar discrepancy between temperatures predicted by evolutionary models and those estimated from spectral classification has been found in other young substellar objects: PSO J318.5-22 (Liu et al., 2013), 2MASS 0122-2439 B (Bowler et al., 2013), HN Peg B (Luhman et al., 2007), 2MASS 1207 b (Skemer et al., 2011; Barman et al., 2011b). Moreover, at this temperature level of 900 K we would already expect to see the methane absorption bands in the near-IR spectra of the companion. The absence of methane was observed in other similar objects, like for example the HR 8799 planets. On the contrary, if the actual temperature is higher, like that corresponding to “normal” field L6–L8 dwarfs, this would lead to unrealistically small radius of the object ( 0.5 ), given its bolometric luminosity.
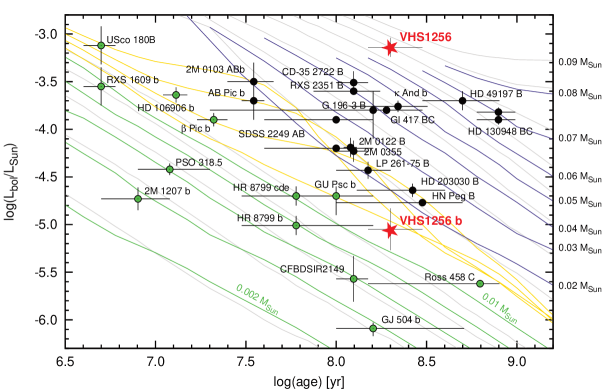
We compare in Figure 13 the luminosity of the companion at the adopted range of ages with the Saumon & Marley (2008) and BT-Settl models (Allard & Barman, 2004) and with presently known young substellar objects, compiled by Bowler et al. (2013) updated with recently reported young T-dwarf companion GU PSc b (Naud et al., 2014) and a planetary mass companion HD 106906 b (Bailey et al., 2014). Interpretation of evolutionary tracks in this specific region has to be considered with caution. At that range of ages and luminosities the onset of deuterium burning causes overlapping of isomass tracks and less massive object can be slightly more luminous than a more massive one. This may introduce ambiguities in the determination of masses and produce a relatively large uncertainty in the upper limit of the derived mass of the companion. This object for its location in the HR diagram and its close distance is an ideal case for the application of the deuterium test (Béjar et al., 1999; Chabrier et al., 2000a).
5. Summary and final remarks
We have identified an unusually red ( = 2.47 mag) common proper motion L type companion located at 806 003 ( AU) of an M7.5 0.5 dwarf. The near-IR spectrum of the secondary shows a peaked triangular shape of the -band continuum, and other spectral features recognized as hallmarks of low surface gravity and youth. The optical spectrum of the primary shows no Li i at 670.82 nm at a limit of pEW 30 mÅ. We have determined a parallactic distance of the system of 12.7 1.0 pc, which is in agreement with the distance estimated from spectral type and photometry of the primary. From the proper motion, distance, and radial velocity of the VHS 1256-1257 we obtained the galactic velocities of the primary, which indicate that the system likely belongs to the Local Association. The non-detection of lithium and the kinematics of the primary allowed us to constrain the age of the system in the range of 150–300 Myr. From near-IR photometry and bolometric corrections we estimate luminosities of of and dex for the primary and secondary, respectively. By comparison with theoretical evolutionary models we derived a mass of 73 for the primary, at around the substellar mass limit and 11.2 for the secondary, near the deuterium-burning mass limit. At the distance of 12.7 pc VHS 1256-1257 b is among the nearest currently known planetary mass companions detected by direct imaging. Moreover, it is one of the very few young, extremely red L dwarfs with age constrained within a narrow range, given by the likely belonging to the Local Association and the absence of Li i in the primary.
The of 900 K determined from evolutionary models based on the luminosity does not seem to be consistent with the expected range of field dwarfs of similar spectral type and with the absence of methane, which is expected to appear in atmosphere cooler than 1400 K. Following Barman et al. (2011a, b) the formation of clouds with substantial vertical thickness and non-equilibrium chemistry in a low-gravity object like VHS 1256-1257 b could provide an explanation of the apparent high atmospheric temperature (1500 K) as compared to cooling track effective temperature predictions (900–1000 K). As atmospheric clouds are composed mostly of Fe and Mg-Si grains, we argue that the infall of planetesimals into this, and other young planetary mass objects, may enrich their atmospheres with key ingredients for substantial cloud formation. As time progresses, the amount of infalling material will decrease, the surface gravity of the planet will increase, and therefore the formation of thick clouds will become less important. As a consequence, the majority of field mid L dwarfs will not display the extreme IR colors found in these young objects. An alternative hypothesis to aid the explanation of the very red colors involves presence of a warm debris disk or a dust-shell surrounding the object and causing the extinction.
Since it is a relatively nearby and bright object near the deuterium-burning limit, it becomes one of the most promising targets to study the application of the deuterium test. From the masses and separation of the components we estimate the orbital period to be about 3900 yr. Assuming a circular orbit with a face-on orientation, the displacement caused by the orbital motion would be from 4 to 13 mas/yr, which will become feasible to measure in the next few years using precise astrometric observations.
References
- Ahn et al. (2012) Ahn, C. P., Alexandroff, R., Allende Prieto, C., et al. 2012, ApJS, 203, 21
- Allard & Barman (2004) Allard, F., & Barman, T. S. 2004, in IAU Symposium, Vol. 213, Bioastronomy 2002: Life Among the Stars, ed. R. Norris & F. Stootman, 119
- Allers & Liu (2013) Allers, K. N., & Liu, M. C. 2013, ApJ, 772, 79
- Asiain et al. (1999) Asiain, R., Figueras, F., Torra, J., & Chen, B. 1999, A&A, 344, 376
- Bailey et al. (2014) Bailey, V., Meshkat, T., Reiter, M., et al. 2014, ApJL, 780, L4
- Baraffe et al. (1998) Baraffe, I., Chabrier, G., Allard, F., & Hauschildt, P. H. 1998, A&A, 337, 403
- Baraffe et al. (2003) Baraffe, I., Chabrier, G., Barman, T. S., Allard, F., & Hauschildt, P. H. 2003, A&A, 402, 701
- Barman et al. (2011a) Barman, T. S., Macintosh, B., Konopacky, Q. M., & Marois, C. 2011a, ApJ, 733, 65
- Barman et al. (2011b) —. 2011b, ApJL, 735, L39
- Basri et al. (1996) Basri, G., Marcy, G. W., & Graham, J. R. 1996, ApJ, 458, 600
- Béjar et al. (1999) Béjar, V. J. S., Osorio, M. R. Z., & Rebolo, R. 1999, ApJ, 521, 671
- Béjar et al. (2011) Béjar, V. J. S., Zapatero Osorio, M. R., Rebolo, R., et al. 2011, ApJ, 743, 64
- Bihain et al. (2006) Bihain, G., Rebolo, R., Béjar, V. J. S., et al. 2006, A&A, 458, 805
- Bihain et al. (2010) Bihain, G., Rebolo, R., Zapatero Osorio, M. R., Béjar, V. J. S., & Caballero, J. A. 2010, A&A, 519, A93
- Bonfils et al. (2013) Bonfils, X., Delfosse, X., Udry, S., et al. 2013, A&A, 549, A109
- Bonnefoy et al. (2014) Bonnefoy, M., Chauvin, G., Lagrange, A.-M., et al. 2014, A&A, 562, A127
- Bowler et al. (2013) Bowler, B. P., Liu, M. C., Shkolnik, E. L., & Dupuy, T. J. 2013, ApJ, 774, 55
- Burgasser et al. (2010) Burgasser, A. J., Cruz, K. L., Cushing, M., et al. 2010, ApJ, 710, 1142
- Caffau et al. (2011) Caffau, E., Ludwig, H.-G., Steffen, M., Freytag, B., & Bonifacio, P. 2011, SoPh, 268, 255
- Cepa (2010) Cepa, J. 2010, in Highlights of Spanish Astrophysics V, ed. J. M. Diego, L. J. Goicoechea, J. I. González-Serrano, & J. Gorgas, 15
- Chabrier & Baraffe (1997) Chabrier, G., & Baraffe, I. 1997, A&A, 327, 1039
- Chabrier et al. (2000a) Chabrier, G., Baraffe, I., Allard, F., & Hauschildt, P. 2000a, ApJL, 542, L119
- Chabrier et al. (2000b) —. 2000b, ApJ, 542, 464
- Chauvin et al. (2005) Chauvin, G., Lagrange, A.-M., Dumas, C., et al. 2005, A&A, 438, L25
- Chauvin et al. (2014) Chauvin, G., Vigan, A., Bonnefoy, M., et al. 2014, ArXiv e-prints, arXiv:1405.1560
- Chubak et al. (2012) Chubak, C., Marcy, G., Fischer, D. A., et al. 2012, ArXiv e-prints, arXiv:1207.6212
- Cross et al. (2009) Cross, N. J. G., Collins, R. S., Hambly, N. C., et al. 2009, MNRAS, 399, 1730
- Cruz et al. (2009) Cruz, K. L., Kirkpatrick, J. D., & Burgasser, A. J. 2009, AJ, 137, 3345
- Cruz et al. (2003) Cruz, K. L., Reid, I. N., Liebert, J., Kirkpatrick, J. D., & Lowrance, P. J. 2003, AJ, 126, 2421
- Cruz et al. (2007) Cruz, K. L., Reid, I. N., Kirkpatrick, J. D., et al. 2007, AJ, 133, 439
- Cushing et al. (2005) Cushing, M. C., Rayner, J. T., & Vacca, W. D. 2005, ApJ, 623, 1115
- Dahn et al. (2002) Dahn, C. C., Harris, H. C., Vrba, F. J., et al. 2002, AJ, 124, 1170
- Dalton et al. (2006) Dalton, G. B., Caldwell, M., Ward, A. K., et al. 2006, in Society of Photo-Optical Instrumentation Engineers (SPIE) Conference Series, Vol. 6269, Society of Photo-Optical Instrumentation Engineers (SPIE) Conference Series
- Deacon & Hambly (2007) Deacon, N. R., & Hambly, N. C. 2007, A&A, 468, 163
- Deacon et al. (2014) Deacon, N. R., Liu, M. C., Magnier, E. A., et al. 2014, ApJ, 792, 119
- Dupuy & Liu (2012) Dupuy, T. J., & Liu, M. C. 2012, ApJS, 201, 19
- Eggen (1992) Eggen, O. J. 1992, AJ, 104, 2141
- Emerson (2001) Emerson, J. P. 2001, in Astronomical Society of the Pacific Conference Series, Vol. 232, The New Era of Wide Field Astronomy, ed. R. Clowes, A. Adamson, & G. Bromage, 339
- Emerson et al. (2004) Emerson, J. P., Sutherland, W. J., McPherson, A. M., et al. 2004, The Messenger, 117, 27
- Faherty et al. (2009) Faherty, J. K., Burgasser, A. J., Cruz, K. L., et al. 2009, AJ, 137, 1
- Faherty et al. (2010) Faherty, J. K., Burgasser, A. J., West, A. A., et al. 2010, AJ, 139, 176
- Faherty et al. (2013a) Faherty, J. K., Cruz, K. L., Rice, E. L., & Riedel, A. 2013a, MmSAI, 84, 955
- Faherty et al. (2014) Faherty, J. K., Cruz, K. L., Rice, E. L., & Riedel, A. 2014, in IAU Symposium, Vol. 299, IAU Symposium, ed. M. Booth, B. C. Matthews, & J. R. Graham, 36–37
- Faherty et al. (2013b) Faherty, J. K., Rice, E. L., Cruz, K. L., Mamajek, E. E., & Núñez, A. 2013b, AJ, 145, 2
- Faherty et al. (2012) Faherty, J. K., Burgasser, A. J., Walter, F. M., et al. 2012, ApJ, 752, 56
- Freudling et al. (2013) Freudling, W., Romaniello, M., Bramich, D. M., et al. 2013, A&A, 559, A96
- Fuhrmeister et al. (2011) Fuhrmeister, B., Lalitha, S., Poppenhaeger, K., et al. 2011, A&A, 534, A133
- Gagné et al. (2014) Gagné, J., Lafrenière, D., Doyon, R., et al. 2014, ApJL, 792, L17
- Gálvez-Ortiz et al. (2014) Gálvez-Ortiz, M. C., Kuznetsov, M., & et al. 2014, MNRAS, 439, 3890
- Golimowski et al. (2004) Golimowski, D. A., Leggett, S. K., Marley, M. S., et al. 2004, AJ, 127, 3516
- Gorlova et al. (2003) Gorlova, N. I., Meyer, M. R., Rieke, G. H., & Liebert, J. 2003, ApJ, 593, 1074
- Green (1985) Green, R. M. 1985, Spherical astronomy
- Griffin & Griffin (1973) Griffin, R., & Griffin, R. 1973, MNRAS, 162, 255
- Henry & Kirkpatrick (1990) Henry, T. J., & Kirkpatrick, J. D. 1990, ApJL, 354, L29
- Høg et al. (1998) Høg, E., Kuzmin, A., Bastian, U., et al. 1998, A&A, 335, L65
- Høg et al. (2000) Høg, E., Fabricius, C., Makarov, V. V., et al. 2000, A&A, 355, L27
- Irwin et al. (2004) Irwin, M. J., Lewis, J., Hodgkin, S., et al. 2004, in Society of Photo-Optical Instrumentation Engineers (SPIE) Conference Series, Vol. 5493, Optimizing Scientific Return for Astronomy through Information Technologies, ed. P. J. Quinn & A. Bridger, 411–422
- Jameson et al. (2008) Jameson, R. F., Lodieu, N., Casewell, S. L., Bannister, N. P., & Dobbie, P. D. 2008, MNRAS, 385, 1771
- Johnson & Soderblom (1987) Johnson, D. R. H., & Soderblom, D. R. 1987, AJ, 93, 864
- Johnson (1966) Johnson, H. L. 1966, ARA&A, 4, 193
- Kausch et al. (2015) Kausch, W., Noll, S., Smette, A., et al. 2015, A&A, 576, A78
- Kirkpatrick et al. (2006) Kirkpatrick, J. D., Barman, T. S., Burgasser, A. J., et al. 2006, ApJ, 639, 1120
- Kirkpatrick et al. (1997) Kirkpatrick, J. D., Beichman, C. A., & Skrutskie, M. F. 1997, ApJ, 476, 311
- Kirkpatrick et al. (1991) Kirkpatrick, J. D., Henry, T. J., & McCarthy, Jr., D. W. 1991, ApJS, 77, 417
- Kirkpatrick et al. (1993) Kirkpatrick, J. D., Kelly, D. M., Rieke, G. H., et al. 1993, ApJ, 402, 643
- Knapp et al. (2004) Knapp, G. R., Leggett, S. K., Fan, X., et al. 2004, AJ, 127, 3553
- Kuzuhara et al. (2013) Kuzuhara, M., Tamura, M., Kudo, T., et al. 2013, ApJ, 774, 11
- Lagrange et al. (2009) Lagrange, A.-M., Gratadour, D., Chauvin, G., et al. 2009, A&A, 493, L21
- Landolt (1992) Landolt, A. U. 1992, AJ, 104, 340
- Landolt (2009) —. 2009, AJ, 137, 4186
- Leggett et al. (2000) Leggett, S. K., Allard, F., Dahn, C., et al. 2000, ApJ, 535, 965
- Lewis et al. (2010) Lewis, J. R., Irwin, M., & Bunclark, P. 2010, in Astronomical Society of the Pacific Conference Series, Vol. 434, Astronomical Data Analysis Software and Systems XIX, ed. Y. Mizumoto, K.-I. Morita, & M. Ohishi, 91
- Liu et al. (2013) Liu, M. C., Magnier, E. A., Deacon, N. R., et al. 2013, ApJL, 777, L20
- Luhman (2012) Luhman, K. L. 2012, ARA&A, 50, 65
- Luhman (2013) —. 2013, ApJL, 767, L1
- Luhman et al. (2007) Luhman, K. L., Patten, B. M., & et al. 2007, ApJ, 654, 570
- Marois et al. (2008) Marois, C., Macintosh, B., Barman, T., et al. 2008, Science, 322, 1348
- Marois et al. (2010) Marois, C., Zuckerman, B., Konopacky, Q. M., Macintosh, B., & Barman, T. 2010, Nature, 468, 1080
- Martín et al. (1998) Martín, E. L., Basri, G., Gallegos, J. E., et al. 1998, ApJL, 499, L61
- McLean et al. (2003) McLean, I. S., McGovern, M. R., Burgasser, A. J., et al. 2003, ApJ, 596, 561
- McMahon et al. (2013) McMahon, R. G., Banerji, M., Gonzalez, E., et al. 2013, The Messenger, 154, 35
- Melis et al. (2014) Melis, C., Reid, M. J., Mioduszewski, A. J., Stauffer, J. R., & Bower, G. C. 2014, Science, 345, 1029
- Naud et al. (2014) Naud, M.-E., Artigau, É., Malo, L., et al. 2014, ApJ, 787, 5
- Nidever et al. (2002) Nidever, D. L., Marcy, G. W., Butler, R. P., Fischer, D. A., & Vogt, S. S. 2002, ApJS, 141, 503
- Pancino et al. (2012) Pancino, E., Altavilla, G., Marinoni, S., et al. 2012, MNRAS, 426, 1767
- Patience et al. (2010) Patience, J., King, R. R., de Rosa, R. J., & Marois, C. 2010, A&A, 517, A76
- Peña Ramírez et al. (2012) Peña Ramírez, K., Béjar, V. J. S., Zapatero Osorio, M. R., Petr-Gotzens, M. G., & Martín, E. L. 2012, ApJ, 754, 30
- Pinfield et al. (2006) Pinfield, D. J., Jones, H. R. A., Lucas, P. W., et al. 2006, MNRAS, 368, 1281
- Rayner et al. (2009) Rayner, J. T., Cushing, M. C., & Vacca, W. D. 2009, ApJS, 185, 289
- Rebolo et al. (1996) Rebolo, R., Martin, E. L., Basri, G., Marcy, G. W., & Zapatero-Osorio, M. R. 1996, ApJL, 469, L53
- Reid et al. (2008) Reid, I. N., Cruz, K. L., Kirkpatrick, J. D., et al. 2008, AJ, 136, 1290
- Reid & Hawley (1999) Reid, I. N., & Hawley, S. L. 1999, AJ, 117, 343
- Reiners & Basri (2010) Reiners, A., & Basri, G. 2010, ApJ, 710, 924
- Saumon & Marley (2008) Saumon, D., & Marley, M. S. 2008, ApJ, 689, 1327
- Skemer et al. (2011) Skemer, A. J., Close, L. M., Szűcs, L., et al. 2011, ApJ, 732, 107
- Skrutskie et al. (2006) Skrutskie, M. F., Cutri, R. M., Stiening, R., et al. 2006, AJ, 131, 1163
- Smette et al. (2015) Smette, A., Sana, H., Noll, S., et al. 2015, A&A, 576, A77
- Soderblom et al. (2005) Soderblom, D. R., Nelan, E., Benedict, G. F., et al. 2005, AJ, 129, 1616
- Stauffer et al. (1998) Stauffer, J. R., Schultz, G., & Kirkpatrick, J. D. 1998, ApJL, 499, L199
- Torres et al. (2008) Torres, C. A. O., Quast, G. R., Melo, C. H. F., & Sterzik, M. F. 2008, Young Nearby Loose Associations, ed. B. Reipurth, 757
- Ushomirsky et al. (1998) Ushomirsky, G., Matzner, C. D., Brown, E. F., et al. 1998, ApJ, 497, 253
- van Leeuwen (2007) van Leeuwen, F. 2007, A&A, 474, 653
- Vrba et al. (2004) Vrba, F. J., Henden, A. A., Luginbuhl, C. B., et al. 2004, AJ, 127, 2948
- Wahhaj et al. (2011) Wahhaj, Z., Liu, M. C., Biller, B. A., et al. 2011, ApJ, 729, 139
- West et al. (2011) West, A. A., Morgan, D. P., & et al. 2011, AJ, 141, 97
- Wright et al. (2010) Wright, E. L., Eisenhardt, P. R. M., & et al. 2010, AJ, 140, 1868
- Zapatero Osorio et al. (2014a) Zapatero Osorio, M. R., Béjar, V. J. S., Miles-Páez, P. A., et al. 2014a, A&A, 568, A6
- Zapatero Osorio et al. (2002) Zapatero Osorio, M. R., Béjar, V. J. S., Pavlenko, Y., et al. 2002, A&A, 384, 937
- Zapatero Osorio et al. (2014b) Zapatero Osorio, M. R., Gálvez Ortiz, M. C., Bihain, G., et al. 2014b, A&A, 568, A77
- Zapatero Osorio et al. (2014c) Zapatero Osorio, M. R., Béjar, V. J. S., Martín, E. L., et al. 2014c, ArXiv e-prints, arXiv:1410.2383
- Zuckerman & Song (2004) Zuckerman, B., & Song, I. 2004, ARA&A, 42, 685