2015 Vol. X No. XX, 000–000
22institutetext: School of Mathematics and Physics, Qingdao University of Science and Technology, SongLing Road 99, Qingdao 266061, China 33institutetext: School of Mathematics and Physics, Changzhou University, GeHu Road 1, Changzhou 213164, China \vs\no
Star formation properties of galaxy cluster A1767
Abstract
Abell 1767 is a dynamically relaxed, cD cluster of galaxies with a redshift of 0.0703. Among 250 spectroscopically confirmed member galaxies within a projected radius of , 243 galaxies () are spectroscopically covered by the Sloan Digital Sky Survey (SDSS). Based on this homogeneous spectral sample, the stellar evolutionary synthesis code, STARLIGHT, is applied to investigate the stellar populations and star formation histories (SFHs) of cluster galaxies. The star formation properties of galaxies, such as mean stellar ages, metallicities, stellar masses, and star formation rates (SFRs), are presented as the functions of local galaxy density. Strong environmental effect is found in the manner that massive galaxies in the high-density core region of cluster tend to have higher metallicities, longer mean stellar ages, and lower specific star formation rates (SSFRs), and their recent star formation activities have been remarkably suppressed. In addition, the correlations of the metallicity and SSFR with stellar mass are confirmed.
keywords:
galaxies: clusters: individual (A1767) — galaxies: star formation, stellar mass — methods: data analysis1 Introduction
Clusters of galaxies, which are the largest gravitationally bound systems in the universe, have long been recognized as entities that can provide vital clues to large-scale structure formation. Nowadays, the evolution of galaxies in dense environment has become an important research field in extragalactic astrophysics. The star formation properties of cluster galaxies and their correlations with galaxy morphology, environment and some other physical quantities contribute to our understanding of galaxy formation and evolution (Kennicutt 1998; Brinchmann et al. 2004; Kauffmann et al. 2004). The star formation histories (SFHs) of member galaxies may shed some light on the evolution of their host cluster. As a dynamical tracer of luminous matter in galaxy clusters, member galaxies provide wealthy information in their high-resolution spectra for analyzing dynamical structures of clusters, the SFHs and chemical content of the galaxies.
In recent years, with its enormous amount of homogeneous spectroscopic and photometric data, the Sloan Digital Sky Survey (SDSS, York et al. 2000; Stoughton et al. 2002; Abazajian et al. 2003, 2004) has provided more samples of galaxies for studying the star formation activities of the galaxies in different gravitational environments (Kauffmann et al. 2004; Brinchmann et al. 2004; Asari et al. 2007; Deng et al. 2013; Ricciardelli et al. 2014).
Star formation rate (SFR) is an important physical parameter indicating the intensity of star formation activities in galaxies. The phenomena of HII regions, OB associations and starbursts are all significant indicators of current star formation within galaxies. The galaxy SFH refers to how the SFR evolves with cosmic time. And the mixing-ratio of various stellar populations can, to a certain extent, reflect the SFHs of galaxies. Certainly, there exist many factors that are closely related to galaxy SFR, for example, the physical properties of individual galaxies (e.g., luminosity, mass, gas content, morphological type, etc) (Kennicutt 1998; Kauffmann et al. 2004), and environmental influence (e.g., tidal forces, gas stripping, strangulation, strong galaxy interactions and mergers, etc) (Dressler 1980; Rasmussen et al. 2012; Ideue et al. 2013). On the whole, at present late-type galaxies are usually forming stars more actively than early-type galaxies, SFR in cluster galaxies is lower than in their field counterparts, and low-mass galaxies are undergoing more violent star formation activities than those massive galaxies (Kennicutt 1998; Kauffmann et al. 2004; Hernán-Caballero et al. 2013; Wagner et al. 2014). Following the standard hierarchical clustering scenario of cosmological large-scale structure, galaxy clusters formed through successively accreting of surrounding field galaxies. Once field galaxies access dense regions (e.g. galaxy clusters), their star formation activities would be gradually suppressed due to manifold physical mechanisms (Balogh et al. 2002; Koopmann & Kenney 2004). Additionally, there are clues that star formation activity is also suppressed in some high-redshift clusters of galaxies (Cid Fernandes et al. 2005).
The nearby (, Oegerle & Hill 2001) Abell cluster, A1767, located at 13h36m00s.3, +59∘12′43′′ (J2000.0), is a cD galaxy cluster with the BM-type II and richness (Abell et al. 1989). The predominant galaxy is the central cD galaxy, MCG+10-19-096 (Hill & Oegerle 1998). Using the spectroscopic data of 58 member galaxies, Hill & Oegerle (1998) derived the mean heliocentric velocity of , and the velocity dispersion of . They also pointed out noticeable lacks of emission-line galaxies in A1767, compared with other clusters. Furthermore, the I-statistics showed that the velocity distribution of A1767 is Gaussian (Oegerle & Hill 2001), and there is no statistically significant substructure as indicated by the -test in Dressler & Shectman (1988), showing that A1767 is a nearly dynamically relaxed galaxy cluster (Hill & Oegerle 1998; Wojtak & Łokas 2010). Analysis of spatial orientations of the galaxies in A1767 showed that the spin vectors of galaxies tend to lie in local supercluster plane and the projections of the spin vector tend to be oriented perpendicular with respect to the Virgo cluster centre (Aryal et al. 2007). Based on 147 spectroscopic data, Wojtak & Łokas (2010) derived the virial mass of galaxy cluster A1767 is , which is basically consistent with the weak lensing survey (Kubo et al. 2009) and the result of Popesso et al. (2007). They also judged that there is no cool core in A1767 on the basis on Hudson et al. (2010). Using the and photometry from the SDSS, Andreon (2010) found that stellar mass of A1767 within virial radii () is . Plionis et al. (2009) analyzed 159 X-ray data of A1767 and found the X-ray temperature and luminosity are 4.1 keV and erg s-1, respectively, in agreement with the X-ray temperature revealed by Lin et al. (2004) and the X-ray luminosity derived by Rudnick & Lemmerman (2009). Using the SDSS data within a projected radius of , Crawford et al. (2009) studied the luminosity function of A1767 in band, and found the characteristic magnitude is . Poggianti et al. (2006) analyzed 48 SDSS spectra within a projected radius of A1767, and derived that the fraction of the star-forming galaxies with a significant emission line OII at 3727 Å, a reliable signal of ongoing star formation, is about .
This paper aims to unveil the SFHs of the galaxies with various morphologies in A1767. The rest of this paper is organized as follows. The SDSS spectroscopic data of A1767 and the description of spectral fitting method, STARLIGHT, are presented in Section 2. In Section 3, we analyze the SDSS spectra for 243 member galaxies, and derive their star formation properties, such as SFRs, mean stellar ages, stellar metallicities, and their variations with local galaxy density as well as the stellar mass assembled in cluster galaxies. Finally, some conclusions are given in Section 4. Throughout this paper, We assume a flat cosmology with Mpc-1, , and .
2 Data and analysis
For investigating the star formation properties of cluster galaxies as a function of local density, a larger radius, 2.5, will be adopted in this paper, in order to cover a wider range of local galaxy density. is defined as where the mean interior density is 200 times the critical density, which can be derived from the cluster redshift () and velocity dispersion () (Carlberg et al. 1997):
We initially take and , given by Hill & Oegerle (1998), and achieve Mpc. Considering a scale of 1.342 kpc/arcsec for A1767, 579 normal galaxies with known spectroscopic redshifts () within a projected radius of 66.1 arcmin (i.e., ) are extracted from the NASA/IPAC Extragalactic Database (NED). The rest-frame velocity for each galaxy can be computed by . We take a standard iterative 3-clipping algorithm (Yahil & Vidal 1977) for selecting member galaxies, and apply the ROSTAT software (Beers et al. 1990) to calculate two resistant and robust estimators, namely the biweight location () and scale (), which are analogous to the mean value and the standard deviation. The biweight location () is taken for correcting the mean redshift of A1767, and scale () is adopted as velocity dispersion (). Then, we re-calculate the scale and virial radius , and find a smaller . Those galaxies with projected cluster-centric distance are excluded, and the iterative 3-clipping algorithm can be applied again for the updated sample of remaining member galaxies. This is an iterative process for achieving the final values of mean redshift (), velocity dispersion (), and virial radius () for A1767. As a result, we obtain a sample of 250 member galaxies with mean redshift of . The velocity dispersion is , and its corresponding dynamic radius is Mpc. These galaxies are distributed within a circular region of Mpc.
Among the 250 galaxies with , 243 () member galaxies are covered by the SDSS spectroscopy. The left panel of Fig. 1 shows the spatial distribution of member galaxies in A1767, and the 243 galaxies having SDSS spectra are denoted by circles. Although the selection effects of SDSS spectroscopic survey, to a certain extent, affect the completeness of the galaxy sample, this homogeneous spectral sample seems to have a completeness of 90% (Blanton et al. 2005). As we know, the SDSS main spectroscopic galaxy sample is complete within the magnitude range . For the member galaxies in A1767, their absolute magnitude are in the range , only 8 of 243 spectroscopic galaxies are beyond this scope. As for the fibre collision problem, which is due to the fact that fibres cannot be placed closer than 55′′, is responsible for the most incompleteness in the SDSS data. Strauss et al. (2002) estimated that affects 6 per cent of all target galaxies. Spectroscopic fibers have been assigned to objects on the sky using an efficient tiling algorithm designed to optimize completeness (Blanton et al. 2003). These SDSS member galaxies are scattered in whole cluster region, and they can be used to trace various density environments within A1767, which is suitable for statistical research on the variation of star formation property with local galaxy density. The right panel of Fig. 1 present distribution of the rest-frame velocities of cluster galaxies.


Simple stellar populations (SSPs) refer to the simultaneous generations of stars with same stellar metallicity for a specified initial mass function (IMF). Based on the SDSS photometric data and the star formation parameters derived by MPA/JHU group (Brinchmann et al. 2004; Kauffmann et al. 2004), Yuan et al. (2005) analyzed the star formation properties of 184 member galaxies of different morphological types in A2199. In this paper, we use the spectral synthesis code, STARLIGHT (Cid Fernandes et al. 2005), to decompose the observed galaxy spectra of A1767 in terms of a linear superposition of a series of SSPs of various ages and metallicities. The star formation and chemical histroies for cluster galaxies can be produced as output. It should be noted that the STARLIGHT only fits the regions of galaxy continuums and absorption lines, bad pixels and the windows of emission lines and the Na D doublet are masked and left out of the fits. The emission-line masks are constructed in a galaxy-by-galaxy basis. Following Asari et al. (2007), we can generally deduce the SFHs of galaxies on the basis of the output SSP series at different epochs. We make use of a base of 150 () SSPs extracted from the stellar population evolutionary synthesis models of Bruzual & Charlot (2003) for a Chabrier IMF (Chabrier 2003), spanning 25 ages (1 Myr 18Gyr) and 6 metallicities (). Each SSP with age and metallicity contributes a fraction of to model flux at a chosen normalization wavelength (), and its contribution can be equivalently expressed as a mass fraction vector . As STARLIGHT outputs, we obain mean stellar ages, mean metallicities, present-day stellar mass, as well as the full time-dependent star formation and chemical evolution histories. Therefore the current ( Myr) SFRs and specific SFRs can be derived for cluster galaxies. Besides, STARLIGHT outputs intrinsic extinction , velocity dispersion and some other parameters. The star formation parameters used for further statistical analysis in our work are all derived from the STARLIGHT outputs.
3 Statistical results
This work focuses on the variation of star formation properties (e.g., SFR, mean stellar age, stellar metallicity and stellar mass, etc) of member galaxies with local galaxy density. To characterize the density environment, we use the sample of 250 member galaxies to estimate local surface density (). Following Dressler (1980), we define by the nearest 10 neighboring galaxies centered on each member galaxy, , where is the projected distance to the 10th nearest neighbor. Thus, is not constrained by the cluster size, shape and other overall properties. Considering the completeness of SDSS spectroscopy, the derived values should be about 10 % smaller than intrinsic local galaxy densities.
The mean stellar age is an essential parameter characterizing the stellar population mixture of a galaxy. Compared with the light-weighted mean age, the mass-weighted mean age should be more intrinsic in terms of what that physically means. The same applies to the mean metallicity. As described in Cid Fernandes et al. (2005), the mass-weighted mean age and mean stellar metallicity can be derived by
where and denote age and metallicity of each SSP component, respectively.
Several criteria have been proposed to distinguish the early-type (red) galaxies based on the SDSS data, such as brightness fraction of de Vaucouleurs component (), color index (), and spectral features (such as continuum slope, Mg, Ca II H and K absorption lines, H emission, etc). It should be noted that the criterium probably fails for the spiral galaxies with prominent bulges, while the color cut probably misclassifies the star-forming galaxies with strong H emission. For achieving a reliable morphology classification, we inspected all images and spectra of these 243 member galaxies one by one, and balanced the values of fracDeV and . As a result, 159 member galaxies are classified as early-type galaxies, and 84 are classified as the late-types. For verifying the reliability of morphology, the color-magnitude relation for A1767 is shown in Fig. 2. A linear fit for the early-type galaxies is shown by a solid line. The dashed-dotted line corresponds to the SDSS spectroscopy completeness.

Fig. 3 presents the mass-weighted mean stellar ages and mean metallicities as functions of local galaxy density. The slope of our linear fitting and the Spearman correlation coefficient are also given in the plots. Fig. 3 reveals a significant increasing trend of mean ages with galaxy density, and the mean metallicities also appear a similar slight trend. It shows that the dense core region of A1767 is predominated by early-type galaxies, consistent with the morphology-density relation first pointed by Dressler (1980). Basically, early-type galaxies have older stellar ages than late-types. The SFHs of early-type galaxies show that they formed earlier, and there are no signs of star formation in the recent 1 Gyr, which leads to rather old age of the overall stellar population.


The right panel of Fig. 3 presents that the mean galaxy metallicities are weakly correlated with local density, which is mainly due to the dependence of metallicity upon stellar mass. Fig. 4 exhibits the correlation between the mean stellar metallicities and the stellar mass assembled in galaxies. It can be seen that the metallicities have a large scatter for low-mass galaxies, while the massive galaxies with are mainly early-type galaxies, and their metallicities correlate strongly with stellar masses. It means that more massive galaxies have higher metallicities, which can be interpreted in terms of a known mass-metallicity relation (e.g. Garnett & Shields 1987; Tremonti et al. 2004). It is noteworthy that most studies (e.g. Tremonti et al. 2004) measured the metallicity by means of the emission line luminosity, which represent the metallicity of interstellar medium (ISM). Nevertheless, the metallicity in this work is derived by accumulating the best-fitting SSP sequence, thus it represents the stellar metallicity. Considering that the ISM metals mainly originated from the feedback during the evolution of stars (such as galactic wind, supernova explosion, etc), and the stars successively formed certainly retain the metallicity of local ISM. It can be expected that chemical enrichment levels in stars and ISM scale with each other, and they should follow similar stellar mass-metallicity relation. If the mass fraction of stars in a galaxy remains stable, then this relation implies that the low-mass galaxies with shallow potential wells are difficult to prevent the heavy metals from being removed by the galactic winds (Tremonti et al. 2004), which leads to the decrease in metallicity. A certain dispersion is presented in the stellar mass-metallicity correlation, and the physical properties of galaxies (e.g. the galaxy morphology, color, inclination, the mass proportions of stars and gas within a galaxy, etc) and local density environment may be the causes of dispersion in such correlation. The metallicity dispersion is especially larger for low-mass galaxies, which may be due to the lower spectral signal-to-noise ratios (S/N) that leads to the more serious degeneracies among stellar age, extinction and metallicity.

Current SFR is commonly measured by the H luminosity, and also can be drived from the SFH produced by our stellar population synthesis analysis. The recent mean SFRs of galaxies, ( Myr), yields the best correlation with the H-derived SFR, where is the look-back time (Asari et al. 2007). Fig. 5 shows the relation between recent mean SFR and local surface density. We find that the star formation activities in massive galaxies have been seriously restrained in dense regions, and their recent SFRs are relatively low; while the low-mass galaxies in outer sparse regions still keep relatively active star formation.
To objectively characterize the intensity of star formation activities for galaxies with different masses, SFR is usually normalized on the total mass converted to stars over the galaxy history until , and the quantity () is called specific SFR (SSFR) (Asari et al. 2007), which measures the pace at which star formation proceeds with respect to the mass already converted into stars. Fig. 6 presents the SSFRs of member galaxies as a function of local surface density. As can be seen from the figure, the mean galaxy SSFR over the whole history of star formation decreases with increasing local surface density, indicating that the star formation activity should be constrained in high-density environments.


In addition, we can also derive what fraction of the total present-day stellar mass () was converted to stars during recent period ( Myr) by formula (Asari et al. 2007). As shown in Fig. 7, both the recent mean SSFRs and mass fraction of recently formed stars () are indicators of the intensity of recent star formation in galaxies, and they show similar trends with local surface density: the galaxies in low-density outer regions still maintain high degree of star formation over recent period. On the other hand, for the galaxies in cluster core region, their recent star formation activities are no more active, evidently affected by the environmental effects. According to the hierarchical scenario of cosmic large-scale structure, when the outer galaxies fall into the core region, the interaction between galaxy and intra-cluster medium (ICM) will be significantly enhanced, and the physical processes such as the tides, galaxy-galaxy interaction, harassment, strangulation, cannibalism, and dynamical friction (Poggianti 2004; Yuan et al. 2005) would stripe or take away the gas in galaxies, thus their star formation activities would be gradually reduced, until slowly quenched.

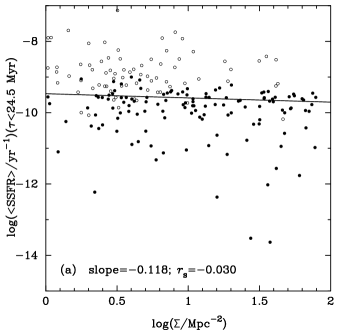
Fig. 8 presents the variation of galaxy ( Myr) with their stellar masses assembled. A strong correlation is clearly seen, although with some dispersion. Massive galaxies have smaller mean SSFRs in recent 24.5 Myr, which can be well explained in the context of hierarchical cosmological scenario (Poggianti 2004), implying that with increasing stellar mass, gases are gradually consumed and their mass proportions of recently-formed stars become even lower, which accounts for the decrease in recent SSFRs.
4 Conclusion
A1767 is a dynamically relaxed nearby galaxy cluster. Within a projected radius of Mpc, a sample of 250 spectroscopically confirmed member galaxies is selected. Our analysis of this sample shows that the mean cluster redshift is 0.0711, and velocity dispersion is . 243 galaxies are found to have SDSS spectra, which provide a homogeneous spectral sample for studying the stellar population and star formation histories for the cluster galaxies. The stellar population synthesis code, STARLIGHT, is applied to obtain the star formation properties for each galaxies. This work focuses on how the star formation properties of galaxies (e.g. mean stellar ages, metallicities, stellar masses, and recent specific SFR, etc) vary with local galaxy density. We find that the galaxies in dense core region of cluster tend to have older mean stellar ages, higher metallicities and lower SFRs, and their star formation activities are significantly restrained in recent 24.5 Myr. Besides, we also confirm the correlations of galaxy metallicities and SSFRs with stellar masses. Environmental effects on the star formation properties of the galaxies in A1767 are basically consistent with our previous studies on the spectral energy distributions for cluster galaxies, where we used different observation data and analysis methods for the nearby clusters at different dynamical status. Our cluster sample includes the dynamically complex clusters, namely A2255 (Yuan et al. 2005), A98 (Zhang et al. 2010), A119 (Tian et al. 2012), A671(Pan et al. 2012), and A2319 (Yan et al. 2014), and dynamically relaxed cluster, namely A2589 (Liu et al. 2011). Recently, we carried out a similar investigation based on the same spectral source and synthesis code for the merging cluster A85 (Yuan et al. 2014). Comparison between these works indicates that the statistical regularities seem to be weakly related to dynamical stages of cluster evolution, and might correlate strongly with stellar mass and local galaxy density.
Acknowledgements.
This work is funded by the National Natural Science Foundation of China (NSFC) (Nos. 11173016, 11433005) and by the Special Research Found for the Doctoral Program of Higher Education (grant No. 20133207110006). We would like to thank Prof. Xianzhong Zheng at Purple Mountain Observatory for valuable discussion. This research has made use of the NASA/IPAC Extragalactic Database (NED), which is operated by the Jet Propulsion Laboratory, California Institute of Technology, under contract with the National Aeronautics and Space Administration. We anknowledge the use of public data from SDSS DR9. The SDSS web site is http://www.sdss.org. Funding for the SDSS has been provided by the Alfred P. Sloan Foundation, the National Aeronautics and Space Administration, the National Science Foundation, the U.S. Department of Energy, and the Japanese Monbukagakusho, the Max-Planck Society.References
- Abell et al. (1989) Abell, G. O., Corwin, R. P., & Olowin, R. P. 1989, ApJS, 70, 1
- Abazajian et al. (2003) Abazajian, K., Adelman-McCarthy, J. K., Agüeros, M. A., et al. 2003, AJ, 126, 2081
- Abazajian et al. (2004) Abazajian, K., Adelman-McCarthy, J. K., Agüeros, M. A., et al. 2004, AJ, 128, 502
- Andreon (2010) Andreon, S. 2010, MNRAS, 407, 263
- Aryal et al. (2007) Aryal, B., Paudel, S., & Saurer, W. 2007, MNRAS, 379, 1011
- Asari et al. (2007) Asari, N. V., Cid Fernandes, R., Stasińska, G., et al. 2007, MNRAS, 381, 263
- Balogh et al. (2002) Balogh, M. L., Couch, W. J., Smail, I., et al. 2002, MNRAS, 335, 10
- Beers et al. (1990) Beers, T. C., Flynn, K., & Gebhardt, K. 1990, AJ, 100, 32
- Blanton et al. (2003) Blanton, M. R., Lin, H., Lupton, R. H.,et al. 2003, AJ, 125, 2276
- Blanton et al. (2005) Blanton, M. R., Schlegel, D. J., Strauss, M. A., et al. 2005, AJ, 129, 2562
- Brinchmann et al. (2004) Brinchmann, J., Charlot, S., Kauffmann, G., et al. 2004, MNRAS, 351, 1151
- Bruzual & Charlot (2003) Bruzual, G., Charlot, S. 2003, MNRAS, 344, 1000
- Carlberg et al. (1997) Carlberg, R. G., Yee, H. K. C., & Ellingson, E. 1997, ApJ, 478, 462
- Chabrier (2003) Chabrier, G. 2003, PASP, 115, 763
- Crawford et al. (2009) Crawford, S. M., Bershady, M. A., & Hoessel, J. G. 2009, ApJ, 690,1158
- Cid Fernandes et al. (2005) Cid Fernandes, R., Mateus, A., Sodré, L., et al. 2005, MNRAS, 358, 363
- Deng et al. (2013) Deng, X.-F., Luo, C.-H., Xing, Y., & Wu, P. 2013, RMxAA, 49, 181
- Dressler (1980) Dressler, A. 1980, ApJ, 236, 351
- Dressler & Shectman (1988) Dressler, A., & Shectman, S. 1988, AJ, 95, 985
- Garnett & Shields (1987) Garnett, D. R. & Shields, G. A. 1987, ApJ, 317, 82
- Hernán-Caballero et al. (2013) Hernán-Caballero, A., Alonso-Herrero, A., Pérez-González, P. G., et al. 2013, MNRAS, 434, 2136
- Hill & Oegerle (1998) Hill, J. M., & Oegerle, W. R. 1998, AJ, 116, 1529
- Hudson et al. (2010) Hudson, D. S., Mittal R., Reiprich T. H., et al. 2010, A&A, 513, 37
- Ideue et al. (2013) Ideue, Y., Taniguchi, Y., & Cosmos Team. 2013, ASPC, 477, 163
- Kauffmann et al. (2004) Kauffmann, G., Brinchmann, J., Charlot, S., et al. 2004, MNRAS, 353, 713
- Kennicutt (1998) Kennicutt, R. C. 1998, ARA&A, 36: 189
- Koopmann & Kenney (2004) Koopmann, R. A., Kenney, J. D. 2004, ApJ, 613, 866
- Kubo et al. (2009) Kubo, J. M., Annis, J., Hardin, F. M., et al. 2009, ApJ, 702, L110
- Lin et al. (2004) Lin, Y. T., Mohr, J. J., & Stanford, S. A. 2004, ApJ, 610, 745
- Liu et al. (2011) Liu, S.-F., Yuan, Q.-R., Yang, Y.-B., et al. 2011, AJ, 141, 99
- Oegerle & Hill (2001) Oegerle, W. R., & Hill, J. M. 2001, AJ, 122, 2858
- Pan et al. (2012) Pan, Z.-Z., Yuan, Q.-R., Kong, X., et al. 2012, MNRAS, 421, 36
- Popesso et al. (2007) Popesso, P., Biviano, A., Böhringer, H., & Romaniello, M. 2007, A&A, 461, 397
- Plionis et al. (2009) Plionis, M., Tovmassian, H. M., & Andernach, H. 2009, MNRAS, 395, 2
- Poggianti (2004) Poggianti, B. 2004, Proceedings of Baryons in Dark Matter Halos . Novigrad, Croatia, 5-9 Oct 2004. Editors: R. Dettmar, U. Klein, P. Salucci. Published by SISSA, Proceedings of Science, p.104.1
- Poggianti et al. (2006) Poggianti, B. M., von der Linden, A., De Lucia, G., et al. 2006, ApJ, 642, 188
- Rasmussen et al. (2012) Rasmussen, J., Mulchaey, J. S., Bai, L., et al. 2012, ApJ, 757, 122
- Ricciardelli et al. (2014) Ricciardelli, E., Cava, A., Varela, J., & Quilis, V. 2014, MNRAS, 445, 4045
- Rudnick & Lemmerman (2009) Rudnick, L., & Lemmerman, J. A. 2009, ApJ, 697, 1341
- Stoughton et al. (2002) Stoughton, C., Lupton, R. H., Bernardi, M., et al. 2002, AJ, 123, 485
- Strauss et al. (2002) Strauss M. A., Weinberg, D. H., Lupton, R. H., et al. 2002, AJ, 124, 1810
- Tian et al. (2012) Tian, J.-T., Yuan, Q.-R., Zhou, X., et al. 2012, RAA, 12, 1381
- Tremonti et al. (2004) Tremonti, C. A., Heckman, T. M., Kauffmann, G., et al. 2004, ApJ, 613, 898
- Wagner et al. (2014) Wagner, C. R., Brodwin, M., Snyder, G. F., et al. 2015, ApJ, 800, 107
- Wojtak & Łokas (2010) Wojtak, R., & Łokas, E. L. 2010, MNRAS, 408, 2442
- Yahil & Vidal (1977) Yahil, A., & Vidal, N. V. 1977, ApJ, 214, 347
- Yan et al. (2014) Yan, P.-F., Yuan, Q.-R., Zhang, L., & Zhou, X. 2014, AJ, 147, 106
- York et al. (2000) York, D. G., Adelman, J., Anderson, J. E., Jr., et al. 2000, AJ, 120, 1579
- Yuan et al. (2005) Yuan, Q.-R., Zhao, L.-F., Yang, Y.-B., et al. 2005, AJ, 130, 2559
- Yuan et al. (2014) Yuan, Q.-R., Zhao, Z.-Y., Jing, W., Xu, H.-J. 2014, ChA&A, 38, 117
- Zhang et al. (2010) Zhang, L.,Yuan, Q.-R., Zhou, X., et al. 2010, RAA, 10, 1