Feeding versus feedback in AGN from near-infrared Integral Field Spectroscopy X: NGC 5929
Abstract
We present near-infrared emission-line flux distributions, excitation and kinematics, as well as stellar kinematics, of the inner of the Seyfert 2 galaxy NGC 5929. The observations were performed with the Gemini’s Near-Infrared Integral Field Spectrograph (NIFS) at a spatial resolution of pc and spectral resolution of in the J- and Kl-bands. The flux distributions of H2, [Fe ii], [P ii], and H recombination lines are extended over most of the field of view, with the highest intensity levels observed along , and well correlated with the radio emission. The H2 and [Fe ii] line emission are originated in thermal processes, mainly due to heating of the gas by X-rays from the central Active Galactic Nucleus (AGN). Contribution of shocks due to the radio jet is observed at locations co-spatial with the radio hotspots at 050 northeast and 060 southwest of the nucleus, as evidenced by the emission-line ratio and gas kinematics. The stellar kinematics shows rotation with an amplitude at 250pc from the nucleus of 200 after corrected for the inferred inclination of 18.3∘. The stellar velocity dispersion obtained from the integrated K-band spectrum is , which implying on a mass for the supermassive black hole of , using the relation. The gas kinematics present three components: (1) gas in the plane of the galaxy in counter-rotation relative to the stars; (2) an outflow perpendicular to the radio jet that seems to be due to an equatorial AGN outflow; (3) turbulence of the gas observed in association with the radio hot spots, supporting an interaction of the radio jet with the gas of the disk. We estimated the mass of ionized and warm molecular gas of and , respectively.
keywords:
galaxies: individual (NGC 5929) – galaxies: Seyfert – galaxies: ISM – infrared: galaxies1 Introduction
Detailed mapping of the gas distribution, excitation and kinematics around Active Galactic Nuclei (AGN) is fundamental to the understanding of the physics behind the AGN feeding and feedback processes. Near-IR integral field spectroscopy (IFS) on 8-10 m telescopes of nearby galaxies has become a powerful tool to better understand these processes, as it provides a two-dimensional coverage with spatial resolution of a few to tens of parsecs at a spectral resolution that allows to resolve the gas kinematics and permitting isolating inflows and outflows in the central kiloparsec, where the relevant processes occur (e.g. Riffel et al., 2008; Müller-Sánchez et al., 2009; Davies et al., 2009; Storchi-Bergmann et al., 2010; Schartmann et al., 2010; Riffel & Storchi-Bergmann, 2011a; Riffel, Storchi-Bergmann & Winge, 2013; Davies et al., 2014; Riffel, Storchi-Bergmann & Riffel, 2014b).
Some of the main results obtained from IFS of the inner kpc of active galaxies are: (I) ionized and molecular gas have distinct flux distributions and kinematics. The near-IR line-emission at these scales is originated by the heating and ionization of the gas by the AGN radiation and shocks produced by radio jets (e.g. Riffel et al., 2006; Riffel, Storchi-Bergmann & Nagar, 2010a; Riffel, Storchi-Bergmann & Winge, 2013). The molecular H2 emitting gas is usually more restricted to the plane of galaxies, with kinematics dominated by rotation and inflows in the disk in most cases. The ionized gas emission traces a more disturbed medium, usually associated to outflows from the AGN, but frequently showing also a rotation component from the disk of the galaxy (e.g. Riffel, Storchi-Bergmann & Nagar, 2010a; Riffel & Storchi-Bergmann, 2011a, b; Storchi-Bergmann et al., 2010; Iserlohe et al., 2013; Mazzalay et al., 2014). (II) Outflows are seen within hollow cones or from compact structures with mass outflow rates in the range for low-luminosity Seyfert and Low-Ionization Nuclear Emission-line Regions (LINERs) galaxies (e.g. Riffel et al., 2009; Schönel et al., 2014) and for high-luminosity Seyferts (e.g. McElroy et al., 2014). The outflows are observed with velocities from 200 to 800 in ionized gas (Storchi-Bergmann, 2014a) and 150 in H2 when present (Davies et al., 2014). (III) Inflows are observed in H2 (e.g. Müller-Sánchez et al., 2006; Riffel, Storchi-Bergmann & Winge, 2013; Mazzalay et al., 2014) in Seyfert galaxies and in low-ionization gas in LINERs (Fathi et al., 2006; Storchi-Bergmann et al., 2007; Schnorr-Müller al., 2011, 2014a, 2014b) with mass inflow rates in the range (Storchi-Bergmann, 2014a, b). (IV) The stellar kinematics in Seyfert galaxies reveal cold nuclear structures composed of young stars, usually associated with a significant gas reservoir (Hicks et al., 2013; Riffel et al., 2010c, 2011c; Storchi-Bergmann et al., 2012).
NGC 5929 is a spiral galaxy with a Seyfert 2 nucleus located at a distance of 35.9 Mpc111as quoted in NASA/IPAC EXTRAGALACTIC DATABASE –http://ned.ipac.caltech.edu/. NGC 5929 has a companion, NGC 5930 at 20′′ northeast from it (Page, 1952). It presents a well defined bi-polar radio jet oriented along the position angle PA60∘, showing a triple structure with two bright hot spots, one located at 05 north-east from the nucleus and the other at 06 south-west from it. The third and fainter radio structure is observed at the nucleus of the galaxy (Ulvestad & Wilson, 1984; Wilson & Keel, 1989; Su et al., 1996). The orientation of the major axis of the large scale disk is PA45∘(e.g. Schmitt et al., 1997).
The gas kinematics of NGC 5929 has been studied for at least 3 decades. Using long slit spectroscopy along the orientation of the radio jet, Keel (1985) concluded that the ionized gas kinematics is consisten with rotation in the galaxy disk. Whittle et al. (1986) obtained long-slit spectra along PA=60∘ and PA=30∘ covering the H and O iii] emission lines and found double-component emission-line profiles along PA=30∘. They suggested that the origin of these profiles was the superposition of the two components observed along the PA=60∘ (one in blueshift to the north-east and one in redshift to the south-west) and unresolved by their observations, at a seeing of 16. Rosario et al. (2010) report the detection of shocked gas associated to the north-east radio hot spot by comparing optical long slit spectra obtained with the Hubble Space Telescope Imaging Spectrograph (HST/STIS) with radio images. These authors found that the low ionization gas (traced by H emission) shows broader emission-line profiles than the high ionization gas (traced by [O iii] emission line) at locations near the radio hot spot and suggested that this broadening is due to the interaction of the radio jet with the NLR. Evidence of shocks is also observed at the location of the south-western radio hot spot, for which Ferruit et al. (1999) showed that shock models with velocities of 300 km s1 are able to reproduce the optical and UV emission-line ratios. The low spectral and spatial resolutions and/or small spatial coverage of the data have not allowed the studies above to reveal the complete scenario for the gas kinematics in the nuclear region of NGC 5929, what we have been able to do now with our NIFS observations.
In Riffel, Storchi-Bergmann & Riffel (2014b, hereafter called Paper I) we have reported already the discovery of a peculiar structure along PA=30/150∘ in this galaxy from these observations, where the emission lines present double components. This structure was interpreted as being due to the interaction of the acquired gas from the companion with an “equatorial outflow” from the accretion disk around the central supermassive black hole (SMBH). In the present paper, we present a more complete study of the overall gas kinematics, as well as of the gas excitation and stellar kinematics of the inner of NGC 5929.
NGC 5929 represents the tenth galaxy of a series observed by our group AGNIFS (AGN Integral Field Spectroscopy) in which we present the emission-line flux distributions and kinematics as well as the stellar kinematics of the inner few hundreds of parsec of nearby active galaxies. The previous papers of this series have presented similar studies of the following galaxies: I - ESO 428-G14 (Riffel et al., 2006); II- NGC 4051 (Riffel et al., 2008); III - NGC 7582 (Riffel et al., 2009); IV - NGC 4151 (Storchi-Bergmann et al., 2009, 2010); V - Mrk 1066 (Riffel, Storchi-Bergmann & Nagar, 2010a; Riffel & Storchi-Bergmann, 2011a; Riffel et al., 2010c); VI - Mrk 1157 (Riffel & Storchi-Bergmann, 2011b; Riffel et al., 2011c); VII - Mrk 79 (Riffel, Storchi-Bergmann & Winge, 2013); VIII - NGC 1068 (Riffel et al., 2014a; Storchi-Bergmann et al., 2012; Barbosa et al., 2014); IX - Mrk 766 (Schönel et al., 2014).
This paper is organized as follows: In Section 2 we present the description of the observations and data reduction. In Sec. 3 we present the results for the continuum and line emission, including line-ratio maps as well as the gas and stellar kinematics. The discussion of the results is presented in Sec. 4 and the conclusions are presented in Sec. 5.
2 Observations and Data Reduction
NGC 5929 was observed using the Gemini Near-infrared Integral Field Spectrograph (NIFS – McGregor et al., 2003) on the Gemini North telescope operating with the adaptive optics module ALTAIR on the nights of March 16, May 24 and June 16, 2011 under the observation Programme GN-2011A-Q-43. The observations covered the J and Kl spectral bands, resulting in a wavelength coverage from 1.14m to 1.36m and 2.10m to 2.54m, respectively. The total on source exposure time for each band was 6000 s and the observations were splited into 10 individual on source exposures plus 5 sky exposures for each band.
The data reduction followed standard procedures and was accomplished using tasks contained in the nifs.gemini package which is part of iraf software. The procedures included the trimming of the images, flat-fielding, sky subtraction, wavelength and s-distortion calibrations, remotion of the telluric absorptions and flux calibration by interpolating a black body function to the spectrum of the telluric standard star.
The final data cubes contain 4500 spectra at a angular sampling of 005005, covering the inner 33′′ ( 520520 pc2) of NGC 5929. The angular resolution is 012 for both bands (corresponding to 20 pc at the galaxy), as obtained from the full width at half maximum (FWHM) of the images of the telluric standard stars. From the FWHM of the emission-line profiles of the Ar lamps we obtain the spectral resolution of 1.7 Å for the J band and 3.2 Å for the K band, corresponding to velocity resolutions of 40 km s-1 for both bands.


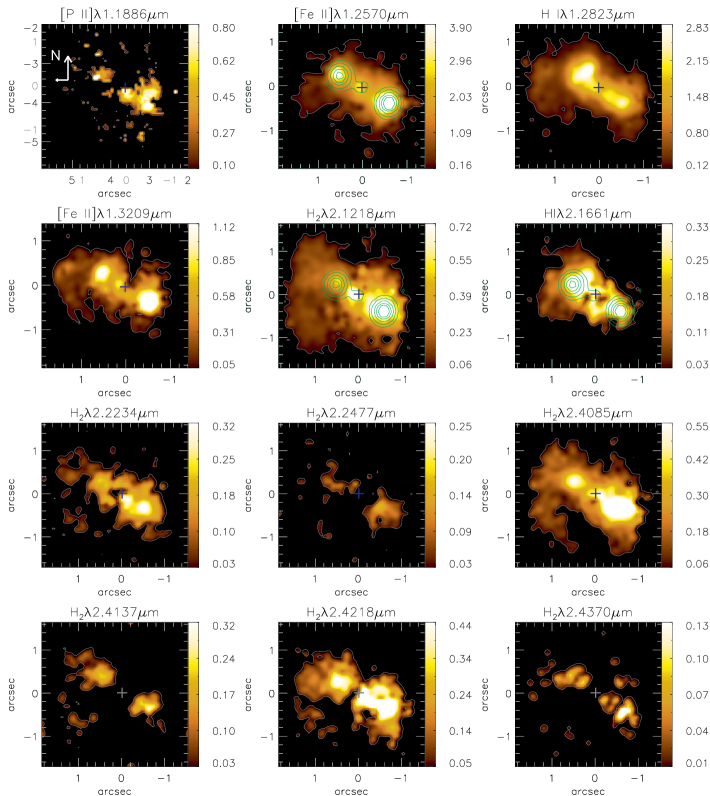
In the top-left panel of Fig. 1 we present a large scale -band image of NGC 5929 and its companion NGC 5930 from the Sloan Digital Sky Survey, covering 1.5′1.5′(Baillard et al., 2011). The top-right panel shows an optical image of NGC 5929 obtained with the Hubble Space Telescope (HST) Wide Field Planetary Camera 2 (WFPC2) through the broad-band filter F606W from Malkan, Gorjian & Tam (1998), covering the inner 30″30″. The green box represents the field of view of our NIFS data. The middle panel shows sample spectra obtained from the NIFS J-band datacube within apertures of 005005 for the following positions (from top to bottom): 06 southwest of the nucleus, corresponding to the position of the southwestern radio hotspot (Ulvestad & Wilson, 1989); 05 northeast of the nucleus, corresponding to the position of the northeastern radio hotspot (Ulvestad & Wilson, 1989); the nucleus; 035 northwest and 035 southeast of the nucleus along , perpendicular to the radio jet, where we found that the emission lines present double components (Riffel, Storchi-Bergmann & Riffel, 2014b). The following emission lines are identified in the J-band spectra: [P ii]1.14713 , [P ii]1.18861 m, [Fe ii]m, [Fe ii]m, [Fe ii]m, H i Pa1.28216 m, [Fe ii]m and [Fe ii]m. The bottom panel of Fig. 1 shows the spectra IN the K-band at the same positions of those IN the J-band. We identified the H i Br2.16612 m emission line and the H2 emission lines at 2.12183, 2.15420, 2.22344, 2.24776, 2.40847, 2.41367, 2.42180, 2.43697 and 2.45485 m. The CO absorption band-heads at 2.3 m used to measure the stellar kinematics are also identified in the K-band spectra.
3 Results
3.1 Emission-line profiles
As discussed in Paper I, the emission lines present double components along a strip (hereafter identified as the SE-NW strip) crossing the nucleus at , which have been attributed to gas outflowing from the nucleus perpendicularly to the radio jet. In Figure 2 we show a sample of the emission-line profiles of [Fe ii], H2 and Pa from three locations: along the SE-NW strip at 035 southeast of the nucleus (top panel) and at the positions of the radio knots along at 050 north-east (middle panel) and at 060 south-west (bottom panel) of the nucleus. The double components, reported in Paper I, are evident at the position 035 south-east, not only for [Fe ii] but also for the other emission lines, with profiles presenting similar widths. Indeed, all emission lines detected along the SE-NW strip present similar double components. At the positions of the radio hotspots or knots, the [Fe ii] profile is the broadest, H2 is the narrowest and the Paone is in between the two.The H2 and Pa are well reproduced by a single Gaussian curve, while the [Fe ii] profile clearly shows the presence of more than one component. A blue wing in the [Fe ii] profile is observed for the position at 050 northeast of the nucleus and at 060 southwest of the nucleus its profile is broader than a Gaussian curve. At positions away from the strip at and distant from the radio knots the emission lines are well reproduced by a single Gaussian component, as discussed in Paper I.

As shown in Fig. 1, several emission lines are observed in the J- and K-band spectra of NGC 5929. In order to measure the emission line flux distributions we fitted the observed line profiles at each spatial position by Gaussian curves using the profit routine Riffel (2010b). In table 1 we present the measured fluxes for the emission lines within an aperture of 035035 at five positions: the locations of the radio hotspots, at 050 northeast and 060 southwest of the nucleus; the nucleus; at 035 southeast and 035 northwest of the nucleus along the strip at (region where the equatorial outflow was observed in Paper I). Values followed by “∗” were obtained by the sum of the fluxes of the two components. The [Fe ii] line profile was fitted by three Gaussian curves at 060 southeast of the nucleus (at the location of a radio hotspot), and the flux quoted in the table is the sum of the fluxes of the three components. Sample fits of the [Fe ii] profile are shown in Paper I.
| ID | 050NE | 060SW | Nucleus | 035SE | 035NW | |
|---|---|---|---|---|---|---|
| 11471.3 | [P ii] | 12.15.3 | 6.34.3 | – | – | – |
| 11665.6 | [Fe ii] | 21.14.8 | – | – | – | – |
| 11863.7 | [Fe ii] | 10.45.7 | – | – | – | – |
| 11886.1 | [P ii] | 18.34.4 | 26.98.6 | – | – | – |
| 12570.2 | [Fe ii] | 179.415.3∗ | 299.918.0∗∗ | 110.28.2∗ | 35.08.5∗ | 110.19.3∗ |
| 12791.2 | [Fe ii] | 9.92.3 | 4.71.2 | – | – | 14.69.5∗ |
| 12821.6 | H i Pa | 117.35.2 | 106.110.8 | 79.09.3∗ | 29.14.4∗ | 157.912.1∗ |
| 12946.2 | [Fe ii] | 13.44.4 | 5.53.3 | 18.69.5∗ | 0.700.13∗ | 17.814.1∗ |
| 13209.2 | [Fe ii] | 60.920.4∗ | 69.07.8 | 13.68.2∗ | 2.210.26∗ | 24.520.9∗ |
| 13281.4 | [Fe ii] | 18.811.2 | – | – | – | – |
| 21218.3 | H22 1-0S(1) | 18.7 1.7 | 45.7 1.5 | 27.17.4∗ | 16.84.8∗ | 16.53.0∗ |
| 21542.0 | H2 1-0 S(2) | 1.9 0.7 | 2.1 0.6 | – | 3.82.9∗ | – |
| 21661.2 | H i Br | 16.4 1.5 | 14.5 1.3 | 12.92.4∗ | 10.53.0∗ | 12.53.5∗ |
| 22234.4 | H2 1-0 S(0) | 9.4 0.7 | 11.4 0.6 | – | – | – |
| 22477.6 | H2 2-1 S(1) | 4.90.62 | 5.2 1.0 | – | – | – |
| 24084.7 | H2 1-0 Q(1) | 21.8 1.3 | 39.5 0.7 | 25.86.8∗ | 13.86.4∗ | 15.56.0∗ |
| 24136.7 | H2 1-0 Q(2) | 6.3 2.5 | 7.9 1.9 | – | – | – |
| 24218.0 | H2 1-0 Q(3) | 18.0 2.8 | 32.3 2.8 | 25.014.4∗ | 15.49.9∗ | 17.613.1∗ |
| 24369.7 | H2 1-0 Q(4) | – | 12.6 1.9 | – | – | – |
| 24548.5 | H2 1-0 Q(5) | 14.3 3.6 | 22.9 4.7 | – | – | – |
| 24755.5 | H2 1-0 Q(6) | – | 8.4 4.1 | – | – | – |
| 25000.7 | H2 1-0 Q(7) | – | 10.58.2 | – | – | – |
| ∗ Emission-line profile fitted by two Gaussian curves and the flux represents the sum of the fluxes of both components; | ||||||
| ∗∗ Emission-line profile fitted by three Gaussian curves and the flux represents the sum of the fluxes of the components. | ||||||
3.2 Emission-line flux distributions
In order to obtain the flux distributions, we fitted only one Gaussian to all emission lines, for simplicity. Although two or three components reproduce better the profiles at some locations, as discussed above, the resulting error in the fluxes at these locations is lower than 5%.
Figure 3 shows the flux distributions for all measured emission lines. In each panel, black represents masked regions where the flux values are smaller than the standard deviation of the continuum values near the emission line or the uncertainty in the flux is higher than 40 %. Light gray contours delimit the masked regions and the green contours overlaid to some panels are from the radio image of Ulvestad & Wilson (1989). At most locations the uncertainties in flux are smaller than 15 %. For illustration purpose, we have rebbined the spaxels to 1/3 of their original size and then interpolated their fluxes. As the original spaxels (005005) are smaller than the angular resolution of our observations, this procedure does not affect the spatial resolution of the maps significantly. The line emission is more extended along the , extending up to 15 to both sides of the nucleus, while to the perpendicular direction () the emission is extended to 07 from the nucleus. The flux distributions of all emission lines show a good correlation with the radio structures, with the two peaks of emission associated to the southwestern and northeastern radio hotspots. Some differences are observed among distinct flux distributions. While the [Fe ii] and H2 fluxes peak at the location of the southwestern radio structure at 06 from the nucleus, the H i recombination lines present their highest fluxes at the location of the northeastern radio hotspot at 050 from the nucleus. Another difference is that the H2 emission is less collimated and more extended in all directions, as most clearly seen in the H2.1218 flux distribution (that presents the highest signal-to-noise ratio among the H2 lines).
3.3 Line-ratio maps
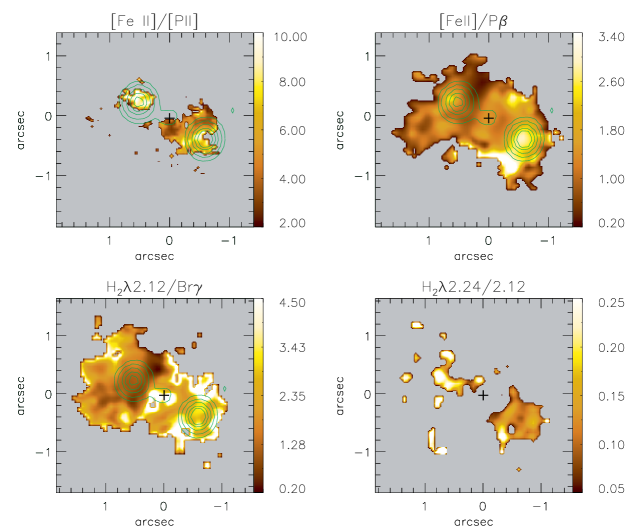
The excitation mechanisms of the [Fe ii] and H2 emission lines can be investigated using emission-line ratio maps. Figure 4 shows the [Fe ii]m/[P ii]m (top-left panel), [Fe ii]m/Pa (top-right panel), H2m/Br (bottom-left panel) and H2m/H2m (bottom-right panel) line ratio maps. The first two are useful to investigate the [Fe ii] emission origin and the last ones to investigate the H2 emission origin.
The [Fe ii]/[P ii] map shows values ranging from 2 to 10, with the highest values observed at the location of the northeastern radio knot and the lowest values at regions next to the nucleus of the galaxy. At the position of the southwestern radio knot, [Fe ii]/[P ii] is 7. The [Fe ii]/Pa line ratio shows values ranging from 0.5 to up to 3.5, with the highest values observed in regions next to the southwestern radio knot. A small enhancement in this ratio is also observed next to the northeastern radio knot, where the values are approximately 2.5. At most locations, the [Fe ii]/Pa ratio shows values in the range 0.6 to 2.0. Values smaller than 0.6 are observed only in a small region at 05 north-northeast of the nucleus.
The H2/Br line ratio shows values in the range from 0.2 to 4.5, with the highest values observed in regions surrounding the southwestern radio knot and at the nucleus. For most locations, the values of H2/Br are in the range 0.6-2.0 and the smallest values of 0.3 are observed at 05 north-northeast of the nucleus, at the same location where the [Fe ii]/Pa ratio map presents its smallest value. Finally, the H2 ratio map presents values ranging from 0.1 to 0.3 with the highest values seen at 05 northeast of the nucleus, associated to the radio knot there.
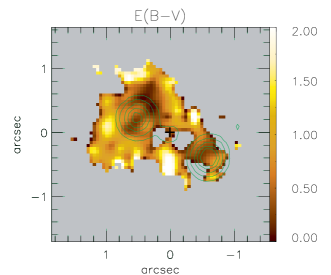
In Figure 5 we present a reddening map obtained from the Pa/Br line ratio using
| (1) |
where and are the fluxes of and emission lines, respectively. We have adopted the intrinsic ratio corresponding to case B recombination (Osterbrock & Ferland, 2006) and used the reddening law of Cardelli, Clayton & Mathis (1989). The values of for NGC 5929 range from 0 to 2, with the highest values observed to the south, southeast and east of the nucleus, while smaller values are observed approximately along the region covered bye the radio jet at , from the northeast to the southwest of the nucleus.
3.4 Stellar Kinematics
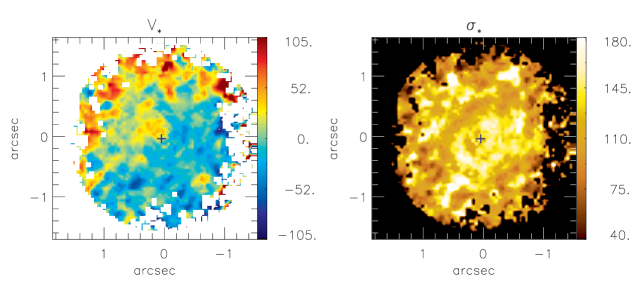
The K-band spectra of Fig. 1 show clearly the CO absorption band heads around 2.3 m. We used the Penalised Pixel-Fitting (ppxf) method of Cappellari & Emsellem (2004) to fit these bands and obtain the line-of-sight velocity distributions (LOSVD) of the stars, using the Gemini library of late spectral type stars observed with the Gemini Near-Infrared Spectrograph (GNIRS) IFU and NIFS (Winge, Riffel & Storchi-Bergamann, 2009) as templates. The stellar LOSVD was approximated by a Gaussian distribution. The ppxf outputs the stellar radial velocity (), the corresponding velocity dispersion (), as well as the uncertainties for both parameters at each spaxel.
Figure 6 presents the resulting maps for and . The signal-to-noise ratio of the spectra at locations next to the borders of the field of view was too low and we could not obtain good fits. These borders were then masked out. The white (black) regions in the () map correspond to these locations, where the uncertainties in or are larger than 30 . The stellar velocity field shows a velocity amplitude of about 100 , with redshifts to the northeast and blueshifts to the southwest, thus opposite from the rotation field observed for the gas, that has redshifts to the southwest and blueshifts to the northeast, as observed in Fig. 7. The map shows values ranging from 40 to 180 with a median value of and presents a partial ring of lower values (60–100 ) with radius of 05 surrounding the nucleus.
3.5 Gas Kinematics
We used the centroid wavelength of the emission lines [P ii] 1.1886 m, [Fe ii] 1.2570 m, Pa and H2.1218m at each position to map the velocities of the ionized gas forbidden lines, ionized gas permitted lines and molecular gas. These lines have been chosen because they present the highest S/N ratios among their species.
These maps are shown in Figure 7, where the white regions have been masked due to bad fits, following the same criteria used for the flux distributions of Fig. 3. All velocity maps show redshifts of up to 220 to the southwest of the nucleus and blueshifts of similar amplitude to the northeast of it. The zero velocity line is oriented approximately along , coincident with the strip where the lines are double.
Figure 8 presents the corresponding velocity dispersion () maps. The values for all emission lines are in the range 30 to 200 . At most locations, is lower than 100 . The highest values are observed along the SE-NW strip (that has a width of 03, thus 50 pc at the galaxy) crossing the nucleus perpendicularly to the radio jet and are due to the double components observed in the emission lines at these locations. These double components were attributed to and equatorial outflow in Paper I, where we presented the results only for [Fe ii]. Now we compare the [Fe ii] and [P ii] maps with those of Pa and H2 and we find some differences. The [Fe ii] and [P ii] maps show that, besides the high values observed along the SE-NW strip, there is also an increase of at and around the locations of the radio hotspots. The Pa and H2 maps, on the other hand, do not show any evidence of increased there. A comparison between the profiles of these lines at the location of the radio hotspots can be seen in Fig. 2: it is clear that the profile of the [Fe ii] line is broader than those of Pa and H2 lines as already reported in Paper I, being attributed to the interaction of the radio jet with the ambient gas.


3.6 Channel Maps
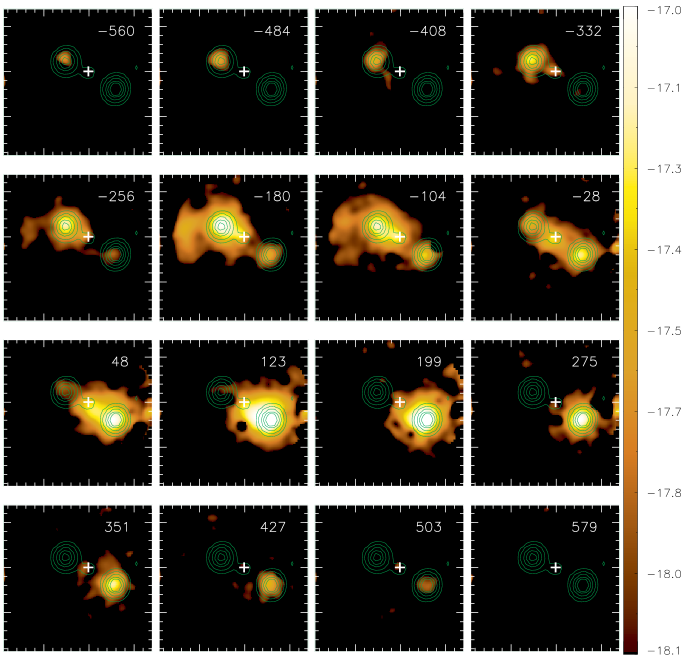
In figures 9, 10 and 11 we show velocity-channel maps along the Pa, [Fe ii] and H2 emission-line profiles, respectively. The H2 channel maps show emission for a velocity range from to , with the emission moving from northeast to southwest as the velocity increases, being consistent with a rotating disk. At low velocities, the Pa channel maps are similar to that observed for H2, but additional Pa emission from high velocity gas is observed associated to the radio hotspots to the northeast at the blueshifted channels and to the southwest at at the redshift channels. This suggests an interaction of the radio with the Pa emitting gas. For the [Fe ii] emission, the correlation of the line emission with the radio hotspots is more clear with emission being observed at velocities of up to 560 at blueshifts and 500 at redshifts.


4 Discussion
4.1 The emission-line flux distributions
All emission lines present their flux distributions more extended along the , which is the orientation of the radio jet (Ulvestad & Wilson, 1989; Su et al., 1996). The companion galaxy NGC 5930 is also at . Along the perpendicular direction, the line-emission extends only to 07 from the nucleus for most lines (a bit more for H2). In particular, along the SE-NW strip, we have concluded in Paper I that the gas is outflowing from the nucleus.
Although the bulk of the emission-line flux distributions is similar for all species, some differences are observed: (i) while the flux in the H i recombination lines peak at 05 northeast of the nucleus, the [Fe ii], [P ii] and H2 lines peak at 06 southwest of the nucleus; (ii) the [Fe ii], [P ii] and H i lines are more collimated along the radio axis than the H2 emission. We have similar differences between the flux distribution (and kinematics) of the ionized and molecular gas for most of the Seyfert galaxies we have studied so far in this project (Riffel et al., 2006, 2008, 2009, 2014a; Riffel, Storchi-Bergmann & Nagar, 2010a; Riffel & Storchi-Bergmann, 2011a, b; Storchi-Bergmann et al., 2009, 2010; Schönel et al., 2014).
We also note that the flux values along the SE-NW strip are lower than along the direction of the radio jet, revealing that the outflowing gas discovered in Paper I does not contributes much to the total luminosity. This is consistent with the interpretation that the radiation from the AGN escapes mainly along the ionization axis, which seems to be coincident with the radio axis and is blocked along the perpendicular direction due to the dusty torus postulated by the AGN unified model. This interpretation is supported by our discussion in Sec. 4.7, in which we conclude that X-ray heating (as X-rays can escape through the torus) is the main excitation mechanism of the H2 emission of both kinematic components observed along .
We can compare our results with previous ones from the literature. Optical Integral Field Spectroscopy (IFS) was obtained for NGC 5929 by Ferruit et al. (1997) at a seeing of 08 and by Stoklasová et al. (2009) with the instrument OASIS at the Canada France Hawaii Telescope (CFHT) in the low spatial resolution mode (04 sampling). Ferruit et al. (1997) present a contour map for the [N ii]+H emission, showing that it is more extended along the of the radio jet and with the peak of emission observed at 06 southwest of the nucleus, in good agreement with our flux distributions in the near-IR. Stoklasová et al. (2009) present flux and kinematic maps for the [O iii], H and [N i], finding a similar flux distribution to that of Ferruit et al. (1997). Although the optical emission-line flux distributions are also more extended along , similarly to what we observe, the optical lines do not show an emission peak to the northeast, as we have observed for the near-IR lines. We attribute this differences to the worse spatial resolution of the optical observations. This interpretation is supported by the work of Rosario et al. (2010), who present a Hubble Space Telescope narrow-band image for the [O iii] emission that clearly shows two main emission regions, one to the northeast and other to the southwest, with the highest fluxes observed to the southwest, in good agreement with the [Fe ii], [P ii] and H2 flux distributions.
Why do the near-IR H i recombination lines present distinct flux distributions from that of H in the flux map of Stoklasová et al. (2009)? As seen in Fig. 3 the Pa and Br flux maps present their peak at 05 northeast of the nucleus with a secondary peak at 06 southwest of it. On the other hand, the H flux distribution shows its emission peak to the southwest and although the emission is also extended to the northeast, there is no emission peak as observed for the near-IR lines. We attribute this difference to dust extinction, that is stronger in the optical than in the near-IR. Indeed, as seen in Fig. 5, the reddening is somewhat larger to the east/northeast of the nucleus supporting the conclusion that the near-IR emission is probing a dustier region than the optical emission. A difference of 0.5 mag in between the northeast and southwest sides corresponds to a ratio of 2.2 between the Pa fluxes of the northeast and southwest using the Cardelli, Clayton & Mathis (1989) extinction law, while for H the ratio would be higher, of 2.9. This difference would be enough to make the northeastern hotspot brighter than the southwestern hotspot in the H flux map of Stoklasová et al. (2009), supporting our conclusion that the difference between the near-IR and optical flux distributions is due to extinction.
4.2 The stellar kinematics and the mass of the SMBH
The stellar velocity field (left panel of Fig. 6) shows a rotation component, with the north-eastern side of the disk approaching and the south-western side receding with a velocity amplitude of about 80 . In order to derive the systemic velocity (), orientation of the line of nodes (), inclination () and eccentricity () of the disk, we fitted the stellar velocity field using the diskfit code (Spekkens & Sellwood, 2007; Sellwood & Sánchez, 2010; Kuzio et al., 2012).
The best rotating disk model is shown at the top-central panel of Fig. 13. The observed velocity field is shown at the top-left panel and the residual map is presented at the top-right panel of the same figure, respectively. The corresponding kinematic parameters are shown in Table 2.
The stellar velocity dispersion () can be used to estimate the mass of the supermassive black hole () at the center of NGC 5929, using the relationship. We obtain using the pPXF for an integrated K spectrum over the whole field of view. The can be estimated by (Kormendy & Ho, 2013):
We estimated a mass of .
The central velocity dispersion quoted in the Hyperleda database (Paturel et al., 2003) is , and results in .
4.3 The gas Kinematics
4.3.1 Equatorial outflow
In Paper I we have reported the discovery of a peculiar gas outflow along the SE-NW strip that has a width of 50 pc and an extent of 300 pc along , perpendicularly to the radio jet. At locations away from the SE-NW strip, the gas kinematics is consistent with orbital motion in a disk that is counter-rotating relative to the stellar disk. This rotation component is clear in our Fig. 7 that is based on a single-Gaussian fit to the emission line profiles and can be compared to the stellar velocity field shown in the left-panel of Fig. 6. Our stellar and gas velocity fields are very similar to those presented by Stoklasová et al. (2009), and derived from optical IFS, although they did not detect the outflow in the SW-NW strip due to their poorer spatial resolution.
In order to better show the distinct kinematic components along the SE-NW strip, where the mass outflow was observed in Paper I, we extracted one-dimensional cuts from the [Fe ii] flux distribution, velocity field and map for the two components along the strip. The of the two components was kept the same, as done in Paper I. These cuts are shown in Fig. 12, where it can be seen that the velocity of the two components are almost constant along the strip, with values of and 150 relative to the systemic velocity of the galaxy for the blue and red component, respectively. The fluxes of both components are similar at most locations, with the red component being brighter at distances smaller than 05 from the nucleus to the southeast. These components were attributed to the presence of an equatorial outflow (perpendicular to the radio jet) in Paper I. Such gas outflows appear in recent theoretical models of accretion disk winds (Li, Ostriker & Sunyaev, 2013) as well as in outflowing torus models (e.g Hönig et al., 2013; Elitzur, 2012), in which the outflows are originated as a consequence of the conservation of the gas angular momentum.
We can use the observed velocity and geometry of the emitting gas to estimate its mass outflow rate () in the equatorial outflow. The double components observed along are attributed to the equatorial outflow from the nucleus. As the outflow is observed as two similar velocity components, one in redshift and the other in blueshift, we have considered a scenario in which the outflow has generated a hollow cylinder of outflowing mass. Considering the width of the SE-NW strip (50 pc) as being the height () of the cylinder considered to have a radius , the mass outflow rate can be estimated by
| (2) |
where is the proton mass, the electron density, is the velocity of the outflowing gas, is the filling factor and is the lateral area of the cylinder. As the velocity of the outflow is approximately constant along the strip and there is no decreasing velocity as a function of distance from the center to NW and SW, we conclude that this cylinder has a large radius, at least the size of the region where emission is observed, 05.
Assuming , (which are typical values estimated for other Seyfert galaxies – e.g. Schnorr-Müller al., 2014a, b, 2011; Storchi-Bergmann et al., 2010), (from Fig. 12) and =05=87.5 pc, we obtain a lower limit (as the radius for the cylinder can be considered a lower limit) to the mass outflow rate in ionized gas of . This value is in the range of mass outflow rates observed for other Seyfert galaxies (Crenshaw & Kraemer, 2007; Barbosa et al., 2009; Storchi-Bergmann et al., 2010; Riffel et al., 2009; Riffel & Storchi-Bergmann, 2011a) with similar luminosities, although it is much smaller than those found in recent studies for high luminosity Seyfert 2 galaxies () which show (e.g. McElroy et al., 2014).
Finally, due to the apparent unique velocity of the outflow, it looks like that it is not continuous, but was generated by a ”blast” that has produced an expanding (cylindrical) shell of gas. If this is the case, we can estimate the age of the “blast” by resulting in Myr. Actually, this can be considered an upper limit for the age, as the outflow may have decelerated since the ejection from the AGN.

4.3.2 Interaction between the radio jet and emitting gas
Our data allowed us to observe also the kinematic effects of the interaction of the radio jet with the [Fe ii] emitting gas, as discussed in Paper I based on a two Gaussian component fit to the [Fe ii] line profile. The interaction of the radio jet with the gas produces wings in the [Fe ii] line profile at locations around the radio hotspots. In the single-Gaussian fit, this effect appears as an enhancement of at these locations, as seen in Fig. 8. Rosario et al. (2010) claims also to have found similar signatures of shocks due to the radio jet, using optical long slit observations with the HST.
Although signatures of the interaction of the radio jet with the ISM are clearly observed for the [Fe ii] emission, the H2 and H recombination lines show weaker signatures, only observed in the channel maps. This indicates that the [Fe ii] emission traces a more disturbed kinematics than the molecular and atomic hydrogen. This can be interpreted as due to shocks destroying dust grains in its passage through the gas, releasing the Fe atoms, that are then ionized and emit.This conclusion is supported by the reduced reddening observed along the ionization and radio jet axis of the AGN, and also in agreement with previous results we have found for other Seyfert galaxies: the molecular gas and the ionized gas emitting the [Fe ii] lines trace distinct kinematics and flux distributions with the former more restricted to the plane of the galaxies and the latter usually associated to outflows from the nucleus (Riffel et al., 2008, 2009; Riffel, Storchi-Bergmann & Nagar, 2010a; Riffel & Storchi-Bergmann, 2011a; Riffel, Storchi-Bergmann & Winge, 2013; Riffel et al., 2014a; Storchi-Bergmann et al., 2009, 2010; Barbosa et al., 2014).
We can also speculate on the age of the radio jet. Assuming the jet velocity of , if the jet were in the plane of the sky with a size of 05, the age would be 2850 yr. If the inclination of the jet relative to the plane of the sky is 45∘, the age would be about 4000 years and we thus conclude that the radio jet is younger than the ”blast” generating the equatorial outflow. Alternatively, the jet is much more inclined toward us and could have been emitted together with the ”blast”, taking also in consideration that the velocity of the outflow may have been larger when it was generated.
4.3.3 Rotating disk
As observed in the stellar velocity field, the gas velocity fields (Fig. 7) also support the presence of a rotating disk component, although the gas is clearly counter-rotating relative to the stars. This was already observed by Stoklasová et al. (2009), as mentioned above. In order to confirm the presence of this component and derive the corresponding kinematic parameters, we fitted the Pa, [Fe ii] and H2 velocity fields using the diskfit code (Spekkens & Sellwood, 2007; Sellwood & Sánchez, 2010; Kuzio et al., 2012) for a rotating disk model. In order to fit the rotation component of the gas velocity field, we excluded the velocities from the SE-NW strip. The exclusion followed the same criteria adopted in Paper I, in which regions with for the [Fe ii] line along were attributed to the equatorial outflow.
The corresponding best models are shown in the central panels of Fig. 13, while the observed velocity fields and the residual maps are presented in the left and right panels, respectively. As the kinematics for distinct emission lines are similar, we show only the maps for the H2 in this figure. It can be seen that the residuals are smaller than 50 km/s at most locations, indicating that the velocity fields are reasonably well representing by rotation in a disk. In Table 2 we present the kinematic parameters for the best fit models. The systemic velocity (), ellipticity of the orbits (), inclination of the disk () and position of the kinematical center (, ) for the molecular and ionized gas and stars are very similar. The kinematical center is measured relative to the peak of the K-band continuum and was kept fixed for the stellar velocity field in order to reduce the number of free parameters to be fitted, as the stellar velocity field is nosier than those for the emission lines.
The orientation of the line of nodes () obtained from the fit of the gas velocity fields are consistent with each other, while for the stellar velocity field is approximately opposite to that of the gas (differing by 190∘).
We can compare the kinematical parameters from Table 2 with those for the large scale disk, that are quoted in the Hyperleda database (Paturel et al., 2003). The heliocentric systemic velocity obtained from the fit is in good agreement with the large scale value ( ) obtained from optical emission lines, while the inclination of the disk and the ellipticity of the orbits are a bit smaller than those for the large scale disk (). The orientation of the line of nodes is smaller than that of the large scale disk (e.g. Schmitt et al., 1997). We attribute the origin of this rotating gas disk to the interaction with NGC5930. The gas velocity amplitude, corrected by the inclination of the disk is about 580 .The high rotation velocities indicate that this gas is still not in orbital equilibrium in the galaxy gravitational potential. This gas is probably the source of the feeding of the AGN.
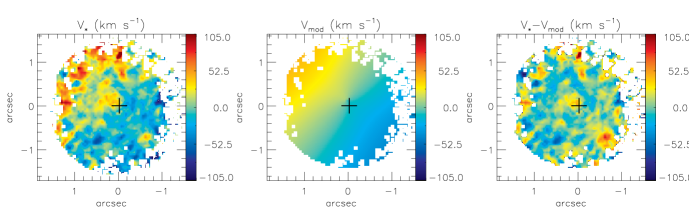
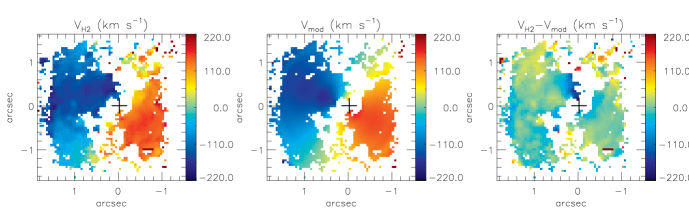
| Velocity Field | () | (, ) | |||
|---|---|---|---|---|---|
| H2 | 2500.117.4 | 25.71.3∘ | 18.41.2∘ | (0201, 0101) | |
| Pa | 2472.818.5 | 36.51.1∘ | 18.21.3∘ | (0101, 0001) | |
| [Fe ii] | 2469.318.5 | 25.44.4∘ | 18.27.8∘ | (0101, 0001) | |
| Stars | 2489.417.1 | 219.91.3∘ | 18.26.7∘ | (0, 0) fixed |
4.4 Mass of ionized and molecular gas
The mass of the ionized gas in the inner 520520 pc2 can be estimated by
| (3) |
where is the integrated flux for the Br emission line and is the distance to NGC 5929 (Osterbrock & Ferland, 2006; Storchi-Bergmann et al., 2009). We have assumed an electron temperature K and electron density .
The mass of the warm molecular gas is given by
| (4) |
where is the integrated flux for the H2m emission line and we have used the vibrational temperature T=2000 K (e.g. Scoville et al., 1982; Riffel et al., 2008).
Integrating over the whole IFU field (520520 pc2) we obtain and , that results in and .
The masses of warm molecular and ionized gas are in the range of values found for other active galaxies, which have and (Riffel et al., 2008, 2009; Riffel, Storchi-Bergmann & Nagar, 2010a; Riffel & Storchi-Bergmann, 2011b; Riffel et al., 2014a; Storchi-Bergmann et al., 2009; Riffel, Storchi-Bergmann & Winge, 2013; Mazzalay et al., 2013). However, the galaxies from these studies are located at a large range of distances (10–100 Mpc) and thus the corresponding sizes of the regions covered by the observations – obtained with NIFS (and SINFONI) – are distinct for the distinct objects.
In order to be able to compare similar quantities, we now calculate the average mass surface density, instead of the mass. For NGC 5929 we get and for the mass surface density of the warm molecular and ionized gas, respectively.
These values are in the range observed for other galaxies, that renge from for NGC 1068 (Riffel et al., 2014a) to for NGC 2110 (Diniz et al., 2015) for the warm molecular gas and from for NGC 1068 (Riffel et al., 2014a) to for NGC 4151 (Storchi-Bergmann et al., 2009) for the ionized gas. However, as the galaxies of our sample present distances in the range of 9.3 Mpc (for NGC 4151) to 93.8 Mpc (for Mrk 79), distinct average densities are expected for similar radial density profiles with decreasing gas densities as a function of distance from the nucleus.
In order to compare the masses of ionized and and warm molecular gas closest to the nucleus, we used the previous data obtained by our group to estimate the masses within a fixed physical aperture of pc2. This aperture was chosen as being the whole field of view of the nearest object of the sample. The mass of ionized gas ionized gas within this aperture is in the range M⊙ and the mass of warm molecular ranges from 3 to 455 M⊙, approximately. The lowest values for both ionized and molecular gas masses are observed for NGC 4051, while NGC 1068 presents the highest values. For NGC 5929 we find and for the inner pc2, which corresponds to an aperture of only 0606. The median ratio between ionized and molecular gas masses is , similar to the ratio for NGC 5929 of .
However, the total mass of molecular gas, including the cold gas is much larger than the values obtained here. The ratio between cold and warm molecular gas observed in the central region of active galaxies is in the range 10107 (Dale et al., 2005; Müller-Sánchez et al., 2006; Mazzalay et al., 2013) and thus, the total amount of molecular gas in the inner of NGC 5929 should be at least with a surface mass density of .
4.5 The origin of the [Fe ii] emission
The origin of the [Fe ii] emission in AGNs can be investigated using the line-ratio maps shown in Fig. 4. The [Fe ii] emission is excited in partially ionized gas regions, which can be produced by X-ray (e.g. Simpson et al., 1996) and/or shock heating (e.g. Forbes & Ward, 1993) of the gas. Values of [Fe ii]/Pa indicate that most of the [Fe ii] line emission is produced by shocks, while [Fe ii]/Pa indicate that photo-ionization dominates the emission (Rodríguez-Ardila et al., 2004; Rodríguez-Ardila, Riffel & Pastoriza, 2005).
The [Fe ii]m/Pa line ratio for NGC 5929 is shown in the top-right panel of Fig. 4. At most positions this ratio has values larger than 0.6, with the exception of only a small region at 08 north-northeast of the nucleus. At locations co-spatial with the radio knots, the [Fe ii]m/Paratio is larger than 2.0, suggesting that the interaction of the radio jet with the gas has an important role in the observed [Fe ii] emission. At the northeastern radio hotspot, [Fe ii]/Pa, while at the southwestern radio hotspot [Fe ii]/Pa. At the nucleus and along THE SE-NW strip a typical value for [Fe ii]/Pa is 1.5, suggesting that both, photo-ionization and shocks contribute to the excitation of [Fe ii], with a larger contribution of shocks though (as this value is closer to 2.0 than to 0.6).
The [Fe ii]1.2570m and [P ii]1.8861m lines have similar excitation temperatures, and their parent ions have similar ionization potentials and radiative recombination coefficients and the [Fe ii]/[P ii] line ratio map shown in top-left panel of Fig. 4 is also useful to investigate the [Fe ii] emission origin. Values larger than 2.0 indicate that shocks have passed through the gas destroying the dust grains, releasing the Fe and thus enhancing its observed abundance. For supernova remnants, where shocks are the dominant excitation mechanism, [Fe ii]/[P ii] is typically higher than 20 (Oliva et al., 2001). In NGC 5929, at all locations where both lines are detected, [Fe ii]/[P ii] is larger than 2.0, suggesting that shocks contribute to the [Fe ii] emission and supporting the conclusion reached from the [Fe ii]/Pa ratio map. At the position of the hotspots, values of up to 10 are observed, supporting an even stronger interaction of the radio jet and with the gas.
As the [Fe ii] emission-line profiles are complex at many locations, as seen in Fig. 2, with extended wings at locations close to the radio knots and double components along the SE-NW strip, we also constructed [Fe ii]/Pa line-ratio channel maps (constructing line ratios at different velocity bins) in order to determine the gas excitation mechanism at distinct velocities. The resulting channel maps are shown in Fig. 14. Each panel presents the [Fe ii]/Pa line-ratio map centered at the velocity shown in the top-right corner of the panel, relative to the systemic velocity of the galaxy. In order to avoid spurious features, we masked regions in which one or both lines present fluxes smaller than 3 times the standard deviation of the continuum next to the line. These regions are shown in gray in the figure and the contours are from the radio image.
The [Fe ii]/Pa ratio shows values ranging from 0.2 to up to 4.5. The highest values are observed for the gas at the highest velocities (largest blueshifts and redshifts) and present an excellent correlation with the radio knots. These high [Fe ii]/Pa values are interpreted as a strong evidence that the [Fe ii] is produced by the interaction of the radio jet with the NLR gas. For smaller velocities, at most locations the values are smaller than 2.0, with typical values of 1.2, suggesting that X-rays from the central AGN are the main drivers of the [Fe ii] emission. Line emission is observed along the SE-NW strip only at velocities lower than 180 . The values of [Fe ii]/Pa there are somewhat higher the one observed at other locations, but still much smaller than those seen at the radio knots. Typical values are [Fe ii]/Pa, suggesting that shocks are also important along the SE-NW strip. These shocks may be associated to the equatorial outflows we have reported at this locations in Paper I.
We conclude that the main excitation mechanism of the [Fe ii] emission in NGC 5929 are shocks due to the radio jet, with some contribution from X-ray heating at locations distant from the radio structures. The highest velocity gas is associated to the interaction of the radio jet with the ISM and thus we conclude that its [Fe ii] emission is produced mainly by shocks, while X-ray excitation is more important for the rotating gas at lower velocities. These results are supported by the line-ratio maps and by the correlation between the emission-line flux distributions and the radio image, and are in good agreement with those of previous similar studies for other Seyfert galaxies (e.g. Rodríguez-Ardila et al., 2004; Rodríguez-Ardila, Riffel & Pastoriza, 2005; Riffel et al., 2006; Riffel, Storchi-Bergmann & Nagar, 2010a; Storchi-Bergmann et al., 1999, 2009).

4.6 H2 excitation
The excitation of the H2 line emission in the near-IR can be due to (i) fluorescence through absorption of soft-UV photons (912–1108 Å) in the Lyman and Werner bands (Black & van Dishoeck, 1987) and/or by thermal processes due to the heating of the gas by shocks (due to the interaction of the radio jet with the emitting gas and/or supernovae) (Hollenbach & McKee, 1989) or by X-rays from the central AGN (Maloney, Hollenbach & Tielens, 1996). Several works have been aimed to study the origin of the H2 emission in AGN using long-slit (e.g. Reunanen, Kotilainen & Prieto, 2002; Rodríguez-Ardila et al., 2004; Rodríguez-Ardila, Riffel & Pastoriza, 2005; Davies et al., 2005; Ramos Almeida, Pérez García & Acosta-Pulido, 2009) and integral-field spectroscopy (e.g. Riffel et al., 2006, 2008, 2014a; Riffel, Storchi-Bergmann & Nagar, 2010a; Riffel, Storchi-Bergmann & Winge, 2013; Riffel & Storchi-Bergmann, 2011b; Storchi-Bergmann et al., 2009; Müller-Sánchez et al., 2009; Hicks et al., 2009; Friedrich et al., 2010; Mazzalay et al., 2013; Iserlohe et al., 2013).
In order to distinguish between fluorescence and thermal processes, we used the observed fluxes for all H2 emission lines in the K band to calculate the thermal excitation temperature. If the H2 emission is dominated by thermal processes and under the assumption of an ortho:para abundance ratio of 3:1, the following relation is valid (Wilman, Edge & Juhnstone, 2005):
| (5) |
where is the flux of the H2 line, is its wavelength, is the spontaneous emission coefficient, is the statistical weight of the upper level of the transition, is the energy of the level expressed as a temperature and is the excitation temperature. Thus, if the observed fluxes can be reproduced by the equation above, the H2 may be dominated by thermal processes. The resulting plot for (plus an arbitrary constant) is shown in Fig. 15 for the fluxes shown in Table 1 for the locations of the two radio hotspots at 05 northeast and 06 southwest of the nucleus. We do not show plots for other positions of Table 1 because only few lines were detected at these locations. As seen in Fig. 15, the observed fluxes are well reproduced by the equation (shown as a continuum line) at both positions, indicating that thermal processes are the main excitation mechanism of the H2 lines. The resulting excitation temperature are K and K at 05 northeast and 06 southwest of the nucleus, respectively.

The H22.1218/Br emission-line ratio map shown in Fig. 4 can also be used to investigate the nature of the H2 excitation. For Starburst galaxies and H ii regions this ratio is H2/Br0.6. Larger values are observed for Seyfert nuclei, where the heating of the gas by shocks and X-rays provide additional thermal excitation. Typical values for Seyfert galaxies are in the range 0.6H22.1218/Br2.0 (Rodríguez-Ardila et al., 2004; Rodríguez-Ardila, Riffel & Pastoriza, 2005), although recent studies suggest a broader range of values 0.4H22.1218/Br6.0 for AGNs, including LINERs (Riffel et al., 2013). NGC 5929 presents values larger than 2.0 at most locations, confirming that thermal processes are dominating the H2 excitation. The only exception is a small region with values of 0.3 at 08 north-northeast of the nucleus, where the [Fe ii]/Pa also presents small values. Typical values to the northeast are H2/Br1.0, while to the southwest values of up to 4.5 are observed in regions surrounding the radio knot, suggesting that shocks due to the radio jet contribute to the H2 emission at this location. Similar high values are also observed at the nucleus and along the SE-NW strip, where the interaction of the outflows seen in Paper I with the ambient gas might enhance the H2 emission.
We also constructed channel maps for the H2/Br ratio in order to investigate the origin of the H2 emission at distinct kinematics. These channel maps are shown in Fig. 16. The range of velocities is much smaller than those seen for the [Fe ii]/Pa channel maps in Fig. 14 and the maps are much noisier due to a lower S/N ratio at the K-band lines. At locations of the radio knots, the H2/Br values are larger than 2.0, supporting a the contribution of shocks due to the radio jet to the H2 excitation at these positions, in particular at the southwestern radio knot, where the highest values of H2/Br are observed at the highest velocities channel maps.

Finally, the H22.2477/2.1218 can also be used to distinguish between excitation of the H2 by thermal processes and fluoresce. For thermal processes, this ratio is and for fluorescent excitation it is (e.g. Mouri, 1994; Reunanen, Kotilainen & Prieto, 2002; Rodríguez-Ardila et al., 2004; Storchi-Bergmann et al., 2009). The H22.2477/2.1218 ratio map is shown in Fig. 4 and presents values ranging from 0.1 to 0.25, supporting the conclusion above that fluorescent excitation is not important for NGC 5929.
Thus, we conclude that the H2 emission observed in NGC 5929 is excited by thermal processes, due to heating of the gas by shocks and X-rays from the central AGN. At locations co-spatial with the radio jet and along the SE-NW strip shocks play an important role as indicated by the enhancement of the line ratios. Away from these locations, X-ray heating may dominate the H2 excitation.
4.7 The origin of the double components
Do the double components observed along the SE-NW strip have distinct origin than the emission from the disk? We can better investigate the origin of the emission of the outflowing gas by the emission-line ratios. Figure 17 presents the [Fe ii]/Pa and H2/Br emission-line ratios for the blue (asterisks) and red (diamonds) components along a pseudo slit with 035 width oriented along the SE-NW strip at . For the [Fe ii]/Pa both components show typical values of Seyfert galaxies, with average values of 1.0 and 1.3 for the blue and red components, respectively. The H2/Br show some values larger than 2 at some positions, but at most locations these ratio show values typical of Seyfert galaxies. The average values are 1.3 and 2.1 for the blue and red components, respectively. As the line ratio of both components show typical values of Seyfert galaxies, the emission of the outflowing gas might be due to heating by X-rays from the central AGN.

5 Conclusions
We used Gemini integral field J- and Kl-band spectroscopy of the inner 250 pc radius of the Seyfert 2 galaxy NGC 5929, at spatial resolution 20 pc and velocity resolution 40 , to map the stellar and gas kinematics and the flux distributions of emission lines from the ionized and warm molecular gas. Our main conclusions are:
-
•
The flux distributions for the H2, H recombination and forbidden emission lines are extended to up to 250 pc, with the highest flux levels oriented along (the direction of the radio jet), and well correlated with the radio emission. The H2 emission is more distributed over the whole field of view, while the emission of the ionized gas is more collimated along the direction of the radio jet.
-
•
The excitation of the H2 and [Fe ii] at all locations is dominated by thermal processes, mainly due to heating of the gas by X-rays emitted emitted by the central AGN. Some contribution from shocks is observed in the high velocity gas at locations next to the radio hotpots, as indicated by the [Fe ii]/Pa and H2/Br line-ratio channel maps.
-
•
The stellar velocity field shows rotation with an amplitude of up to 200 when corrected for the inferred inclination of 18.3∘, and a velocity dispersion reaching 180 . From the relationship, we estimated a mass for the supermassive black hole of using the median stellar velocity dispersion of .
-
•
The gas kinematics present three components: (i) a counter-rotating disk (relative to the stellar velocity field); (ii) an equatorial outflow (perpendicular to the radio jet), thus in the plane of the torus, with a mass-outflow rate of and (iii) kinematic disturbances observed in association with the radio hot spots in blueshift to the northeast and redshift to the southwest, what supports that the radio jet is tilted towards us at the northeast and away from us at the southwest.
-
•
From the Br and H2 emission-line fluxes, we calculate the mass of ionized and warm molecular gas of and , respectively. These values correspond to mass surface densities of and , which are in the range of values observed for other galaxies.
Our favored scenario for this galaxy is that the interaction with NGC 5930 has sent gas towards the nucleus of NGC5929, triggering the nuclear activity. If the observed equatorial outflow can be considered the first blast of the AGN, we estimate that this happened less than 1 Myr ago.
Acknowledgments
We thank the referee for his/her thorough review, comments and suggestions, which helped us to significantly improve this paper. Based on observations obtained at the Gemini Observatory, which is operated by the Association of Universities for Research in Astronomy, Inc., under a cooperative agreement with the NSF on behalf of the Gemini partnership: the National Science Foundation (United States), the Science and Technology Facilities Council (United Kingdom), the National Research Council (Canada), CONICYT (Chile), the Australian Research Council (Australia), Ministério da Ciência e Tecnologia (Brazil) and south-eastCYT (Argentina). This research has made use of the NASA/IPAC Extragalactic Database (NED) which is operated by the Jet Propulsion Laboratory, California Institute of Technology, under contract with the National Aeronautics and Space Administration. R.A.R. acknowledges support from FAPERGS (project N0. 2366-2551/14-0) and CNPq (project N0. 470090/2013-8 and 302683/2013-5).
References
- Barbosa et al. (2009) Barbosa, F. K. B., Storchi-Bergmann, T., Cid Fernandes, R., Winge, C., Schmitt, H., 2009, MNRAS, 396, 2.
- Barbosa et al. (2014) Barbosa, F. K., Storchi-Bergmann, McGregor, P., Vale, T. B., Riffel, R. A.., 2014, MNRAS, 455, 2353.
- Baillard et al. (2011) Baillard, A. et al., 2011, 532, 74.
- Black & van Dishoeck (1987) Black, J. H., & van Dishoeck, E. F. 1987, ApJ, 322, 412.
- Cardelli, Clayton & Mathis (1989) Cardelli,J. A., Clayton, G. C. & Mathis, J. S., 1989, ApJ, 345,245.
- Cappellari & Emsellem (2004) Cappellari, M., Emsellem, E. 2004, PASP, 116, 138.
- Crenshaw & Kraemer (2007) Crenshaw, D. M., & Kraemer, S. B. 2007, ApJ, 659, 250.
- Dale et al. (2005) Dale, D. A., Sheth, K., Helou, G., Regan, M. W., & Hüttemeister, S., 2005, ApJ, 129, 2197.
- Davies et al. (2005) Davies, R. I., I., Sternberg, A., Lehnert, M. D., & Tacconi-Garman, L. E., 2005, ApJ, 633, 105.
- Davies et al. (2009) Davies, R. I., Maciejewski, W., Hicks, E. K. S., Tacconi, L. J., Genzel, R., Engel, H., 2009, ApJ, 702, 114.
- Davies et al. (2014) Davies, R. I. et al. 2014, ApJ, 792, 101.
- Diniz et al. (2015) Diniz, M. R., Riffel, R. A., Stochi-Bergmann, T., Winge, C., 2015, submitted to MRAS.
- Elitzur (2012) Elitzur M., 2012, ApJL, 747, L33.
- Fathi et al. (2006) Fathi, K., Storchi-Bergmann, T., Riffel, R. A., Winge, C., Axon, D. J., Robinson, A., Capetti, A., & Marconi, A., 2006, ApJl, 641, L25.
- Ferruit et al. (1997) Ferruit, P., Pecontal, E., Wilson, A. S., Binette, L.Wilson, A. S., 1997, A&A, 328, 493.
- Ferruit et al. (1999) Ferruit, P., Wilson, A. S., Whittle, M., Simpson, C., Mulchaey, J. S., & Ferland, G., 1999, ApJ, 523, 147.
- Forbes & Ward (1993) Forbes, D. A. & Ward, M. J. 1993, ApJ, 416, 150.
- Friedrich et al. (2010) Friedrich, S., Davies, R. I., Hicks, E. K. S., Engel, H.; Müller-Sánchez, F., Genzel, R., Tacconi, L. J., 2010, A&A, 519, 79.
- Hicks et al. (2009) Hicks, E. K. S., Davies, R. I., Malkan, M. A., Genzel, R., Tacconi, L. J.; Sánchez, F. M., Sternberg, A., 2009, ApJ, 696, 448.
- Hicks et al. (2013) Hicks, E. K. S., Davies, R. I., Maciejewski, W., Emsellem, E., Malkan, M. A., Dumas, G., Müller-Sánchez, F., Rivers, A., 2013, ApJ, 768, 107.
- Ho (2005) Ho, L. C., 2005, Ap&SS, 300, 219
- Hollenbach & McKee (1989) Hollenbach, D., & McKee, C. F., 1989, ApJ, 342, 306.
- Hönig et al. (2013) Hönig, S. F. et al., 2013, MNRAS, 771, 87.
- Iserlohe et al. (2013) Iserlohe, C., Krabbe, A., Larkin, J. E., Barczys, M., McElwain, M. W., Quirrenbach, A., Weiss, J., Wright, S. A., 2013, A&A, 556, 136.
- Kormendy & Ho (2013) Kormendy, J., & Ho, L. C. 2013, ARA&A, 51, 511.
- Keel (1985) Keel, W. C., 1985, Nature, 318, 43.
- Li, Ostriker & Sunyaev (2013) Li, J., Ostriker, J., Sunyaev, R., 2013, ApJ, 767, 105L.
- Kuzio et al. (2012) Kuzio de Naray, R., Arsenault, C. A., Spekkens, K., Sellwood, J. A., McDonald, M., Simon, J. D., & Teuben, P. 2012, MNRAS, 427, 2523
- Larkin et al. (1998) Larkin, J. E., Armus, L., Knop, R. A., Soifer, B. T., & Matthews, K., 1998, ApJS, 114, 59.
- Malkan, Gorjian & Tam (1998) Malkan, M. A., Gorjian, V. & Tam, R., 1998, ApJS, 117,25.
- Maloney, Hollenbach & Tielens (1996) Maloney, P. R., Hollenbach, D. J., & Tielens, A. G. G. M., 1996, ApJ, 466, 561.
- Mazzalay et al. (2013) Mazzalay, X. et al., 2013, MNRAS, 428, 2389
- Mazzalay et al. (2014) Mazzalay, X. et al., 2014, MNRAS, 438, 2036.
- McElroy et al. (2014) McElroy, R., Croom, S. M., Pracy, M., Sharp, R., Ho, I-T., Medling, A. M., 2014, http://arxiv.org/abs/1410.6552.
- McGregor et al. (2003) McGregor, P. J. et al., 2003, Proceedings of the SPIE, 4841, 1581.
- Mouri (1994) Mouri, H. 1994, ApJ, 427, 777.
- Müller-Sánchez et al. (2006) Müller-Sánchez F., Davies R. I., Eisenhauer F., Tacconi L. J., Genzel R., Sternberg A., 2006, A&A, 454, 492.
- Müller-Sánchez et al. (2009) Müller-Sánchez, F., Davies, R. I., Genzel, R., Tacconi, L. J., Eisenhauer, F., Hicks, E. K. S., Friedrich, S., & Sternberg, A., 2009, ApJ, 691, 749.
- Nemmen et al. (2006) Nemmen, R. S., Storchi-Bergmann, T., Yuan, F., Eracleous, M., Terashima, Y., Wilson, A. S., 2006, ApJ, 643, 652.
- Oliva et al. (2001) Oliva, E. et al. 2001, A&A, 369, L5.
- Osterbrock & Ferland (2006) Osterbrock, D. E. & Ferland, G. J., 2006, Astrophysics of Gaseous Nebulae and Active Galactic Nuclei, Second Edition, University Science Books, Mill Valley, California.
- Page (1952) Page, T, 1952, ApJ, 116, 63.
- Paturel et al. (2003) Paturel, G., Petit, C., Prugniel, Ph., Theureau, G., Rousseau, J., Brouty, M., Dubois, P. & Cambrésy, L., 2003, A&A, 412, 45.
- Ramos Almeida, Pérez García & Acosta-Pulido (2009) Ramos Almeida, C., Pérez García, A. M., & Acosta-Pulido, J. A., 2009, ApJ, 694, 1379.
- Reunanen, Kotilainen & Prieto (2002) Reunanen, J., Kotilainen, J. K., & Prieto, M. A., 2002, MNRAS, 331, 154.
- Riffel et al. (2006) Riffel, R. A.., Sorchi-Bergmann, T., Winge, C., Barbosa, F. K. B., 2006, MNRAS, 373, 2.
- Riffel et al. (2008) Riffel, R. A., Storchi-Bergmann, T., Winge, C., McGregor, P., Beck, T. & Schmitt, H., 2008, MNRAS, 385, 1129
- Riffel et al. (2009) Riffel, R. A.., Storchi-Bergmann, T., Dors, O. L., Winge, C., 2009, MNRAS, 393, 783.
- Riffel, Storchi-Bergmann & Nagar (2010a) Riffel, R. A.., Storchi-Bergmann, T. & Nagar, N. M., 2010, MNRAS, 404, 166.
- Riffel (2010b) Riffel, R. A.., 2010, Ap&SS, 327, 239.
- Riffel et al. (2010c) Riffel, R. A.. & Storchi-Bergmann, T., Riffel, R., & Pastoriza, M. G., 2010, ApJ, 713, 469.
- Riffel & Storchi-Bergmann (2011a) Riffel, R. A.. & Storchi-Bergmann, T., 2011, MNRAS, 411, 469.
- Riffel & Storchi-Bergmann (2011b) Riffel, R. A.. & Storchi-Bergmann, T., 2011, MNRAS, 417, 2752.
- Riffel, Storchi-Bergmann & Winge (2013) Riffel, R. A., Storchi-Bergmann, T., Winge, C., 2013, 430, 2249.
- Riffel et al. (2014a) Riffel, R. A.., Storchi-Bergmann, Vale, T. B., McGregor, P. 2014a, MNRAS, 442, 656.
- Riffel, Storchi-Bergmann & Riffel (2014b) Riffel, R. A., Storchi-Bergmann, T., & Riffel, R., ApJL, 2014b, 780, 24.
- Riffel et al. (2014c) Riffel, R. A.. et al., 2014c, MNRAS, accepted.
- Riffel et al. (2011c) Riffel, R., Riffel, R. A.., Ferrari, F., Storchi-Bergmann, T., 2011. MNRAS, 416, 493.
- Riffel et al. (2013) Riffel, R., Rodríguez-Ardila, A., Aleman, I., Brotherton, M. S., Pastoriza, M. G., Bonatto, C., Dors, O. L., 2013, MNRAS, 430, 2002.
- Rodríguez-Ardila et al. (2004) Rodríguez-Ardila, A., Pastoriza, M. G., Viegas, S., Sigut, T. A. A., & Pradhan, A. K., 2004, A&A, 425, 457.
- Rodríguez-Ardila, Riffel & Pastoriza (2005) Rodríguez-Ardila, A., Riffel, R., & Pastoriza, M. G. 2005, MNRAS, 364, 1041.
- Rosario et al. (2010) Rosario, D. J., Whittle, M., Nelson, C. H., & Wilson, A. S., 2010, ApJ, 711, L94.
- Schartmann et al. (2010) Schartmann, M., Burkert, A., Krause, M., Camenzind, M., Meisenheimer, K., Davies, R. I., 2010
- Schmitt et al. (1997) Schmitt, H. R., Kinney, A. L., Storchi-Bergmann, T., & Antonucci, R. 1997, ApJ, 477, 623
- Schnorr-Müller al. (2011) Schnorr Ml̈ler, A., Storchi-Bergmann, T., Riffel, R. A., Ferrari, F., Steiner, J. E., Axon, D. J., Robinson, A., 2011, MNRAS, 413, 149.
- Schnorr-Müller al. (2014a) Schnorr-Müller, Allan; Storchi-Bergmann, T., Nagar, N. M., Lena, D., Riffel, R. A., Couto, G. S., 2014b, 2014a, MNRAS, 438, 3322.
- Schnorr-Müller al. (2014b) Schnorr-Müller, Allan; Storchi-Bergmann, T., Nagar, N. M., Robinson, A., Ferrari, F., MNRAS, 437, 1708.
- Schönel et al. (2014) Schonel Júnior, A. J., Riffel, R. A., Stochi-Bergmann, T., Winge, C., 2013, MNRAS, submitted
- Scoville et al. (1982) Scoville, N. Z., Hall, D. N. B., Kleinmann, S. G., & Ridgway, S. T. 1982, ApJ, 253, 136..
- Sellwood & Sánchez (2010) Sellwood, J. A., & Sáanchez, R. Z. 2010, MNRAS, 404, 1733
- Simpson et al. (1996) Simpson, C., Forbes, D. A., Baker, A. C., & Ward, M. J. 1996, MNRAS, 283, 777.
- Spekkens & Sellwood (2007) Spekkens, K., & Sellwood, J. A. 2007, ApJ, 664, 204
- Stoklasová et al. (2009) Stoklasová, I., Ferruit, P., Emsellem, E., Jungwiert, B., Pécontal, E., Sánchez, S. F., 2009, A&A, 500, 1287.
- Storchi-Bergmann et al. (1999) Storchi-Bergmann, T., Winge, C., Ward, M. J., Wilson, A. S., 1999, MNRAS, 304, 35.
- Storchi-Bergmann et al. (2007) Storchi-Bergmann, T., Dors Jr., O., Riffel, R. A., Fathi, K., Axon, D. J., & Robinson, A., 2007, ApJ, x, x.
- Storchi-Bergmann et al. (2009) Storchi-Bergmann, T., McGregor, P. Riffel,R. A.., Simões Lopes, R., Beck, T., Dopita, M., 2009, MNRAS, 394, 1148.
- Storchi-Bergmann et al. (2010) Storchi-Bergmann, T., Simões Lopes, R., McGregor, P. Riffel, R. A.., Beck, T., Martini, P., 2010, MNRAS, 402, 819.
- Storchi-Bergmann et al. (2012) Storchi-Bergmann, T., Riffel, R. A.., Riffel, R., Diniz, M. R., Borges Vale, T., McGregor, P. J., 2012, ApJ, 755, 87.
- Storchi-Bergmann (2014a) Storchi-Bergmann, T., 2014, BrJPh, 43, 383.
- Storchi-Bergmann (2014b) Storchi-Bergmann, T., 2014, IAU Symposium No. 309, ”Galaxies in 3D across the Universe”, B. L. Ziegler, F. Combes, H. Dannerbauer, M. Verdugo, Eds. (Cambridge: Cambridge Univ. Press)
- Su et al. (1996) Su, B. M., Muxlow, T. W. B., Pedlar, A. Holloway, A. J., Steffen, W., Kukula, M. J., & Mutel, R., L., 1996, MNRAS, 279, 1111.
- Ulvestad & Wilson (1984) Ulvestad, J., S., & Wilson, A. S., 1984, ApJ, 285, 439.
- Ulvestad & Wilson (1989) Ulvestad, J. S., & Wilson, A. S., 1989, ApJ, 343, 659.
- Winge, Riffel & Storchi-Bergamann (2009) Winge, C., Riffel, R. A.., Storchi-Bergmann, T., 2009, ApJS, 185, 186.
- Wilman, Edge & Juhnstone (2005) Wilman, R. J., Edge, A. C., & Juhnstone, R. M., 2005, MNRAS, 359, 755.
- Wilson & Keel (1989) Wilson, A. S., & Keel, W. C., 1989, AJ, 98, 1581.
- Whittle et al. (1986) Whittle, M., Haniff, C. A., Ward, M. J., Meurs, E. J. A., Pedlar, A., Unger, S. W., Axon, D. J., Harrison, B. A., 1986, MNRAS, 222, 189.
- Whittle & Wilson (2004) Whittle, M., & Wilson, A. S., 2004, AJ, 127, 606.
- Yuan (2007) Yuan, F. 2007, in ASP Conf. Ser. 373, The Central Engine of Active Galactic Nuclei, ed. L. C. Ho & J.-M. Wang (San Francisco: ASP), 95