11email: xswu@nao.cas.cn;gzhao@nao.cas.cn 22institutetext: University of the Chinese Academy of Sciences, 19A, Yuquan Road, Shijingshan District, Beijing 100049, China 33institutetext: Max-Planck-Institut für Extraterrestrische Physik, Giessenbachstrasse, D-85748 Garching, Germany
Palladium and silver abundances in stars with [Fe/H]
Palladium (Pd) and silver (Ag) are the key elements for probing the weak component in the rapid neutron-capture process (-process) of stellar nucleosynthesis. We performed a detailed analysis of the high-resolution and high signal-to-noise ratio near-UV spectra from the archive of HIRES on the Keck telescope, UVES on the VLT, and HDS on the Subaru Telescope, to determine the Pd and Ag abundances of 95 stars. This sample covers a wide metallicity range with [Fe/H] , and most of them are dwarfs. The plane-parallel LTE MAFAGS-OS model atmosphere was adopted, and the spectral synthesis method was used to derive the Pd and Ag abundances from Pd i 3404 Å and Ag i 3280/3382 Å lines. We found that both elements are enhanced in metal-poor stars, and their ratios to iron show flat trends at [Fe/H] . The abundance ratios of [Ag/H] and [Pd/H] are well correlated over the whole abundance range. This implies that Pd and Ag have similar formation mechanisms during the Galactic evolution.
Key Words.:
stars: abundances – stars: Population II – Galaxy: evolution1 Introduction
More than half a century ago, forerunners established the theoretical framework for exploring the nucleosynthesis mechanisms. The nuclides with are produced by neutron-capture process (Cameron 1957; Burbidge et al. 1957), including at least two different dominant processes – the rapid one and the slow one. The slow neutron-capture nucleosynthesis process (-process) accounts for the production of around half of the nuclear species beyond the iron-peak elements and takes place in a relatively low neutron density environment (Käppeler et al. 1989; Zhao & Magain 1990; Busso et al. 1999; Käppeler et al. 2011), whereas the rapid neutron-capture process (-process) is responsible for the other half and occurs in a high neutron density environment (Kratz et al. 2007; Sneden et al. 2008; Farouqi et al. 2009, 2010). Besides, the lighter element primary process (LEPP; Travaglio et al. 2004; Montes et al. 2007; Arcones & Montes 2011) and the -process (Arnould & Goriely 2003) are also thought to contribute to the overall stellar abundance patterns. As a result, the -process always arises in explosive environments that can offer enough dense neutrons, such as neutron star mergers (Freiburghaus et al. 1999; Rosswog et al. 1999; Goriely et al. 2005, 2011; Korobkin et al. 2012; Perego et al. 2014; Just et al. 2015), neutrino-driven wind (Woosley et al. 1997; Arcones & Montes 2011; Wanajo & Janka 2012), jets in core-collapse supernova (Cameron 2001), massive core-collapse supernova (Wasserburg & Qian 2000; Argast et al. 2004), gamma-ray bursts (McLaughlin & Surman 2005), and low-mass supernova explosion from the collapse in O-Ne-Mg cores (Wanajo et al. 2003).
In contrast to this, the -process happens in relatively peaceful environments. Much research has shown that the -process can be classified into two subprocesses. The main -process, which happens in asymptotic giant branch (AGB) stars with masses between 1.3 and 8 , creates the heavier elements, such as Ba (e.g., Straniero et al. 1997; Gallino et al. 1998; Busso et al. 1999; Karakas et al. 2009; Cristallo et al. 2009; Bisterzo et al. 2010), while the weak -process is associated with massive stars with initial mass , and it creates the lighter elements, such as Sr (Pignatari et al. 2010, 2013; Frischknecht et al. 2012). In addition, a third sub--process, the “strong” component, was proposed to explain about 50% of 208Pb in the Sun (Clayton & Rassbach 1967) but was later re-interpreted as the outcome of the main -process at low metallicity (Gallino et al. 1998; Travaglio et al. 2001).
Although several scenarios may be responsible for the -process, their sites remain unclear. Observations suggest that the -process can be divided into two distinct components, namely the main -process and the weak -process (e.g., Burris et al. 2000; François et al. 2007; Hansen & Primas 2011). Among the elements with 38 Z 50, Pd and Ag are considered as the keys to an investigation of the weak -process. Crawford et al. (1998) reported the first detection of Ag abundances in four metal-poor stars and found that dex without any trend with [Fe/H]. Johnson & Bolte (2002) determined Pd and Ag abundances for three metal-poor stars and upper limits of Pd for another nine stars, but their correlation is not well established owing to the very small number of samples. Other studies gave Pd or Ag abundances for a few isolated metal-poor stars, e.g., CS 31082-001 (Hill et al. 2002), CS 22892-052 (Sneden et al. 2003), and HD 122563 (Honda et al. 2006).
It was not until Hansen & Primas (2011) and Hansen et al. (2012) that Pd and Ag abundances were analyzed for a large sample of stars. These authors derived Pd and Ag abundances for 34 dwarfs and 23 giants. The [Pd/Fe] and [Ag/Fe] show flat trends with metallicity and were compared with several tracer elements such as Sr, Y, Zr, Ba, and Eu. The comparisons have ruled out the weak/main -process or main -process as the main formation channels of Pd and Ag.
To study the formation processes of Pd and Ag further in the Galactic chemical evolution history, we analyzed the archive near-UV spectra for a large sample of stars, from three 8-10m class telescopes. These samples cover a wide metallicity range ( [Fe/H] ) and represent different Galactic populations (thin disk, thick disk, halo). This paper is organized as follows. Section 2 describes the observations and data reduction; section 3 explains the atmosphere models, stellar parameters, and atomic data; section 4 gives the chemical abundance and error estimations; and the results are discussed in section 5. In the last section, we summarize our work and present conclusions.
2 Observation and data reduction
We searched the archive data of the High Resolution Echelle Spectrometer (HIRES; Vogt et al. 1994) attached to the Keck I Telescope to find the high-resolution ultraviolet spectral observations covering the wavelengths of , where Pd i and Ag i lines might exist. We found 134 stars, of which spectra with high signal-to-noise ratios (S/N) are available from Keck I/HIRES. Most of these spectra were taken in the same project as the one that aims to determine beryllium abundances with the Be resonance doublet at (Boesgaard et al. 2011). The typical S/N is above 100 for the Ag i region and above 120 for the Pd i region. In addition, these spectra have been taken with the same instrumental configuration, and the wavelength resolving power () is . The data reduction was performed using the IRAF111IRAF is distributed by National Optical Astronomy Observatories, operated by the Association of Universities for Research in Astronomy, Inc., under contract with the National Science Foundation, USA. ECHELLE software package, following the standard procedure including bias correction, flat fielding, background subtraction, and wavelength calibration. Whenever possible, one-dimensional spectra of several continuous frames for the same star were co-added to obtain a higher S/N and to remove the cosmic-ray hints. The continuum were normalized with polynomials, and the radial velocities were corrected by finding the maximum of their cross-correlation functions with the solar spectra. Of the 134 stars, about half (60 stars) have detectable Pd i line at or Ag i resonance doublet at , all of which are main-sequence or slightly-evolved stars, with effective temperatures () ranging from 5000 K to 6350 K and metallicities ranging from [Fe/H] to 0.05.
To enlarge our sample, we searched the archive data of the High Dispersion Spectrograph further (HDS; Noguchi et al. 2002), which is mounted on the 8.2m Subaru Telescope. We selected seven stars with high S/Ns and clear Pd i or Ag i lines in the same wavelength region. All of the stars were observed with StdUb setting and the resolving power is 50,000, comparable to that of HIRES sample. We reduced their spectra in the same manner as we used with Keck/HIRES data. This subsample covers a wide metallicity range ( [Fe/H] ) and contains two metal-poor giants (HD 6268 and HD 110184).
In addition, we selected high S/N spectra of 28 stars taken with the Ultraviolet and Visual Echelle Spectrograph (UVES; Dekker et al. 2000) at ESO VLT 8.2m Kueyen telescope. 25 of them were obtained from the ESO Science Archive, and the remaining three were taken from the UVES-POP survey (Bagnulo et al. 2003). This subsample was analyzed in previous research on Be abundances (Tan et al. 2009), ensuring a large overlap with the dwarf sample of Hansen & Primas (2011) and Hansen et al. (2012), which enables us to make a direct comparison of our results with the previous studies. These spectra were reduced using the ESO MIDAS package222http://www.eso.org/sci/software/esomidas/ of version from February 2008 in a similar manner to the HIRES and HDS procedures. The resolving power is 48 000 around 3300 Å.
3 Stellar parameters
3.1 Effective temperatures
Many of our sample stars have been studied well in previous research (e.g., Chen et al. (2000); Reddy et al. (2003); Boesgaard & Novicki (2006); Tan et al. (2009); Boesgaard et al. (2011), but each uses a part of our entire sample. Directly mixing the stellar parameters from the literature will cause non-negligible biases because these authors adopted different approaches to deriving atmospheric parameters (, , [Fe/H], and ). For instance, Chen et al. (2000) and Reddy et al. (2003) both determined from the narrow-band photometric and given by Hauck & Mermilliod (1998) with the same color- relation (i.e., Alonso et al. 1996) and from the triangular parallaxes. While the and given by Boesgaard & Novicki (2006) were derived using excitation equilibrium of Fe i lines and an ionization balance between Fe i and Fe ii.
Some research has shown systematic deviations between these two methods (e.g. Nissen 2013), and the reason can be attributed to the non-LTE effect of Fe i lines (e.g., Mashonkina et al. 2011; Korn et al. 2003). Recent study by Lind et al. (2012) has shown that the depatures from LTE of Fe i lines result in underestimations by up to 0.4 dex of spectroscopic for metal-poor stars (see also Bensby et al. 2014). Considering many of our samples are nearby stars within 100 pc and therefore have precise Hipparcos parallaxes with relative uncertainties less than 10%, we determined the stellar parameters with the former approach.
For 28 stars that we share with Chen et al. (2000, 2001) or Reddy et al. (2003), we adopted the parameters determined by these studies, in which the narrow band photometric colors and from the uvby catalog333http://cdsarc.u-strasbg.fr/viz-bin/Cat?II/215 (Hauck & Mermilliod 1998) were used to derive with the calibration of Alonso et al. (1996), and were based on the Hipparcos parallaxes. A comparison of 23 common stars between Chen et al. (2000) and Reddy et al. (2003) shows excellent agreement in the stellar parameters between these two datasets, with the mean differences of only K, dex, and dex on , , and [Fe/H], respectively.
To minimize the systematic bias, for stars not included in Chen et al. (2000) or Reddy et al. (2003), we preferably adopted the photometric colors and from Hauck & Mermilliod (1998) to derive their with the same calibration relation of Alonso et al. (1996). This made up another subset of 36 stars. For the remaining stars in our sample, broad-band colors were used to obtain with the calibration relation of Alonso et al. (1996). The magnitudes were taken from the Hipparcos Catalogue, and from the Two Micron All-Sky Survey (2MASS) were converted to magnitudes in TCS system according to Ramírez & Meléndez (2004). Reddening due to interstellar extinction is only considered for stars with distances over 100 pc, and the values were interpolated from the dust map of Schlegel et al. (1998) based on COBE and IRAS satellites. Previous investigations (e.g., Arce & Goodman 1999) have shown that the given by this map is slightly overestimated. We therefore reduced the values according to the formula given by Bonifacio et al. (2000) if and then further by a factor of , where is the distance and is the Galactic latitude of a given star.
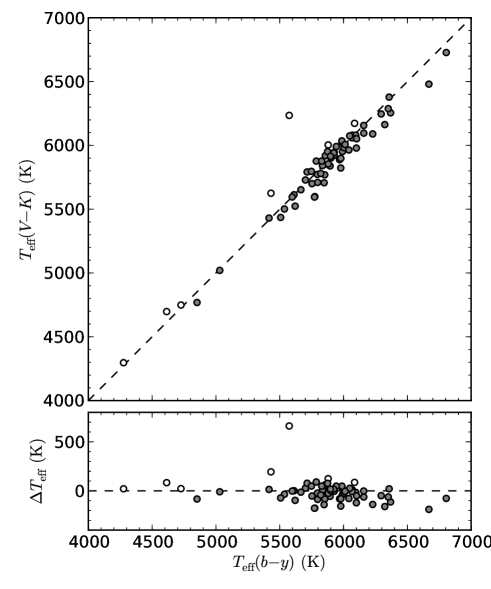
Figure 1 compares the derived from and for 66 sample stars with the empirical calibration relations of Alonso et al. (1996). We found satisfactory agreement in the temperatures from these two colors. The mean difference is K, and it drops to K after excluding the outlier HD 24289, which is probably affected by the large uncertainty (37%) on its parallax distance and a relative high reddening value () toward this direction. The typical errors of (0.003) and (0.007) in Hauck & Mermilliod (1998) lead to the uncertainties of K for our sample stars, and the errors of 0.10 dex on [Fe/H] translate into only 5 K on . While for stars with derived with , the typical uncertainties on the color indices and the transformations of from 2MASS to TCS systems are around 0.036 and 0.035 mag, respectively. Therefore we estimated the uncertainties to be 80 K, combining with the contributions of [Fe/H] dex. Although the difficulty estimating accurate interstellar reddenings puts more uncertainties on , this is not the dominant factor for the majority of our samples.
3.2 Surface gravities
The surface gravities were determined from the fundamental equation
| (1) |
where denotes the stellar mass, and is the absolute bolometric magnitudes. We determined the masses by interpolating the Y2 evolutionary tracks (Yi et al. 2003) with given metal content () and by finding the track that passed through the corresponding points of the sample star on the (, ) plane. The Hipparcos parallaxes (van Leeuwen 2007) were essential for determining the absolute magnitude and bolometric correction with the relation of Alonso et al. (1995). According to Formula 1, a relative 15% uncertainty for parallax will cause a uncertainty of 0.13 dex and will contribute most to the total error of the surface gravity. By considering the uncertainties on stellar masses and BC (see discussion in Tan et al. 2009), we estimated our uncertainties to be 0.15 dex. Considering that most of our sample stars have parallax uncertainties less than 10%, this is a conservative estimation.
However, this method is not feasible for ten of our sample stars without parallaxes. Alternatively, we adopted the surface gravities by forcing the Fe i and Fe ii lines that give the same mean iron abundances. This was done for eight stars (G 10-4, G 21-22, G 24-25, G 88-10, G 113-22, G 126-36, G 130-65, and G 191-55), and their uncertainties were estimated by adjusting by an amount that led to an offset of [Fe/H] = 0.1 dex between the mean Fe i and Fe ii abundances. The average Fe i abundance do not change significantly with the variations in within dex, while the abundances derived from Fe ii lines are more sensitive. We estimated the uncertainties of to be dex for stars with surface gravities determined with the ionization balance method. There are fewer in subsample than in the total sample, so the errors of Pd or Ag abundances caused by the deviations of between the above two methods do not significantly bias our results.
3.3 Iron abundances and microturbulences
For the stars where we determined the parameters, the iron abundances [Fe/H] were calculated by measuring the equivalent widths () of 20 selected Fe ii lines, and the microturbulences () were determined by canceling out any trend in their individual abundances with the equivalent widths. The calibration relation of given by Alonso et al. (1996) is the function of both [Fe/H] and color, therefore the determination of , , [Fe/H], and is an iterative procedure. We searched the literature and took the [Fe/H] values given by Boesgaard & Novicki (2006), Boesgaard et al. (2011), Simmerer et al. (2004), Gehren et al. (2006), Honda et al. (2006) and Ishigaki et al. (2012) as the initial values. We found the parameters converged to within 3 K and [Fe/H] within 0.01 dex after two to three iterations for most of our sample stars. The uncertainties of [Fe/H] are estimated by changing the by dex and combining the uncertainties of 0.08 dex caused by the line-by-line scatter. In summary, the typical uncertainties for the temperatures, surface gravities, iron abundances, and microturbulence were estimated to 80 K, 0.15 dex, 0.10 dex, and 0.2 km s-1, respectively.
3.4 Model atmospheres
We adopted the one-dimensional, line-blanketed, and local thermodynamic equilibrium MAFAGS-OS atmospheric model (Grupp 2004; Grupp et al. 2009) for sample stars and assumed that the mixing-length parameter , where the Canuto & Mazzitelli (1991, 1992) convection theory was used. The iron opacity was calculated based on the improved solar iron abundance of Lodders et al. (2009), and the opacities for metal-poor stars with [Fe/H] were calculated using -element abundances enhanced by 0.4 dex.
3.5 Comparison with literatures
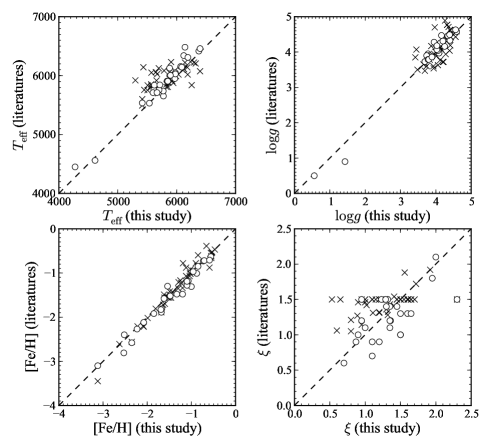
Figure 2 compared the atmospheric parameters (, , [Fe/H] and ) of common stars with Hansen et al. (2012) and Boesgaard et al. (2011). Hansen et al. (2012) adopted a similar method to our study to determine the stellar parameters. For example, their were derived with and Alonso et al. (1996) relations and were based on Hipparcos parallaxes. The mean differences (Hansen et al. 2012 this work) are K, , , and km s-1 for 25 common stars. Despite most of our parameters show good agreements with those of Hansen et al. (2012), temperatures, and/or iron abundances for a few stars differ up to 200 K and 0.3 dex with theirs, which will cause non-negligible influences on Pd and Ag abundances. These include G 20-24 ( K), HD 103723 ( K), CD 18140 ( K), HD 132475 ( K), HD 111980 ( dex), and HD 106038 ( dex).
We also compared the parameters of 44 shared stars with Boesgaard et al. (2011) in Fig. 2. These authors derived their stellar parameters with the excitation equilibrium and ionization balance method. The mean differences (Boesgaard et al. 2011 this work) are K, , , and km s-1, which show larger scatters than those of Hansen et al. (2012). This is not suprising because the excitation equilibrium and ionization balance method relies on accurate Fe i abundances and is thought to be affected by non-LTE effects as mentioned above.
4 Stellar kinetics
We derived the Galactic motion velocities (, , )444Here is defined to be positive towards Galactic anticenter. of the sample stars with the method given by Johnson & Soderblom (1987). The radial velocities of HDS and HIRES spectra were measured by finding the maximum of the cross-correlation functions with the high-resolution solar atlas (Kurucz 2005), and corrected to heliocentric velocities with the rvcorrect task of the IRAF astutil package. The uncertainties of radial velocities were estimated by quadratically summing the drifts of ThAr line positions during an observing night, the R.M.S. of ThAr line centroid fitting, and the R.M.S. of measured radial velocities for every echelle order. The typical radial velocity uncertainties for HDS spectra are estimated to be around 0.5 km s-1 and larger (2 km s-1) for HIRES spectra, which are dominated by larger drifts (4 pixels) of ThAr lines in one night. For stars with UVES spectra, we adopted the values listed in the SIMBAD database directly. The parallax and proper motion data were taken from the new reduction of Hipparcos Catalogue (van Leeuwen 2007) or the Tycho-2 Catalogue (Høg et al. 2000). For sample stars without Hipparcos parallaxes, we inversed Formula 1 with the spectroscopic and that were derived in Sect. 3, together with the basic relation to find their distances.
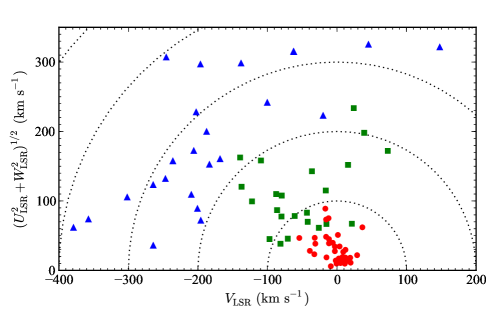
We adopted the solar motion of ) km s-1 (Dehnen & Binney 1998) to correct the components of the sample stars to the local standard of rest (LSR). This allowed us to calculate the relative probabilities for the thick-disk-to-thin-disk (TD/D) and thick-disk-to-halo (TD/H) memberships of each star with the pure kinematic method proposed by Bensby et al. (2003). We emphasize that it is hard to clarify whether a star in the solar neighborhood belongs to the thin or the thick disk, and some other studies used chemical criteria such as [Fe/H] and [/Fe] (e.g., Fuhrmann 1998; Navarro et al. 2011). However, we simply divided our sample stars into three groups, thin disk, thick disk, and halo stars, according to whichever population had the highest probability based on the kinematic properties. We manually assigned four stars (HD 122563, HD 84937, HD 6268, and G 88-10) with [Fe/H] that are classified as thin disk stars by the kinetic method as halo stars. Previous studies have shown that all of them are enhanced in magnesium with [Mg/Fe] (e.g., Gratton et al. 2003; Honda et al. 2004; Boesgaard et al. 2011). Figure 3 shows the Toomre diagram of our sample stars, and the radial velocities, prallaxes, proper motions, and Galactic velocities are listed in the online Table LABEL:tab-kinetics.
| Star | Population | |||||||
|---|---|---|---|---|---|---|---|---|
| (km s-1) | (mas) | (mas/yr) | (mas/yr) | (km s-1) | (km s-1) | (km s-1) | ||
| CD 30 18140 | 16.8 | 71.50 | 195.90 | 11.20 | halo | |||
| CD 57 1633 | 260.7 | 306.30 | 245.60 | 24.90 | halo | |||
| G 13-9 | 57.9 | 93.10 | 264.40 | 81.40 | halo | |||
| G 20-24 | 34.4 | 160.30 | 206.00 | 64.30 | halo | |||
| G 183-11 | 242.7 | 53.50 | 379.00 | 31.60 | halo | |||
| HD 61421 | 3.2 | 12.60 | 6.97 | 6.43 | thin | |||
| HD 76932 | 119.4 | 37.70 | 86.20 | 78.20 | thick | |||
| HD 84937 | 15.0 | 18.14 | 11.93 | 3.52 | halo | |||
| HD 97320 | 53.2 | 83.50 | 16.80 | 30.50 | thin | |||
| HD 97916 | 61.1 | 117.70 | 15.90 | 96.10 | thick | |||
| HD 103723 | 168.3 | 65.80 | 200.70 | 60.50 | halo | |||
| HD 106038 | 99.4 | 25.20 | 264.30 | 26.20 | halo | |||
| HD 111980 | 155.0 | 277.90 | 196.40 | 105.50 | halo | |||
| HD 113679 | 157.8 | 105.80 | 301.70 | 0.10 | halo | |||
| HD 121004 | 245.3 | 74.90 | 246.80 | 109.20 | halo | |||
| HD 122196 | 26.4 | 160.90 | 139.40 | 23.50 | thick | |||
| HD 122563 | 26.6 | 0.84 | 6.91 | 17.04 | halo | |||
| HD 126681 | 45.6 | 12.30 | 42.20 | 68.90 | thick | |||
| HD 132475 | 176.5 | 47.00 | 357.50 | 57.40 | halo | |||
| HD 140283 | 169.0 | 30.00 | 147.80 | 320.50 | halo | |||
| HD 160617 | 100.4 | 68.20 | 209.50 | 85.70 | halo | |||
| HD 166913 | 48.6 | 35.00 | 43.30 | 75.40 | thick | |||
| HD 175179 | 21.7 | 117.70 | 137.30 | 25.60 | thick | |||
| HD 188510 | 192.5 | 141.10 | 109.40 | 71.60 | thick | |||
| HD 189558 | 12.9 | 85.90 | 122.20 | 50.10 | thick | |||
| HD 195633 | 45.8 | 48.30 | 15.70 | 3.50 | thin | |||
| HD 205650 | 105.5 | 106.40 | 79.50 | 17.30 | thick | |||
| HD 298986 | 198.2 | 250.10 | 138.00 | 163.30 | halo | |||
| G 21-22 | 60.1 | a𝑎aa𝑎aStars with distances derived with spectroscopic , and proper motions were taken from the Tycho-2 Catalogue (see section 4). | 61.27 | 36.47 | 10.06 | thin | ||
| HD 6268 | 40.5 | 9.03 | 3.70 | 33.31 | halo | |||
| HD 94028 | 66.1 | 13.82 | 15.17 | 65.43 | thick | |||
| HD 110184 | 140.2 | 28.54 | 36.00 | 139.90 | thick | |||
| HD 198390 | 5.0 | 12.44 | 9.32 | 5.52 | thin | |||
| HD 201891 | 43.9 | 6.18 | 32.64 | 22.44 | thin | |||
| HD 220242 | 7.1 | 9.07 | 11.23 | 3.36 | thin | |||
| BD +04 4551 | 117.4 | 56.30 | 79.90 | 53.47 | thick | |||
| BD +07 4841 | 234.3 | 48.69 | 168.21 | 153.37 | halo | |||
| BD +17 4708 | 286.3 | 42.31 | 236.09 | 152.09 | halo | |||
| BD +19 1185 | 190.8 | 197.74 | 39.09 | 11.84 | thick | |||
| BD +21 607 | 339.9 | 306.31 | 45.24 | 110.73 | halo | |||
| BD +22 396 | 23.5 | 28.02 | 3.10 | 19.81 | thin | |||
| BD +37 1458 | 242.8 | 228.55 | 24.11 | 48.54 | thick | |||
| BD +51 1696 | 65.3 | 14.61 | 21.41 | 65.55 | thick | |||
| BD 01 306 | 28.1 | 4.80 | 9.23 | 16.39 | thin | |||
| BD 17 484 | 235.3 | 87.33 | 19.99 | 205.64 | halo | |||
| G 10-4 | 63.7 | 1.86 | 26.16 | 61.33 | thick | |||
| G 24-25 | 311.9 | a𝑎aa𝑎aStars with distances derived with spectroscopic , and proper motions were taken from the Tycho-2 Catalogue (see section 4). | 186.04 | 202.55 | 132.43 | halo | ||
| G 63-46 | 25.5 | 2.40 | 7.48 | 17.07 | thin | |||
| G 74-5 | 27.4 | 8.98 | 19.58 | 6.61 | thin | |||
| G 88-10 | 84.1 | 69.35 | 12.15 | 28.94 | halo | |||
| G 113-22 | 56.2 | a𝑎aa𝑎aStars with distances derived with spectroscopic , and proper motions were taken from the Tycho-2 Catalogue (see section 4). | 28.75 | 31.19 | 25.53 | thin | ||
| G 126-36 | 87.1 | a𝑎aa𝑎aStars with distances derived with spectroscopic , and proper motions were taken from the Tycho-2 Catalogue (see section 4). | 10.61 | 70.81 | 44.40 | thick | ||
| G 130-65 | 270.1 | a𝑎aa𝑎aStars with distances derived with spectroscopic , and proper motions were taken from the Tycho-2 Catalogue (see section 4). | 97.86 | 187.56 | 174.71 | halo | ||
| G 153-21 | 63.4 | 43.25 | 1.28 | 27.15 | thin | |||
| G 180-24 | 151.4 | 29.08 | 87.48 | 106.00 | thick | |||
| G 188-22 | 93.2 | 5.78 | 81.32 | 38.00 | thick | |||
| G 191-55 | 257.2 | a𝑎aa𝑎aStars with distances derived with spectroscopic , and proper motions were taken from the Tycho-2 Catalogue (see section 4). | 233.16 | 100.33 | 65.16 | halo | ||
| G 192-43 | 190.5 | 152.53 | 73.06 | 79.79 | thick | |||
| HD 14877 | 33.4 | 13.52 | 18.97 | 12.26 | thin | |||
| HD 22521 | 37.4 | 42.85 | 11.52 | 13.88 | thin | |||
| HD 24289 | 129.1 | 85.10 | 16.18 | 77.48 | thick | |||
| HD 24421 | 32.8 | 38.17 | 11.58 | 7.76 | thin | |||
| HD 25173 | 34.8 | 13.46 | 28.94 | 17.30 | thin | |||
| HD 26421 | 65.4 | 70.95 | 15.69 | 18.44 | thin | |||
| HD 28620 | 21.3 | 10.34 | 10.95 | 4.39 | thin | |||
| HD 30743 | 2.8 | 12.07 | 6.52 | 8.72 | thin | |||
| HD 31128 | 111.9 | 50.22 | 60.85 | 60.11 | thick | |||
| HD 33632 | 0.6 | 10.67 | 5.12 | 7.16 | thin | |||
| HD 54717 | 3.6 | 6.57 | 4.99 | 8.28 | thin | |||
| HD 63333 | 10.2 | 19.01 | 7.87 | 3.15 | thin | |||
| HD 68284 | 63.8 | 37.07 | 32.05 | 28.81 | thin | |||
| HD 80218 | 12.0 | 17.77 | 10.12 | 0.67 | thin | |||
| HD 89125 | 38.5 | 9.01 | 6.09 | 38.71 | thin | |||
| HD 91638 | 4.2 | 11.01 | 8.11 | 4.14 | thin | |||
| HD 91889 | 5.4 | 10.89 | 9.34 | 3.75 | thin | |||
| HD 94835 | 9.6 | 6.61 | 2.53 | 15.79 | thin | |||
| HD 100180 | 3.8 | 10.63 | 6.52 | 3.63 | thin | |||
| HD 104056 | 21.8 | 8.07 | 17.36 | 10.87 | thin | |||
| HD 109303 | 24.0 | 3.99 | 12.18 | 29.41 | thin | |||
| HD 118244 | 17.0 | 6.76 | 4.66 | 9.54 | thin | |||
| HD 134439 | 310.2 | 255.28 | 62.10 | 184.85 | halo | |||
| HD 134440 | 310.9 | 255.91 | 62.56 | 184.94 | halo | |||
| HD 186379 | 6.7 | 6.71 | 0.65 | 7.07 | thin | |||
| HD 194598 | 246.4 | 133.00 | 183.50 | 75.55 | halo | |||
| HD 200580 | 6.2 | 6.72 | 0.80 | 10.06 | thin | |||
| HD 202884 | 0.2 | 9.86 | 5.03 | 7.27 | thin | |||
| HD 204712 | 25.2 | 0.62 | 15.13 | 18.74 | thin | |||
| HD 209320 | 49.6 | 2.17 | 39.08 | 28.09 | thin | |||
| HD 209858 | 1.8 | 9.84 | 3.57 | 7.80 | thin | |||
| HD 215442 | 7.3 | 11.67 | 1.86 | 8.02 | thin | |||
| HD 241253 | 15.0 | 23.69 | 8.96 | 12.33 | thin | |||
| HD 247297 | 38.8 | 27.56 | 3.10 | 2.16 | thin | |||
| HD 345957 | 115.0 | 41.53 | 97.09 | 17.70 | thick | |||
| Ross 390 | 80.9 | 44.55 | 54.20 | 13.96 | thin | |||
| Ross 797 | 22.6 | 6.00 | 8.91 | 0.40 | thin |
| Star | Instrument | [Fe/H] | method | [Pd/Fe] | [Ag/Fe] | [Ag/Fe] | [Ag/Fe] | |||
|---|---|---|---|---|---|---|---|---|---|---|
| (K) | (km s-1) | (3280 Å) | (3382 Å) | mean | ||||||
| CD 30 18140a𝑎aa𝑎aStars with lower spectral S/N and therefore the abundances are more uncertain than the average. | VLT/UVES | 6120 | 4.00 | 1.85 | 1.50 | 0.28 | 0.74 | 0.74 | 0.74 | |
| CD 57 1633 | VLT/UVES | 5836 | 4.13 | 0.88 | 1.35 | 0.01 | 0.09 | 0.03 | 0.06 | |
| G 13-9 | VLT/UVES | 6376 | 3.78 | 2.23 | 1.35 | 0.81 | 1.23 | 1.23 | ||
| G 20-24 | VLT/UVES | 6141 | 4.16 | 1.68 | 0.95 | 0.24 | ||||
| G 183-11 | VLT/UVES | 6190 | 4.09 | 2.08 | 1.50 | 0.40 | 0.64 | 0.28 | 0.28 | |
| HD 61421 | VLT/UVESc𝑐cc𝑐cSpectra taken from the UVES-POP survey. | 6668 | 3.88 | 0.03 | 1.95 | 0.06 | 0.41 | 0.19 | 0.19 | |
| HD 76932 | VLT/UVES | 5849 | 4.05 | 0.96 | 1.60 | 0.13 | 0.25 | 0.23 | 0.24 | |
| HD 84937 | VLT/UVESc𝑐cc𝑐cSpectra taken from the UVES-POP survey. | 6323 | 4.02 | 2.09 | 1.70 | 0.45 | 0.74 | 0.84 | 0.74 | |
| HD 97320 | VLT/UVES | 5991 | 4.14 | 1.11 | 1.35 | 0.21 | 0.33 | 0.18 | 0.26 | |
| HD 97916 | VLT/UVES | 6445 | 4.16 | 0.88 | 1.50 | 111111Stellar parameters taken from Chen et al. (2000). | 0.13 | |||
| HD 103723 | VLT/UVES | 5880 | 3.95 | 0.85 | 1.32 | 0.05 | 0.08 | 0.08 | 0.08 | |
| HD 106038 | VLT/UVES | 5969 | 4.40 | 1.20 | 1.00 | 0.09 | 0.19 | 0.15 | 0.17 | |
| HD 111980 | VLT/UVES | 5775 | 3.80 | 1.00 | 0.95 | 0.04 | 0.11 | 0.17 | 0.14 | |
| HD 113679 | VLT/UVES | 5612 | 4.06 | 0.56 | 1.10 | 0.10 | 0.06 | 0.12 | 0.03 | |
| HD 121004 | VLT/UVES | 5598 | 4.34 | 0.73 | 1.10 | 0.08 | 0.11 | 0.05 | 0.08 | |
| HD 122196 | VLT/UVES | 5978 | 3.85 | 1.67 | 1.36 | 0.15 | 0.62 | 0.32 | 0.32 | |
| HD 122563 | VLT/UVESc𝑐cc𝑐cSpectra taken from the UVES-POP survey. | 4614 | 1.43 | 2.53 | 1.95 | 0.28 | 0.20 | 0.20 | 0.20 | |
| HD 126681 | VLT/UVES | 5537 | 4.59 | 1.10 | 0.70 | 0.33 | 0.26 | 0.14 | 0.20 | |
| HD 132475 | VLT/UVES | 5621 | 3.74 | 1.48 | 1.23 | 0.18 | 0.07 | 0.25 | 0.07 | |
| HD 140283 | VLT/UVES | 5772 | 3.69 | 2.35 | 1.65 | 0.45 | 0.64 | 0.84 | 0.64 | |
| HD 160617 | VLT/UVES | 5979 | 3.78 | 1.69 | 1.50 | 0.34 | 0.37 | 0.37 | ||
| HD 166913 | VLT/UVES | 6068 | 4.03 | 1.54 | 1.29 | 0.29 | 0.35 | 0.38 | 0.35 | |
| HD 175179 | VLT/UVES | 5701 | 4.25 | 0.71 | 1.20 | 0.00 | 0.15 | 0.15 | 0.15 | |
| HD 188510 | VLT/UVES | 5416 | 4.56 | 1.62 | 0.90 | 0.25 | 0.24 | 0.30 | 0.27 | |
| HD 189558 | VLT/UVES | 5666 | 3.80 | 1.07 | 1.35 | 0.30 | 0.23 | 0.22 | 0.22 | |
| HD 195633 | VLT/UVES | 5894 | 3.89 | 0.59 | 1.45 | 0.29 | 0.05 | 0.06 | 0.06 | |
| HD 205650 | VLT/UVES | 5714 | 4.39 | 1.10 | 0.87 | 0.04 | 0.08 | 0.05 | 0.02 | |
| HD 298986 | VLT/UVES | 6086 | 4.03 | 1.33 | 1.30 | 0.22 | 0.33 | 0.33 | 0.33 | |
| G 21-22 | Subaru/HDS | 5657 | 4.46 | 0.98 | 1.35 | 0.10 | 0.14 | 0.10 | 0.02 | |
| HD 6268 | Subaru/HDS | 4726 | 1.14 | 2.63 | 2.05 | 0.34 | 0.57 | 0.64 | 0.57 | |
| HD 94028 | Subaru/HDS | 5926 | 4.23 | 1.54 | 1.50 | 0.24 | 0.29 | 0.28 | 0.28 | |
| HD 110184 | Subaru/HDS | 4275 | 0.56 | 2.52 | 2.00 | 0.23 | 0.45 | 0.66 | 0.45 | |
| HD 198390 | Subaru/HDS | 6339 | 4.20 | 0.31 | 1.92 | 111111Stellar parameters taken from Chen et al. (2000). | 0.00 | 0.26 | 0.16 | 0.21 |
| HD 201891 | Subaru/HDS | 5827 | 4.43 | 1.04 | 1.55 | 111111Stellar parameters taken from Chen et al. (2000). | 0.05 | 0.04 | 0.01 | 0.02 |
| HD 220242 | Subaru/HDS | 6804 | 4.00 | 0.02 | 2.50 | 0.08 | 0.22 | 0.29 | 0.22 | |
| BD +04 4551b𝑏bb𝑏bStars in known binary systems. | Keck/HIRES | 5990 | 3.85 | 1.43 | 1.41 | 0.58 | 0.91 | 0.95 | 0.93 | |
| BD +07 4841 | Keck/HIRES | 6187 | 3.93 | 1.50 | 1.65 | 0.79 | 0.67 | 0.68 | 0.68 | |
| BD +17 4708a𝑎aa𝑎aStars with lower spectral S/N and therefore the abundances are more uncertain than the average. | Keck/HIRES | 5938 | 3.94 | 1.60 | 1.30 | 0.33 | 0.48 | 0.48 | ||
| BD +19 1185 | Keck/HIRES | 5507 | 4.41 | 1.02 | 1.00 | 0.05 | 0.12 | 0.20 | 0.16 | |
| BD +21 607a𝑎aa𝑎aStars with lower spectral S/N and therefore the abundances are more uncertain than the average. | Keck/HIRES | 6100 | 4.10 | 1.64 | 1.45 | 0.35 | 0.25 | 0.29 | 0.25 | |
| BD +22 396 | Keck/HIRES | 5571 | 4.26 | 1.12 | 0.80 | 0.05 | 0.00 | 0.15 | 0.08 | |
| BD +37 1458 | Keck/HIRES | 5414 | 3.42 | 1.99 | 1.10 | 0.28 | 0.17 | 0.17 | 0.17 | |
| BD +51 1696 | Keck/HIRES | 5567 | 4.41 | 1.29 | 0.65 | 0.28 | 0.23 | 0.22 | 0.22 | |
| BD 01 306 | Keck/HIRES | 5646 | 4.32 | 0.90 | 1.20 | 0.10 | 0.04 | 0.04 | 0.00 | |
| BD 17 484 | Keck/HIRES | 6125 | 4.06 | 1.54 | 1.20 | 0.48 | 0.36 | 0.38 | 0.36 | |
| G 10-4 | Keck/HIRES | 4974 | 4.50 | 2.48 | 1.49 | 0.32 | 0.36 | 0.25 | 0.25 | |
| G 24-25 | Keck/HIRES | 5505 | 3.69 | 1.61 | 1.35 | 0.30 | 0.24 | 0.44 | 0.24 | |
| G 63-46 | Keck/HIRES | 5696 | 3.97 | 0.85 | 1.00 | 0.12 | 0.14 | 0.04 | 0.09 | |
| G 74-5 | Keck/HIRES | 5669 | 4.32 | 0.87 | 0.53 | 0.03 | 0.02 | 0.10 | 0.04 | |
| G 88-10b𝑏bb𝑏bStars in known binary systems. | Keck/HIRES | 5877 | 4.00 | 2.63 | 1.60 | 1.50 | 1.74 | 1.74 | ||
| G 113-22 | Keck/HIRES | 5565 | 3.95 | 1.03 | 1.10 | 0.18 | 0.06 | 0.04 | 0.05 | |
| G 126-36 | Keck/HIRES | 5500 | 4.50 | 1.06 | 0.80 | 0.40 | 0.27 | 0.12 | 0.20 | |
| G 130-65 | Keck/HIRES | 6031 | 3.65 | 2.22 | 1.41 | 0.45 | ||||
| G 153-21 | Keck/HIRES | 5435 | 4.44 | 0.66 | 1.61 | 0.25 | 0.14 | 0.35 | 0.24 | |
| G 180-24 | Keck/HIRES | 5959 | 4.12 | 1.42 | 1.20 | 0.23 | 0.43 | 0.43 | ||
| G 188-22 | Keck/HIRES | 5896 | 4.22 | 1.30 | 1.11 | 0.24 | 0.18 | 0.18 | ||
| G 191-55 | Keck/HIRES | 5570 | 4.11 | 1.81 | 0.60 | 0.15 | 0.11 | 0.11 | 0.11 | |
| G 192-43 | Keck/HIRES | 6181 | 3.83 | 1.49 | 1.32 | 0.39 | 0.62 | 0.62 | 0.62 | |
| HD 14877 | Keck/HIRES | 5971 | 4.03 | 0.42 | 1.57 | 333333Stellar parameters taken from Reddy et al. (2003). | 0.08 | 0.08 | 0.08 | 0.08 |
| HD 22521 | Keck/HIRES | 5783 | 3.96 | 0.25 | 1.55 | 333333Stellar parameters taken from Reddy et al. (2003). | 0.25 | 0.15 | 0.15 | 0.15 |
| HD 24289 | Keck/HIRES | 5682 | 3.48 | 2.08 | 1.20 | 0.25 | 0.29 | 0.34 | 0.29 | |
| HD 24421 | Keck/HIRES | 5987 | 4.14 | 0.38 | 1.51 | 333333Stellar parameters taken from Reddy et al. (2003). | 0.18 | 0.07 | 0.07 | 0.07 |
| HD 25173 | Keck/HIRES | 5867 | 4.07 | 0.62 | 1.79 | 111111Stellar parameters taken from Chen et al. (2000). | 0.02 | 0.00 | 0.00 | 0.00 |
| HD 26421 | Keck/HIRES | 5737 | 3.98 | 0.39 | 1.53 | 333333Stellar parameters taken from Reddy et al. (2003). | 0.10 | 0.11 | 0.19 | 0.15 |
| HD 28620 | Keck/HIRES | 6101 | 4.08 | 0.52 | 1.58 | 222222Stellar parameters taken from Chen et al. (2001). | 0.15 | 0.04 | 0.04 | 0.04 |
| HD 30743 | Keck/HIRES | 6294 | 3.99 | 0.55 | 1.56 | 0.07 | 0.24 | 0.22 | 0.23 | |
| HD 31128 | Keck/HIRES | 5857 | 4.28 | 1.46 | 0.89 | 0.26 | 0.31 | 0.19 | 0.19 | |
| HD 33632 | Keck/HIRES | 5962 | 4.30 | 0.23 | 1.56 | 111111Stellar parameters taken from Chen et al. (2000). | 0.20 | 0.16 | 0.24 | 0.20 |
| HD 54717 | Keck/HIRES | 6350 | 4.26 | 0.44 | 2.00 | 111111Stellar parameters taken from Chen et al. (2000). | 0.05 | 0.11 | 0.11 | 0.11 |
| HD 63333 | Keck/HIRES | 6054 | 4.25 | 0.38 | 1.46 | 333333Stellar parameters taken from Reddy et al. (2003). | 0.11 | 0.02 | 0.05 | 0.04 |
| HD 68284 | Keck/HIRES | 5832 | 3.91 | 0.56 | 1.60 | 222222Stellar parameters taken from Chen et al. (2001). | 0.10 | 0.04 | 0.06 | 0.05 |
| HD 80218 | Keck/HIRES | 6091 | 4.19 | 0.28 | 1.51 | 333333Stellar parameters taken from Reddy et al. (2003). | 0.08 | 0.04 | 0.00 | 0.02 |
| HD 89125 | Keck/HIRES | 6038 | 4.25 | 0.36 | 1.66 | 111111Stellar parameters taken from Chen et al. (2000). | 0.19 | 0.12 | 0.12 | 0.12 |
| HD 91638 | Keck/HIRES | 6160 | 4.29 | 0.25 | 1.47 | 333333Stellar parameters taken from Reddy et al. (2003). | 0.16 | 0.03 | 0.03 | 0.03 |
| HD 91889 | Keck/HIRES | 6020 | 4.15 | 0.24 | 1.66 | 111111Stellar parameters taken from Chen et al. (2000). | 0.13 | 0.05 | 0.05 | 0.05 |
| HD 94835 | Keck/HIRES | 5814 | 4.43 | 0.05 | 1.26 | 333333Stellar parameters taken from Reddy et al. (2003). | 0.23 | 0.24 | 0.24 | 0.24 |
| HD 100180 | Keck/HIRES | 5866 | 4.12 | 0.11 | 1.87 | 111111Stellar parameters taken from Chen et al. (2000). | 0.19 | 0.21 | 0.21 | 0.21 |
| HD 104056 | Keck/HIRES | 5786 | 4.23 | 0.55 | 1.30 | 0.13 | 0.19 | 0.19 | 0.19 | |
| HD 109303 | Keck/HIRES | 5905 | 4.10 | 0.47 | 1.50 | 111111Stellar parameters taken from Chen et al. (2000). | 0.19 | 0.07 | 0.08 | 0.08 |
| HD 118244 | Keck/HIRES | 6234 | 4.13 | 0.53 | 1.92 | 111111Stellar parameters taken from Chen et al. (2000). | 0.12 | 0.05 | 0.05 | 0.05 |
| HD 134439 | Keck/HIRES | 5029 | 4.87 | 1.28 | 0.60 | 0.18 | 0.14 | 0.14 | 0.14 | |
| HD 134440 | Keck/HIRES | 4851 | 4.99 | 1.32 | 1.20 | 0.06 | 0.09 | 0.06 | 0.06 | |
| HD 186379 | Keck/HIRES | 5806 | 3.99 | 0.39 | 1.54 | 333333Stellar parameters taken from Reddy et al. (2003). | 0.21 | 0.12 | 0.18 | 0.15 |
| HD 194598 | Keck/HIRES | 5943 | 4.12 | 1.23 | 1.50 | 0.22 | 0.30 | 0.30 | 0.30 | |
| HD 200580 | Keck/HIRES | 5829 | 4.39 | 0.54 | 1.72 | 111111Stellar parameters taken from Chen et al. (2000). | 0.18 | 0.13 | 0.18 | 0.16 |
| HD 202884 | Keck/HIRES | 6141 | 4.36 | 0.24 | 1.42 | 333333Stellar parameters taken from Reddy et al. (2003). | 0.08 | 0.11 | 0.11 | 0.11 |
| HD 204712 | Keck/HIRES | 5888 | 4.12 | 0.48 | 1.49 | 333333Stellar parameters taken from Reddy et al. (2003). | 0.09 | 0.03 | 0.06 | 0.04 |
| HD 209320 | Keck/HIRES | 5994 | 4.14 | 0.18 | 1.51 | 333333Stellar parameters taken from Reddy et al. (2003). | 0.24 | 0.01 | 0.05 | 0.03 |
| HD 209858 | Keck/HIRES | 5911 | 4.26 | 0.27 | 1.40 | 333333Stellar parameters taken from Reddy et al. (2003). | 0.18 | 0.20 | 0.20 | 0.20 |
| HD 215442 | Keck/HIRES | 5872 | 3.80 | 0.22 | 1.69 | 333333Stellar parameters taken from Reddy et al. (2003). | 0.32 | 0.21 | 0.21 | 0.21 |
| HD 241253 | Keck/HIRES | 5877 | 4.08 | 1.12 | 1.02 | 0.22 | 0.25 | 0.23 | 0.24 | |
| HD 247297 | Keck/HIRES | 5449 | 3.45 | 0.56 | 1.15 | 0.24 | 0.14 | 0.18 | 0.16 | |
| HD 345957 | Keck/HIRES | 5752 | 3.91 | 1.30 | 1.04 | 0.15 | 0.06 | 0.06 | 0.06 | |
| Ross 390 | Keck/HIRES | 5299 | 4.36 | 1.19 | 0.95 | 0.15 | 0.16 | 0.16 | ||
| Ross 797 | Keck/HIRES | 6255 | 3.87 | 1.25 | 0.80 | 0.80 | 0.80 | 0.84 | 0.82 |
5 Abundances
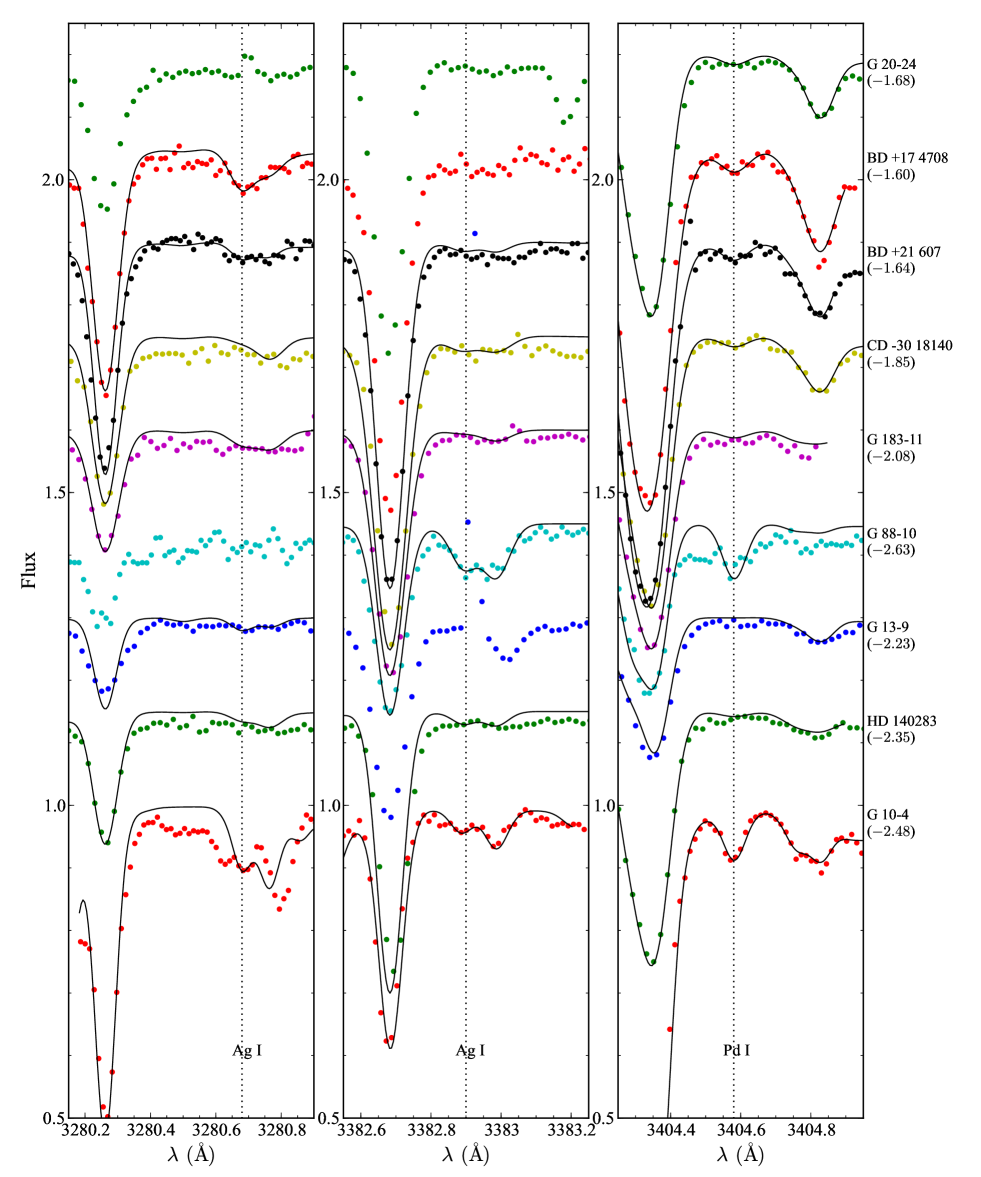
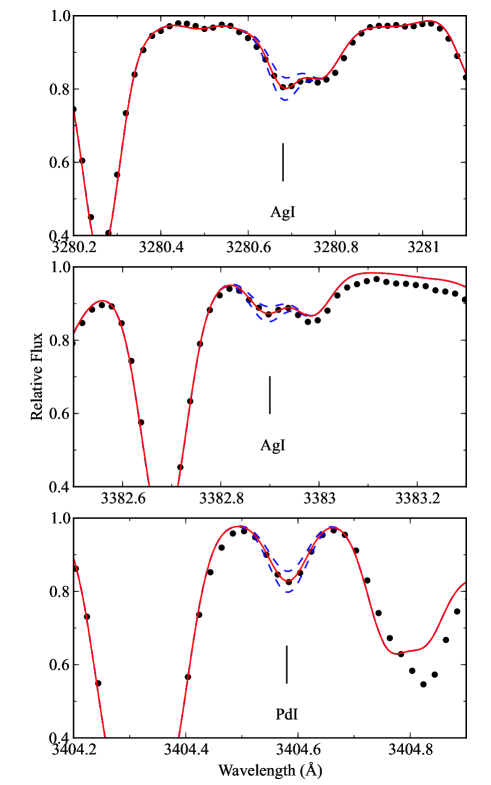
The ultraviolet Ag i 3280, 3382 Å, and Pd i 3404 Å regions are heavily blended by atomic and molecular lines. We used the spectral synthesis method with the IDL/Fortran SIU software package (Reetz 1991) to derive the Pd and Ag abundances of the sample stars. The relevant atomic data of Pd i and Ag i used in this work were presented in Table 3. For silver, the values were taken from Ross & Aller (1972), where the hyperfine structure of both lines were taken into account. The value of palladium was taken from the VALD777Vienna Atomic Lines Database, available at http://vald.astro.univie.ac.at/vald/php/vald.php database.
The overall values for Ag i 3280.68 Å and 3382.90 Å are 0.005 and 0.002 dex higher than those of Hansen et al. (2012), respectively. While for Pd i, our adopted is 0.02 dex lower. The van der Waals damping constants of both silver and palladium lines were calculated according to the Anstee & O’Mara (1991, 1995) interpolation tables. The blended atomic and molecular lines involve NH, Fe i, Fe ii, Ni i, Ni ii, V i, V ii, Cr i, Ti i, and Ti ii. We have considered the influence induced by the Zr ii line on the red wing of Ag i Å by synthesizing the spectra with oscillation strength , (same as Hansen et al. 2012) and without this transition. We found that the differences are less than 0.03 dex for the deduced Ag abundance, and we did not include Zr ii in our line list. The line information was taken from Kurucz database with slight adjustments. To minimize the systematic offsets and make a direct comparison with Hansen et al. (2012), we adopted the same solar abundance values (; ) in our analysis as those used in their study.
| (eV) | ||||
| Ag I | 3280.682 | 0.00 | -0.452 | -31.795 |
| Ag I | 3280.683 | 0.00 | -0.432 | -31.795 |
| Ag I | 3280.688 | 0.00 | -0.912 | -31.795 |
| Ag I | 3280.690 | 0.00 | -0.933 | -31.795 |
| Ag I | 3382.899 | 0.00 | -0.755 | -31.829 |
| Ag I | 3382.900 | 0.00 | -0.754 | -31.829 |
| Ag I | 3382.905 | 0.00 | -1.235 | -31.829 |
| Ag I | 3382.908 | 0.00 | -1.256 | -31.829 |
| Pd I | 3404.582 | 0.81 | 0.300 | -31.822 |
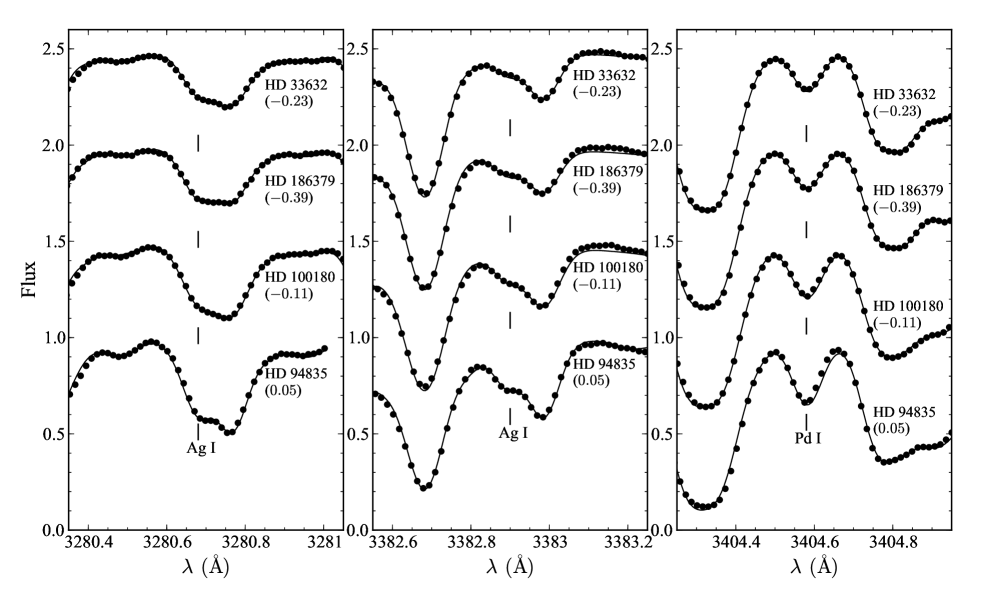
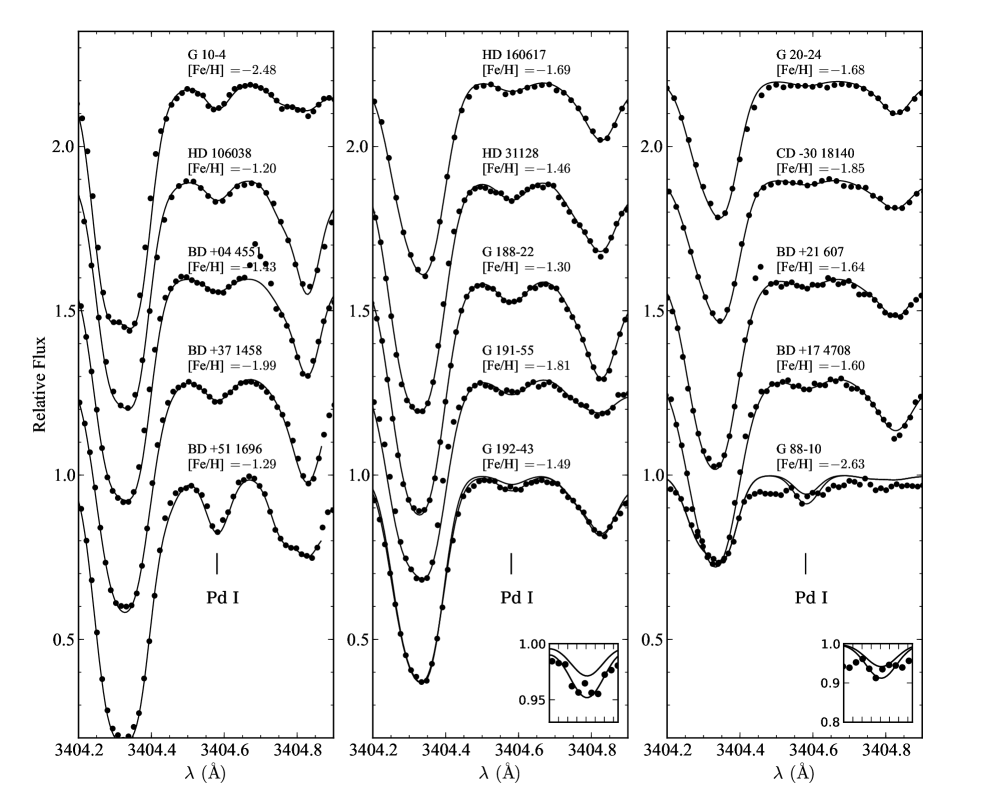
Figures 4, 5, 6 and 7 show the examples of spectral synthesis of the Ag i and Pd i lines for our sample stars. All of the four stars in Fig. 4 have solar metallcities or are mildly metal-poor, with [Fe/H] ranging from to +0.05. According to the kinetic criteria in section 4, they belong to the thin disk. Although the Ag i lines were heavily blended with Mn i ( 3280.77 Å) or Fe i ( 3382.98 Å), the spectral region can be well fitted by assuming Gaussian instrumental profiles.
5.1 Error estimation
The errors in the derived chemical abundances are mainly due to the uncertainties in the stellar parameters and the continuum placement. Considering that the S/Ns of most spectra are higher than 100, the estimated abundance uncertainties caused by continuum location are around 0.15 dex. The errors caused by the uncertainties in the stellar atmospheric parameters are about 0.12 dex for Pd and 0.13 dex for Ag. Table 4 gives the abundance differences due to deviations of the effective temperature of 80 K, the surface gravity of 0.15 dex, the iron abundance of 0.10 dex and the microturbulent velocity of 0.2 km s-1 for a typical star, HD 76932. By quadratic summing of the above uncertainties, the errors of Pd and Ag abundances are estimated to be 0.19 and 0.20 dex, respectively.
| Element ratios | ( K) | () | [Fe/H] () | ( km s-1) | |
|---|---|---|---|---|---|
| [Ag/H]3382.9 | |||||
| [Ag/H]3280.7 | |||||
| [Pd/H]3404.6 |
5.2 Comparison with the literature
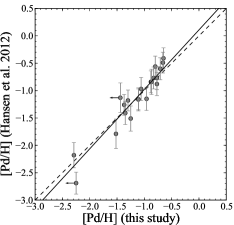
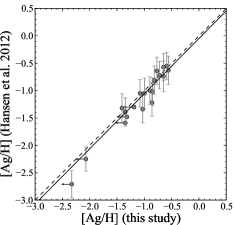
Hansen & Primas (2011) and the follow-up study (Hansen et al. 2012) derived Pd and Ag abundances for 34 dwarfs and 23 giants, of which 23 dwarfs and 2 giants are also included in our sample. We compared our abundances with the results of Hansen et al. (2012) for common stars in Fig. 8. We found excellent agreement with the Hansen et al. (2012) results. The mean differences are dex and dex, and both of the scatters are within the errors.
For G 183-11 and HD 140283, Hansen et al. (2012) did not report any Ag abundance, while we gave the upper limits based on the shallow absorption features exhibit in the spectra. The poor S/Ns and difficulties with locating the continuum placement properly has prevented any accurate measurements on these lines. While for CD 30 18140, we gave Pd i abundance value based on a weak line, because the absorption feature has exceeded the 3 level below the continuum so cannot be fully explained by spectral noise. Similar features were also found for BD +21 607 and BD +17 4708. For G 20-24, we derived an upper limit of Pd i, and yet it is inconsistent with Hansen et al. (2012) ([Pd/Fe] = ). We attribute this conflict to the large differences in the parameters determined by Hansen et al. (2012) ( K, [Fe/H] = dex) and this work (6141 K, dex). Their spectral synthesis are plotted in the righthand panel of Fig. 7.
In addition, for HD 103723, HD 106038, and HD 113679, our Pd i abundances are below the 1 lower limits of Hansen et al. (2012). This is mainly due to the relative large differences in and/or the deviations in [Fe/H], as discussed in Sect. 3.5.
Another source of deviations in the Ag abundance may arise from the two-level hyperfine splitting data of Ross & Aller (1972) adopted by this work and the three levels by Hansen et al. (2012). We selected 12 stars that span a wide range of and metallicities, and derived their Ag abundances with the above two sets of hyperfine splitting data. We found that the differences are within 0.01 dex, so much smaller than the claimed uncertainties of Ag in any studies, so they can be neglected.
Peterson (2013) also analyzed a sample of 29 turnoff stars and determined Pd abundances for 14 of them. There are 16 stars shared with our sample. For seven stars (BD +17 4708, BD +21 607, BD +37 1458, G 188-22, HD 31128, HD 106038, HD 160617), they did not report Pd abundance, but we gave detections. We plotted the Pd i regions in figure 7. For the remaining nine stars, our Pd abundances agree with their values very closely, except for G 191-55 and G 192-43. For G 191-55, Peterson (2013) gave [Pd/Fe] = 0.3, while we found a lower value of 0.11 dex. The difference again results from the large deviations of stellar parameters, especially (6000 K in Peterson 2013; 5570 K in our work). For G 192-43 ([Fe/H] ), where Peterson (2013) detected [Pd/Fe] = 0.2, we found [Pd/Fe] = 0.39 using the Pd i line of the same Keck/HIRES spectra. The line profile of Pd i exhibits a W-shape, as shown in figure 7. We found that the synthesis spectrum with [Pd/Fe] = 0.2 and their parameters () cannot explain the tip of the line core fully, whereas we have adopted the lower profile with slightly higher abundance.
6 Results and discussion
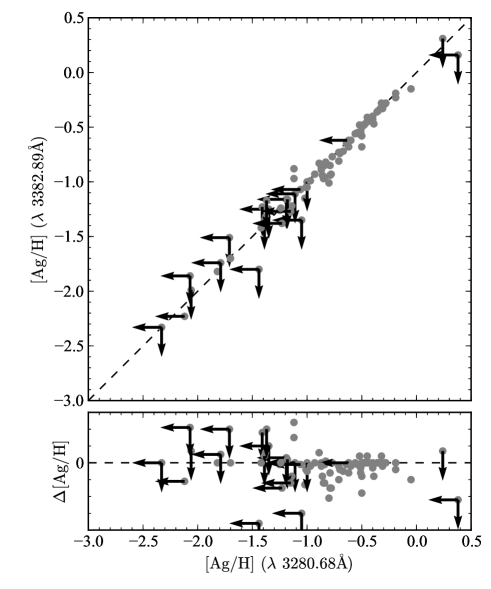
The resulting Pd and Ag abundances are listed in Table LABEL:tab-abundance, which is only available online. For a few stars, we only get the upper or lower limits of abundance values because the lines are either too weak or are severely blended. The comparison of the Ag i abundances derived with the lines of 3280 Å and 3382 Å is shown in figure 9. The mean difference is dex, and there is no significant trend in the residual.
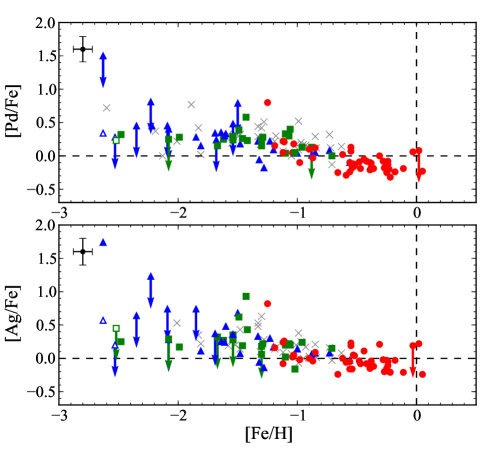
The abundance results of [Pd/Fe] and [Ag/Fe] versus [Fe/H] are plotted in figure 10. The [Ag/Fe] abundances are the averages of the values derived from the two Ag i lines, if neither of them are upper or lower limits. Otherwise only the values without limits are adopted. In general, [Pd/Fe] and [Ag/Fe] exihibt very similar behaviors with [Fe/H]. Both of them show flat trends above [Fe/H] , until solar metallicities up to [Fe/H] +0.1, where the sample is dominated by thin disk stars. While the thick disk and halo stars are well mixed at [Fe/H] , and both of the abundance ratios slowly increase with decreasing [Fe/H]. The large star-to-star scatters (0.16 dex for [Pd/Fe] and 0.30 dex for [Ag/Fe]) at [Fe/H] are not likely due to our internal errors but are probably caused by the inhomogeneous mixing of newly produced nuclides in the early Galaxy. And the descents of [Pd/Fe] and [Ag/Fe] with [Fe/H] at [Fe/H] may be attributed to the rise of Fe in the SNIa yield.
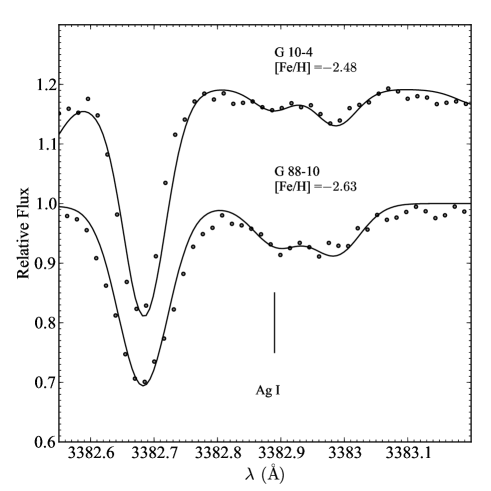
We report the detections of Ag for a few metal-poor dwarfs with [Fe/H] , although the number is small. For example, G 88-10 ([Fe/H] = ) has an exceptional overabundance of [Ag/Fe] = +1.74, and the Pd abundance is likely to be overabundant as well ([Pd/Fe] ), as shown in Figs. 7 and 11. The enhancements of both Pd and Ag provide evidence of a good correlation between these two elements, even in such a very metal-poor environment. Furthermore, G 88-10 is listed as a close binary system with days in the SB9 catalog (Goldberg et al. 2002). Nevertheless, the overabundances of Ag and Pd (fairly high upper limit) are probably not due to the photospheric pollution via material transfer between the two companions, because this process is thought to be mainly responsible for the enhancements of -process elements rather than -process. Anyhow, the anomaly of G 88-10 deserves further investigations by connecting Pd and Ag with other elements produced by different nucleosynthesis processes, such as Ba and Eu. Another metal-poor star with [Fe/H] is G 10-4, for which we detected Pd i line at 3404.5 Å (figure 7) and Ag i line at 3382.9 Å (figure 11) based on Keck/HIRES spectra.
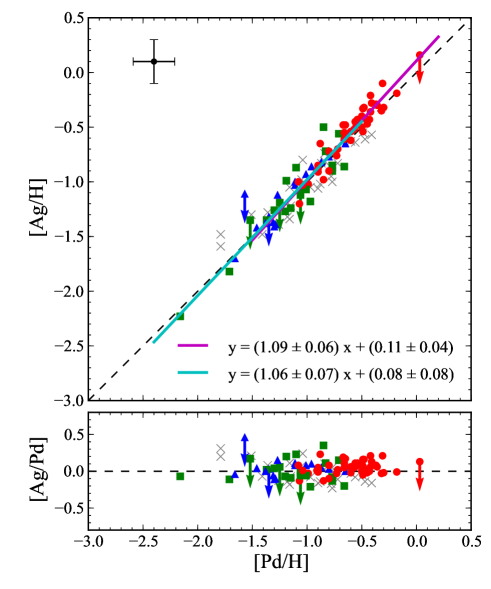
In figure 12 we plotted both the ratios of [Ag/H] versus [Pd/H] with colors coded by various Galactic populations. After excluding the three giants and the dwarfs with only upper or lower limits of Ag or Pd abundances, we found a least-square linear fitting of [Ag/H] = () [Pd/H] + () for the entire sample. This is in general consistent with the slope of 0.97 by accounting for the uncertainties for the sample of dwarf + giant stars found by Hansen & Primas (2011). Furthermore, we found that the slope of Ag v.s. Pd stays constant at a wide abundance ratio range of in the Galactic dwarfs. The mixing thick disk + halo stars almost show the same trend as that of thin disk stars. If the thick disk and halo stars are seperated, the linear fits in figure 12 becomes (thick disk) and (halo), respectively.
It is well-known that the chemical evolution were dominated by the -process in the early Galaxy. As the Galactic metallicity increases, the contribution of the -process becomes significant because the time scales of low-mass AGB stars are considered to be much longer than that of the -process (e.g., Burris et al. 2000). Arlandini et al. (1999) predicted that 46% of Pd and 20% of Ag in the solar system are produced by the -process, and Bisterzo et al. (2011) got similar results (53.1% for Pd and 22.1% for Ag). Both of the calculations led to a slope of [Ag/H] versus [Pd/H] less than unity above [Fe/H] because the -process produces roughly the same amount of Pd as does the -process, but this fraction is only 1/5 for Ag. However, our results do not confirm the predictions of these stellar nucleosynthesis models. The trends in Ag vs. Pd in the Galactic dwarfs stay constant from a very metal-poor environment of until the solar metallicity.
7 Conclusions
Based on the archive near-UV spectra obtained with Keck/HIRES, Subaru/HDS, and VLT/UVES, we analyzed a large sample of stars spanning the metallicity range of [Fe/H] . We reported the photospheric abundances of palladium (Pd) and silver (Ag) for 83 and 79 stars, respectively, including several dwarfs with [Fe/H] , which have seldom been detected in previous studies. The most metal-depleted dwarf with detected Ag abundance is down to [Fe/H] . Meanwhile, our study investigated these two elements for the first time for a group of stars with solar and super-solar metallicities.
Our sample has increased the number of dwarfs with known Pd and Ag abundances by a factor of 2. It was found that both [Pd/Fe] and [Ag/Fe] show flat trends with metallicities around [Fe/H] and slowly increase with decreasing metallicity below [Fe/H] . In metal-poor stars with [Fe/H] , [Pd/Fe] and [Ag/Fe] ratios are enhanced by 0.3 dex, and they show large star-to-star dispersions of 0.3 dex. On the other hand, the amount of Pd in the Galactic dwarfs grows at nearly the same speed as does Ag at the whole [Pd/H] ranging from to , and good correlations between [Ag/H] and [Pd/H] were found for different stellar populations. It seems that the trends in [Ag/H] v.s. [Pd/H] are the same within their errors for thin disk, thick disk, and halo stars. These facts imply that the two elements are synthesized by similar processes during the Galactic chemical evolution history, and our results do not support the theoretical predictions that Pd and Ag have different contributions from the -process.
Acknowledgements.
This research is supported by the National Natural Science Foundation of China under grant Nos. 11321064, 11233004, 11473033, and U1331122. The data used in this research were obtained from the Keck Observatory Archive (KOA), the Subaru-Mitaka-Okayama-Kiso Archive (SMOKA), and the ESO Science Archive Facility. KOA is operated by the W. M. Keck Observatory and the NASA Exoplanet Science Institute (NExScI), under contract with the National Aeronautics and Space Administration. SMOKA is operated by the Astronomy Data Center, National Astronomical Observatory of Japan. The observations of Keck/HIRES spectra were made under program ID H41aH, H11aH, H03aH, H177Hb, H269Hb, and H233Hb (P.I. A.Boesgaard). The observations of Subaru/HDS spectra were made under program ID o01319, o03310 (P.I. A.Boesgaard), o03429 (P.I. S.Honda), and o07136 (P.I. S.Wanajo). The observations of VLT/UVES spectra were done under program IDs 65.L-0507 and 67.D-0439 (P.I. F.Primas). We thank all the above P.I.s for obtaining the data that made this study possible. We thank the anonymous referee for the essential suggestions that improved this article. X.S.Wu thanks Dr. Kefeng Tan for providing the reduced UVES 1-D spectra. This research made use of the SIMBAD database, which is operated at the CDS, Strasbourg, France, and the data products from the Two Micron All Sky Survey, which is a joint project of the University of Massachusetts and the Infrared Processing and Analysis Center/California Institute of Technology, funded by the National Aeronautics and Space Administration and the National Science Foundation.References
- Alonso et al. (1995) Alonso, A., Arribas, S., & Martinez-Roger, C. 1995, A&A, 297, 197
- Alonso et al. (1996) Alonso, A., Arribas, S., & Martinez-Roger, C. 1996, A&A, 313, 873
- Anstee & O’Mara (1991) Anstee, S. D. & O’Mara, B. J. 1991, MNRAS, 253, 549
- Anstee & O’Mara (1995) Anstee, S. D. & O’Mara, B. J. 1995, MNRAS, 276, 859
- Arce & Goodman (1999) Arce, H. G. & Goodman, A. A. 1999, ApJ, 512, L135
- Arcones & Montes (2011) Arcones, A. & Montes, F. 2011, ApJ, 731, 5
- Argast et al. (2004) Argast, D., Samland, M., Thielemann, F.-K., & Qian, Y.-Z. 2004, A&A, 416, 997
- Arlandini et al. (1999) Arlandini, C., Käppeler, F., Wisshak, K., et al. 1999, ApJ, 525, 886
- Arnould & Goriely (2003) Arnould, M. & Goriely, S. 2003, Phys. Rep, 384, 1
- Bagnulo et al. (2003) Bagnulo, S., Jehin, E., Ledoux, C., et al. 2003, The Messenger, 114, 10
- Bensby et al. (2003) Bensby, T., Feltzing, S., & Lundström, I. 2003, A&A, 410, 527
- Bensby et al. (2014) Bensby, T., Feltzing, S., & Oey, M. S. 2014, A&A, 562, A71
- Bisterzo et al. (2010) Bisterzo, S., Gallino, R., Straniero, O., Cristallo, S., & Käppeler, F. 2010, MNRAS, 404, 1529
- Bisterzo et al. (2011) Bisterzo, S., Gallino, R., Straniero, O., Cristallo, S., & Käppeler, F. 2011, MNRAS, 418, 284
- Boesgaard & Novicki (2006) Boesgaard, A. M. & Novicki, M. C. 2006, ApJ, 641, 1122
- Boesgaard et al. (2011) Boesgaard, A. M., Rich, J. A., Levesque, E. M., & Bowler, B. P. 2011, ApJ, 743, 140
- Bonifacio et al. (2000) Bonifacio, P., Monai, S., & Beers, T. C. 2000, AJ, 120, 2065
- Burbidge et al. (1957) Burbidge, E. M., Burbidge, G. R., Fowler, W. A., & Hoyle, F. 1957, Reviews of Modern Physics, 29, 547
- Burris et al. (2000) Burris, D. L., Pilachowski, C. A., Armandroff, T. E., et al. 2000, ApJ, 544, 302
- Busso et al. (1999) Busso, M., Gallino, R., & Wasserburg, G. J. 1999, ARA&A, 37, 239
- Cameron (1957) Cameron, A. G. W. 1957, PASP, 69, 201
- Cameron (2001) Cameron, A. G. W. 2001, ApJ, 562, 456
- Canuto & Mazzitelli (1991) Canuto, V. M. & Mazzitelli, I. 1991, ApJ, 370, 295
- Canuto & Mazzitelli (1992) Canuto, V. M. & Mazzitelli, I. 1992, ApJ, 389, 724
- Chen et al. (2001) Chen, Y. Q., Nissen, P. E., Benoni, T., & Zhao, G. 2001, A&A, 371, 943
- Chen et al. (2000) Chen, Y. Q., Nissen, P. E., Zhao, G., Zhang, H. W., & Benoni, T. 2000, A&AS, 141, 491
- Clayton & Rassbach (1967) Clayton, D. D. & Rassbach, M. E. 1967, ApJ, 148, 69
- Crawford et al. (1998) Crawford, J. L., Sneden, C., King, J. R., Boesgaard, A. M., & Deliyannis, C. P. 1998, AJ, 116, 2489
- Cristallo et al. (2009) Cristallo, S., Straniero, O., Gallino, R., et al. 2009, ApJ, 696, 797
- Dehnen & Binney (1998) Dehnen, W. & Binney, J. J. 1998, MNRAS, 298, 387
- Dekker et al. (2000) Dekker, H., D’Odorico, S., Kaufer, A., Delabre, B., & Kotzlowski, H. 2000, in Society of Photo-Optical Instrumentation Engineers (SPIE) Conference Series, Vol. 4008, Society of Photo-Optical Instrumentation Engineers (SPIE) Conference Series, ed. M. Iye & A. F. Moorwood, 534–545
- Farouqi et al. (2009) Farouqi, K., Kratz, K.-L., Mashonkina, L. I., et al. 2009, ApJ, 694, L49
- Farouqi et al. (2010) Farouqi, K., Kratz, K.-L., Pfeiffer, B., et al. 2010, ApJ, 712, 1359
- François et al. (2007) François, P., Depagne, E., Hill, V., et al. 2007, A&A, 476, 935
- Freiburghaus et al. (1999) Freiburghaus, C., Rosswog, S., & Thielemann, F.-K. 1999, ApJ, 525, L121
- Frischknecht et al. (2012) Frischknecht, U., Hirschi, R., & Thielemann, F.-K. 2012, A&A, 538, L2
- Fuhrmann (1998) Fuhrmann, K. 1998, A&A, 338, 161
- Gallino et al. (1998) Gallino, R., Arlandini, C., Busso, M., et al. 1998, ApJ, 497, 388
- Gehren et al. (2006) Gehren, T., Shi, J. R., Zhang, H. W., Zhao, G., & Korn, A. J. 2006, A&A, 451, 1065
- Goldberg et al. (2002) Goldberg, D., Mazeh, T., Latham, D. W., et al. 2002, AJ, 124, 1132
- Goriely et al. (2011) Goriely, S., Bauswein, A., & Janka, H.-T. 2011, ApJ, 738, L32
- Goriely et al. (2005) Goriely, S., Demetriou, P., Janka, H.-T., Pearson, J. M., & Samyn, M. 2005, Nuclear Physics A, 758, 587
- Gratton et al. (2003) Gratton, R. G., Carretta, E., Claudi, R., Lucatello, S., & Barbieri, M. 2003, A&A, 404, 187
- Grupp (2004) Grupp, F. 2004, A&A, 420, 289
- Grupp et al. (2009) Grupp, F., Kurucz, R. L., & Tan, K. 2009, A&A, 503, 177
- Hansen & Primas (2011) Hansen, C. J. & Primas, F. 2011, A&A, 525, L5
- Hansen et al. (2012) Hansen, C. J., Primas, F., Hartman, H., et al. 2012, A&A, 545, A31
- Hauck & Mermilliod (1998) Hauck, B. & Mermilliod, M. 1998, A&AS, 129, 431
- Hill et al. (2002) Hill, V., Plez, B., Cayrel, R., et al. 2002, A&A, 387, 560
- Høg et al. (2000) Høg, E., Fabricius, C., Makarov, V. V., et al. 2000, A&A, 355, L27
- Honda et al. (2006) Honda, S., Aoki, W., Ishimaru, Y., Wanajo, S., & Ryan, S. G. 2006, ApJ, 643, 1180
- Honda et al. (2004) Honda, S., Aoki, W., Kajino, T., et al. 2004, ApJ, 607, 474
- Ishigaki et al. (2012) Ishigaki, M. N., Chiba, M., & Aoki, W. 2012, ApJ, 753, 64
- Johnson & Soderblom (1987) Johnson, D. R. H. & Soderblom, D. R. 1987, AJ, 93, 864
- Johnson & Bolte (2002) Johnson, J. A. & Bolte, M. 2002, ApJ, 579, 616
- Just et al. (2015) Just, O., Bauswein, A., Pulpillo, R. A., Goriely, S., & Janka, H.-T. 2015, MNRAS, 448, 541
- Käppeler et al. (1989) Käppeler, F., Beer, H., & Wisshak, K. 1989, Reports on Progress in Physics, 52, 945
- Käppeler et al. (2011) Käppeler, F., Gallino, R., Bisterzo, S., & Aoki, W. 2011, Reviews of Modern Physics, 83, 157
- Karakas et al. (2009) Karakas, A. I., van Raai, M. A., Lugaro, M., Sterling, N. C., & Dinerstein, H. L. 2009, ApJ, 690, 1130
- Korn et al. (2003) Korn, A. J., Shi, J., & Gehren, T. 2003, A&A, 407, 691
- Korobkin et al. (2012) Korobkin, O., Rosswog, S., Arcones, A., & Winteler, C. 2012, MNRAS, 426, 1940
- Kratz et al. (2007) Kratz, K.-L., Farouqi, K., Pfeiffer, B., et al. 2007, ApJ, 662, 39
- Kurucz (2005) Kurucz, R. L. 2005, Memorie della Societa Astronomica Italiana Supplementi, 8, 189
- Lind et al. (2012) Lind, K., Bergemann, M., & Asplund, M. 2012, MNRAS, 427, 50
- Lodders et al. (2009) Lodders, K., Palme, H., & Gail, H.-P. 2009, Landolt Börnstein, 44
- Mashonkina et al. (2011) Mashonkina, L., Gehren, T., Shi, J.-R., Korn, A. J., & Grupp, F. 2011, A&A, 528, A87
- McLaughlin & Surman (2005) McLaughlin, G. C. & Surman, R. 2005, Nuclear Physics A, 758, 189
- Montes et al. (2007) Montes, F., Beers, T. C., Cowan, J., et al. 2007, ApJ, 671, 1685
- Navarro et al. (2011) Navarro, J. F., Abadi, M. G., Venn, K. A., Freeman, K. C., & Anguiano, B. 2011, MNRAS, 412, 1203
- Nissen (2013) Nissen, P. E. 2013, A&A, 552, A73
- Noguchi et al. (2002) Noguchi, K., Aoki, W., Kawanomoto, S., et al. 2002, PASJ, 54, 855
- Perego et al. (2014) Perego, A., Rosswog, S., Cabezón, R. M., et al. 2014, MNRAS, 443, 3134
- Peterson (2013) Peterson, R. C. 2013, ApJ, 768, L13
- Pignatari et al. (2010) Pignatari, M., Gallino, R., Heil, M., et al. 2010, ApJ, 710, 1557
- Pignatari et al. (2013) Pignatari, M., Hirschi, R., Wiescher, M., et al. 2013, ApJ, 762, 31
- Ramírez & Meléndez (2004) Ramírez, I. & Meléndez, J. 2004, ApJ, 609, 417
- Reddy et al. (2003) Reddy, B. E., Tomkin, J., Lambert, D. L., & Allende Prieto, C. 2003, MNRAS, 340, 304
- Reetz (1991) Reetz, J. K. 1991, Diploma Thesis, Universität München
- Ross & Aller (1972) Ross, J. E. & Aller, L. H. 1972, Sol. Phys., 25, 30
- Rosswog et al. (1999) Rosswog, S., Liebendörfer, M., Thielemann, F.-K., et al. 1999, A&A, 341, 499
- Schlegel et al. (1998) Schlegel, D. J., Finkbeiner, D. P., & Davis, M. 1998, ApJ, 500, 525
- Simmerer et al. (2004) Simmerer, J., Sneden, C., Cowan, J. J., et al. 2004, ApJ, 617, 1091
- Sneden et al. (2008) Sneden, C., Cowan, J. J., & Gallino, R. 2008, ARA&A, 46, 241
- Sneden et al. (2003) Sneden, C., Cowan, J. J., Lawler, J. E., et al. 2003, ApJ, 591, 936
- Straniero et al. (1997) Straniero, O., Chieffi, A., Limongi, M., et al. 1997, ApJ, 478, 332
- Tan et al. (2009) Tan, K. F., Shi, J. R., & Zhao, G. 2009, MNRAS, 392, 205
- Travaglio et al. (2004) Travaglio, C., Gallino, R., Arnone, E., et al. 2004, ApJ, 601, 864
- Travaglio et al. (2001) Travaglio, C., Gallino, R., Busso, M., & Gratton, R. 2001, ApJ, 549, 346
- van Leeuwen (2007) van Leeuwen, F. 2007, A&A, 474, 653
- Vogt et al. (1994) Vogt, S. S., Allen, S. L., Bigelow, B. C., et al. 1994, in Society of Photo-Optical Instrumentation Engineers (SPIE) Conference Series, Vol. 2198, Instrumentation in Astronomy VIII, ed. D. L. Crawford & E. R. Craine, 362
- Wanajo & Janka (2012) Wanajo, S. & Janka, H.-T. 2012, ApJ, 746, 180
- Wanajo et al. (2003) Wanajo, S., Tamamura, M., Itoh, N., et al. 2003, ApJ, 593, 968
- Wasserburg & Qian (2000) Wasserburg, G. J. & Qian, Y.-Z. 2000, ApJ, 529, L21
- Woosley et al. (1997) Woosley, S. E., Hoffman, R. D., Timmes, F. X., Weaver, T. A., & Thielemann, F.-K. 1997, Nuclear Physics A, 621, 445
- Yi et al. (2003) Yi, S. K., Kim, Y.-C., & Demarque, P. 2003, ApJS, 144, 259
- Zhao & Magain (1990) Zhao, G. & Magain, P. 1990, A&A, 238, 242