Exploring Multiwavelength AGN Variability with Swift Archival Data
Abstract:
We are conducting an archival Swift program to measure multiwavelength variability in active galactic nuclei (AGN). This variability information will provide constraints on the geometry, physical conditions and processes of the structures around the central black holes that emit and reprocess the observed flux. Among our goals are: (1) to produce a catalog of type 1 AGN with time-resolved multi-wavelength data; (2) to characterize variability in the optical, UV and X-ay bands as well as changes in spectral slope; (3) to quantify the impact of variability on multi-wavelength properties; and (4) to measure correlated variability between bands. Our initial efforts have revealed a UVOT calibration issue that can cause a few percent of measured UV fluxes to be anomalously low, by up to 30%.
1 Introduction
1.1 Multiwavelength variability in AGN
Active Galactic Nuclei (AGN) are intrinsically broad-band beasts, with emission spanning the electromagnetic spectrum [e.g., 4]. Emission in different wavebands is in general dominated by different structures. For instance, the optical-to-ultraviolet (UV) emission is dominated by the big blue bump (BBB), which is the integrated black body emission from regions of the accretion disk with a distribution of temperatures, whilst X-rays are thought to be due to inverse Compton (IC) scattering (likely the upscattering of BBB photons by a coronal region around the accretion disk), and the infrared (IR) band exhibits thermal emission from both AGN-heated dust and the host galaxy stellar population. Consequently, a complete picture of AGN requires multiwavelength data. When parts of the spectral energy distribution (SED) are not observed, a generic spectral shape is assumed to estimate the unobserved flux.
AGN emission is also variable, with intrinsic time scales that may differ for each emitting region. The most compact regions, generally the energetic regions closest to the central black hole, can vary the most rapidly. Consequently, the temporal behavior can differ across the SED. If the timescale or amplitude of variations differ between wavebands, this will unavoidably influence multiwavelength measurements such as the optical to X-ray spectral index, (defined as ; effectively the relative power of the accretion disk and the IC emission). As a result, a single measurement may not provide a typical value for a given AGN (e.g., Figure 1, in which the of 1RXS J2349–31 is shown to change by within a span of eight months). Variability therefore adds noise to measurements of multiwavelength parameters, which will weaken or obscure correlations that could provide insight into the properties and processes of AGN.
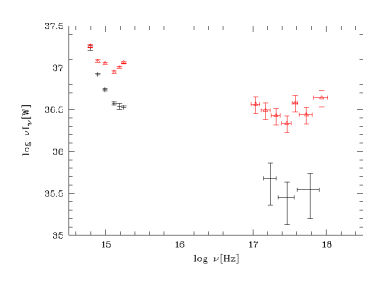
Historically, the availability of simultaneous multiwavelength data has been limited due to the difficulty of coordinating observations. As a result, non-simultaneous data have often been combined to establish multiwavelength parameters. The danger of this is demonstrated by 1RXS J2349–31 (Figure 1): if the optical measurements of one epoch are combined with the X-ray measurements of the other, the values obtained would be either or , whereas measurements from simultaneous data only show a change from to . Instances such as this amplify the impact of variability upon multiwavelength parameter measurements when non-simultaneous data are combined. For example, an anti-correlation has been established between UV luminosity (LUV) and [e.g., 6]. We have shown that the scatter in this correlation is reduced by at least 20% when only simultaneous UV and X-ray data are used [12].
1.2 Why Swift?
The data archive of the Swift satellite is a unique resource for studies of multiwavelength variability. By default, Swift collects data simultaneously with the X-ray Telescope (XRT) and the Ultraviolet/Optical Telescope (UVOT). The availability of simultaneous data in these bands is critical, as these are the bands in which radio-quiet AGN vary most strongly.
The XRT and UVOT have wide, co-aligned fields of view, providing nearly 300 sq. arcmin of overlapping area with each pointing. This large area provides opportunities to measure many serendipitous sources as well as the intended targets of each observation. As of 13 May 2012, the Swift archive included 667 sq. degrees of sky covered by both instruments with exposure times of at least 1 ks and 222 sq. degrees with at least 10 ks of exposure time. In addition, there are many fields with repeated observations, making it possible to measure variability on time scales ranging from hours to years. This includes 400 sq. degrees with data taken at least one day apart.
XMM-Newton also offers simultaneous X-ray, UV and optical data. In contrast to Swift, which is in a 1.6 hour orbit and cannot observe any point in the sky for more than 40 min per orbit, XMM is capable of observing a single field continuously for more than a day, so it is better suited for measuring variability behavior on intraday timescales. However, for timescales of days to years, Swift provides unparalleled temporal coverage, with vastly more repeated fields and higher cadence monitoring (Table 1).
| Min. num. of days with data | Swift fields | XMM fields |
|---|---|---|
| 2 | 5000 | 736 |
| 20 | 350 | 6 |
| 50 | 150 | 0 |
| 100 | 44 | 0 |
2 The catalog
We are currently building a catalog of AGN with multiple multiwavelength observations in the Swift archive. The sample will be limited to spectroscopically-confirmed AGN with secure classifications, redshifts and means of estimating parameters such as their black hole masses (MBH) and Eddington fractions (L/LEdd). We will compile X-ray data and photometry from six UVOT filters. The catalog will include time-resolved flux values, upper limits for epochs with non-detections, spectral indices and hardness ratios, and estimates of the fluxes in fixed bands in the emitted frame.
We anticipate having 2000–4000 AGN in the final sample. This will include about 2000 SDSS QSOs from the SDSS-DR7, -DR9 and -DR10 quasar catalogs [10, 8, 9] and up to 2000 additional AGN appearing in the literature. Of order 1000 of the sample members will be purely random, serendipitously-observed sources. The sample will represent a broad range of intrinsic properties (such as luminosities, black hole masses and accretion rates) and will be large enough to subdivide by these parameters in order to assess how they affect the variability behavior.
3 Objectives
The primary goals of this program may be summarized as follows:
-
•
To build the largest catalog of AGN with simultaneous X-ray, optical and UV data.
-
•
To use these data to obtain cleaner measurements of multiwavelength parameters, with which we will refine established correlations and test for new ones.
-
•
To quantify the flux and spectral variability on timescales from hours to years, characterizing both individual objects and average behavior amongst subsamples defined by various intrinsic properties.
-
•
For a limited number of AGN with both intensive monitoring and high signal-to-noise ratio data, we will put constraints on any correlated variability between the bands.
Taken together, these efforts will quantify the strength and rate of incidence of spectral variability, produce improved estimates of AGN bolometric luminosities, and provide constraints on the geometry and properties of the emission region structures. Any relationships found between observed variability and intrinsic parameters should provide insight into the underlying processes.
4 Spurious UVOT light curve dips: a newly discovered calibration issue
As a test case for our UVOT data processing scripts, we produced light curves for the AGN NGC 5548 [7, 3]. In Figure 2, we present a section of these light curves during which each observation included data in all six filters. A striking feature of these curves is a set of abrupt, short-lived flux dips. These apparent flux drops are (1) seen in simultaneous data across multiple filters; (2) strongest at short wavelengths (by up to 34% in UVW2, 22% in UVM2 and 17% in UVW1); (3) weak or absent in the optical bands; (4) found to exceed 10% in 4.5% of UVW2 measurements, 3.3% of UVM2, 1.0% of UVW1 and never in the optical filters; (5) sporadic, not periodic; and (6) not seen in the light curves of any field stars.
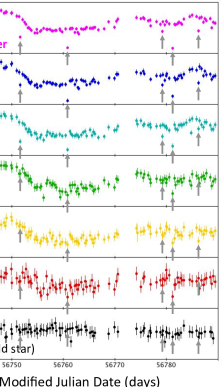
Upon first inspection, the light curve dips look real. There are no obvious defects in the data (no image artifacts, elevated backgrounds, tracking errors, known bad pixels, etc.). Moreover, no other objects in the field are affected when the AGN dips. However, the short timescales are physically implausible (extreme examples include a 33% drop in 29 min and a 20% drop in just 19 min; in both instances, fluxes measured hours later were consistent with the levels before the drops). Additionally, no comparable dips are found in contemporaneous UV data from HST [2].
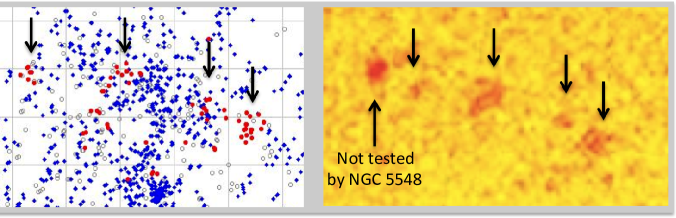
By comparing measured fluxes to neighboring points in the light curve, we have identified 85 dips [3]. Projecting these back into raw detector coordinates, we found that almost all are tightly clustered within a few small regions on the detector (Figure 3, left panel). It appears that these are detector locations at which the sensitivity is reduced, especially at short wavelengths. While this effect has not been noted previously, these regions line up with features that can be seen in the source-subtracted background images presented by Breeveld et al. ([1]; Figure 3, right panel).
In our analysis of the dips in the NGC 5548 light curve, we define regions within which the detector sensitivity appears to be reduced (see [3] for details). These preliminary regions are adequate to clean up the NGC 5548 light curves, but the data from this AGN alone are insufficient to precisely define all areas of reduced sensitivity; portions of the defined regions may not have reduced sensitivity whilst there may be other problematic areas that were not probed by the NGC 5548 data. However, the fact that the present regions cover 4% of the central 5’ 5’ of the UVOT field of view suggests that a few percent of all UVOT measurements may be affected.
Acknowledgements
We gratefully acknowledge the support from NASA under award NNH13CH61C.
References
- Breeveld et al. [2010] Breeveld, A. A., et al., 2010 Further Calibration of the Swift Ultraviolet/Optical Telescope, MNRAS 406, 1687.
- De Rosa et al. [2015] De Rosa, G., et al., 2015 Space Telescope and Optical Reverberation Mapping Project. I. Ultraviolet Observations of the Seyfert 1 Galaxy NGC 5548 with the Cosmic Origins Spectrograph on Hubble Space Telescope, accepted to ApJ (arXiv:1501.05954).
- Edelson et al. [2015] Edelson, R., et al., 2015 Space Telescope and Optical Reverberation Mapping Project. II. Swift and HST Reverberation Mapping of the Accretion Disk of NGC 5548, accepted to ApJ (arXiv:1501.05951).
- Elvis et al. [1994] Elvis, M., et al., 1994 Atlas of Quasar Energy Distributions, ApJS 95, 1.
- Grupe et al. [2010] Grupe, D., et al., 2010 The Simultaneous Optical-to-X-ray Spectral Energy Distribution of Soft X-ray Selected Active Galactic Nuclei Observed by Swift, ApJS 187, 64.
- Just et al. [2007] Just, D.W., et al., 2007 The X-Ray Properties of the Most Luminous Quasars from the Sloan Digital Sky Survey, ApJ 665, 1004.
- McHardy et al. [2014] McHardy, I. M., et al., 2014 Swift Monitoring of NGC 5548: X-ray Reprocessing and Short-term UV/Optical Variability, MNRAS 444, 1469.
- Pâris et al. [2012] Pâris, I., et al., 2012 The SDSS Quasar Catalog: Ninth Data Release, A&A 548, 66.
- Pâris et al. [2014] Pâris, I., et al., 2014 The SDSS Quasar Catalog: Tenth Data Release, A&A 563, 54.
- Schneider et al. [2010] Schneider, D.P., et al., 2010 The SDSS Quasar Catalog. V. Seventh Data Release, AJ 139, 2360.
- Watson et al. [2009] Watson, M., et al., 2009 The XMM-Newton serendipitous survey. V. The Second XMM-Newton serendipitous source catalogue, A&A 493, 339.
- Wu et al. [2012] Wu, J., et al., 2012 A Quasar Catalog with Simultaneous UV, Optical, and X-Ray Observations by Swift, ApJS 201, 10.