Inertial range turbulence of fast and slow solar wind at 0.72 AU and solar minimum
Abstract
We investigate Venus Express (VEX) observations of magnetic field fluctuations performed systematically in the solar wind at Astronomical Units (AU), between 2007 and 2009, during the deep minimum of the solar cycle 24. The Power Spectral Densities (PSD) of the magnetic field components have been computed for the time intervals that satisfy data integrity criteria and have been grouped according to the type of wind, fast and slow defined for speeds larger and respectively smaller than 450 km/s. The PSDs show higher levels of power for the fast than for the slow wind. The spectral slopes estimated for all PSDs in the frequency range 0.005-0.1 Hz exhibit a normal distribution. The average value of the trace of the spectral matrix is for fast solar wind and for slow wind. Compared to the corresponding average slopes at 1 AU, the PSDs are shallower at 0.72 AU for slow wind conditions suggesting a steepening of the solar wind spectra between Venus and Earth. No significant time variation trend is observed for the spectral behavior of both slow and fast wind.
1 Introduction
The spectral properties of the magnetic field and plasma fluctuations in the solar wind have been investigated in-situ over several decades, for a broad range of frequencies and for various radial distances. It was found that the power spectral density (PSD) of magnetic field fluctuations exhibits three different power law regimes, , characterized by different exponents: (i) for smaller (e.g. Matthaeus & Goldstein,, 1986; Verdini et al.,, 2012), (ii) for the intermediate (e.g., Marsch & Tu,, 1990); this range of is also anisotropic, the fluctuations parallel and perpendicular to the magnetic field may exhibit different power law index (see, e.g., Dasso et al.,, 2005; Horbury et al.,, 2012) (iii) with a minimum index close to (Leamon et al.,, 1999; Bruno et al, 2014b, ) for the largest (see, also, Coleman,, 1968; Stawicki et al.,, 2001, and Bruno & Carbone,, 2013, Alexandrova et al.,, 2013, for a review). Frisch, (1995) described the three characteristic power law regimes, separated by spectral breaks, as the magnetohydrodynamic equivalents of the scale ranges of the classical hydrodynamic turbulence: (i) the driving (or energy containing) range, (ii) the inertial range, dominated by nonlinear turbulent interactions that transfer the energy over multi-scales and (iii) the dissipation range. The physical processes contributing to dissipation in turbulent collisionless plasmas are still an open issue and in the recent years it has been argued (see, e.g., Alexandrova et al.,, 2013) that below the proton scales another turbulent cascade may take place that is described by a different power law. It is followed by an exponential law which could be indicative of dissipation.
In practice, the analysis of in-situ time series provides PSD as a function of the frequency in the spacecraft reference frame, , that would correspond to Doppler shifted wavevector spectra, , under the assumption that the plasma flows over the spacecraft much faster than the characteristic time evolution of the nonlinearly interacting turbulent spatial structures/eddies (the Taylor hypothesis). In the solar wind the transition between the driving and the inertial range is in general observed at frequencies between to Hz that would correspond to spatial scales related to the solar wind correlation/integral length () or the typical size of the “energy containing eddies” (Batchelor,, 1970; Matthaeus et al.,, 1994). The high frequency limit of the inertial range in the solar wind and the transition to kinetic regime is marked by a break in the spacecraft-frame frequency representation, generally in the vicinity of spatial scales (under the Taylor hypothesis) of the order of the proton inertial length or the proton Larmor radius (e.g. Chen et al.,, 2014). Recently, the variation of this break with the heliocentric distance was discussed by Bruno & Trenchi,, 2014. High resolution data seem to suggest that dissipation may effectively start at higher frequencies, corresponding to the electron Larmor radius (Alexandrova et al.,, 2009). The solar wind is a supersonic and super-Alfvénic tenuous stream of collisionless plasma emerging from the dynamic solar corona therefore discerning “pure” turbulence features from other structures convected from the Sun is still an issue (see, for instance, Tu & Marsch,, 1995; Bruno et al.,, 2007; Borovsky,, 2008).
Solar wind observations in the inner heliosphere (between 0.3 and 0.9 AU) suggest that the ordering parameter of turbulent properties is the “age” of turbulence, evaluated as the time it takes for the solar wind to travel from the Sun to the spacecraft, rather than the radial distance. The “aging” of the solar wind turbulence is also characterized by a progressive spectral dominance of the “2D” mode of turbulence (characterized mainly by perpendicular wavevectors), over the “slab” mode (dominated mainly by parallel wavevectors) (Ruiz et al.,, 2011). Analyses based on a global mean magnetic field estimation concluded that the slow wind exhibits in general features of “2D” turbulence while the turbulence in the fast wind is more of the “slab” type (Dasso et al.,, 2005; Weygand et al.,, 2011) and the anisotropic state found near the Sun evolves towards a more isotropic state at 1 AU. On the other hand, approaches exploring anisotropy through the scale-dependent local mean magnetic field (e.g. Horbury et al.,, 2008, Podesta,, 2009, Wicks et al.,, 2010, Forman et al.,, 2011) indicate that the high-speed solar wind power spectrum is dominated by perpendicular “2D” fluctuations. Simulation results (Chen et al.,, 2011) show the same discrepancy between global and local mean magnetic field approaches and the authors conclude that the global mean magnetic field scaling is not able to properly discriminate between parallel and perpendicular fluctuations. Smith, (2003) shows that at high latitudes roughly equal proportions of “slab” (1D) and “2D” coexist in the same plasma element.
At solar minimum the solar wind is characterized by an increased recurrence of the high speed streams (up to 800 km/s and more), lower density and higher temperature, whose origin is the meridional extensions of the polar coronal holes. The properties of fast and slow wind turbulence were investigated for different phases of the solar cycle, from data recorded by Helios (Bavassano & Bruno,, 1989, 1991; Ruiz et al.,, 2011), ACE (Borovsky, 2012b, ), Ulysses (Yordanova et al,, 2009), Cluster and THEMIS (Weygand et al.,, 2011), Messenger and Wind (Bruno & Trenchi,, 2014; Bruno et al, 2014b, ). Observations of the solar wind by Ulysses at larger radial distances (between AU and AU), outside the ecliptic and close to the solar minimum show that the spectral index of the fast wind inertial range turbulence takes values in the range for the magnetic field components, and between for the total field, . The spectra of the slow wind exhibit similar power law behavior but with steeper slopes, for the components of the magnetic field and for the total field (Yordanova et al,, 2009). It is not clear whether the inertial range spans roughly the same frequency range for the fast and slow wind.
In-situ observations at 1 AU indicate that the median of the magnetic spectral index in the inertial range depends on the type of wind: it is shallower for the fast wind ( km/s), , compared to the slow wind, , as shown by Borovsky, 2012a from ten years of ACE data (1998-2008). The spectral index may take “extreme” values, larger than and smaller than . The steeper spectral slopes are observed at 1 AU when the solar wind density is larger, the temperature is smaller, the speed takes smaller values and the number of strong directional discontinuities is reduced (Borovsky, 2012a, ). Close to the high frequency limit of the inertial range, at proton scales, in the vicinity of the fluid/kinetic spectral break, WIND (at AU) and Messenger (at AU) data show that the spectral slope may depend on the power density in the inertial range: steeper slopes are observed for larger power in the inertial subrange (Bruno et al, 2014b, ). This frequency break moves towards smaller frequencies as the radial distance increases (Bruno & Trenchi,, 2014).
2 Spectral properties of fast and slow solar wind at AU
We analyze data recorded by Venus Express (VEX) in the solar wind, in the vicinity of Venus, at 0.72 AU, between January 2007 and December 2009, during the minimum of the solar cycle 24. Since Venus has no intrinsic magnetic field its induced magnetosphere is confined to shorter distances from the planet, thus VEX spends in the solar wind more than 20 hours each day of the year. Thus VEX is a unique solar wind monitor that investigates the inner heliospheric solar wind on a day to day basis for almost one solar cycle, since 2006. The turbulent fluctuations of the solar wind magnetic field considered in this study are provided by Venus Express Magnetometer, VEX-MAG, (Zhang et al.,, 2006)) with a cadence of 1 Hz. The data are obtained through an offline calibration procedure by donwsampling the 32 Hz resolution data.
The plasma state (electron and ion spectra and their moments, e.g. density, temperature, velocity) is investigated by the Analyzer of Space Plasma and Energetic Atoms (ASPERA, Barabash et al.,, 2007). ASPERA operates in the solar wind for short time intervals of the order of one to two hours, close to the orbit apogee. The ion and electron spectra and their moments are provided with a time resolution of 196 seconds which does not allow a spectral analysis of the solar wind plasma parameters. Nevertheless, the estimation of the moments of the ion velocity distribution function provides the data needed to select high and low speed solar wind. Inspired by previous studies, we select the slow and fast wind intervals based on a threshold speed value equal to km/s. The magnetic field experiment is operating continuously, however we consider time intervals of roughly four hours length, close to the VEX apogee and that include the time periods when ASPERA is also operating.
Additional constraints on the magnetic field data analysis are imposed by several quality checks. We disregard the time intervals shorter than one hour and that have data gaps whose largest size exceeds 30 consecutive points. In general, the total missing data points amount to less than 3% of the total number of samples for the selected time intervals and they appear to be randomly distributed over time. Thus, the number of data gaps in the selected time intervals is small and their length is short. A linear interpolation is applied prior to the spectral analysis. From a total of 1094 orbits between January 2007 and December 2009, only 204 time intervals fulfill the data quality requirements, of which 48 time intervals correspond to fast solar wind observations ( km/s).
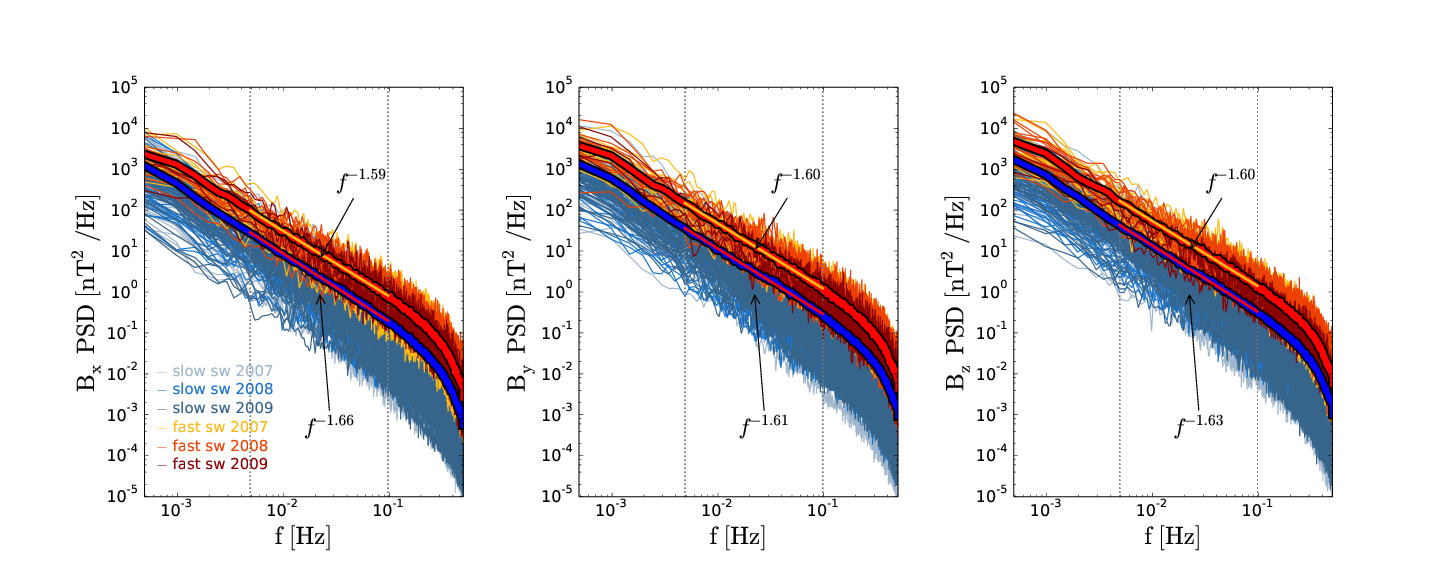
The magnetic field components are provided in the Venus Solar Orbital (VSO) rectangular frame, with the Ox axis aligned in the Sunward direction and the Oz axis perpendicular to the ecliptic plane, in the Northward direction. The PSDs are computed with a Welch algorithm (Welch,, 1967) of averaging periodograms applied on , , , and the total field, for all the selected time intervals. We also compute the trace of the spectral matrix of the fluctuations. A summary plot of all the power spectra is given in Fig. 1; different colors illustrate different types of wind (fast/slow) and different years. An average spectrum is computed as an ensemble average of all the spectra, for the fast and the slow solar wind, respectively.
The spectral power of fast solar wind is systematically larger than for slow wind as shown by previous results in other locations of the heliosphere (see the review by Bruno & Carbone,, 2013 and recent results at 0.38 AU and 1 AU by Bruno et al, 2014b, ). The power spectral densities exhibit a power law regime in the frequency range Hz. A change in the spectral slope is observed around 0.2-0.3 Hz, close to the local Doppler shifted proton gyrofrequency, followed by a frequency range showing a steepening of the spectra that could correspond to the lowest frequencies of the non-MHD kinetic turbulent cascade. In order to minimize the effect of inherent uneven sampling of the frequency range by the periodogram technique, the spectral index/slope has been computed from PSDs rebinned and averaged over equal logarithmic bins of frequency. In addition to the rebinning of the frequency range we have also searched for the existence of the power law behavior by varying the limits of the fitting frequency range. Thus for each of the power spectra the spectral index (or slope) is calculated by a linear least-square fitting over the interval Hz. This range would correspond to the high-frequency part of the inertial subrange at 0.72 AU and solar minimum. The amount of data intervals is sufficiently large to allow a statistical analysis of the distribution of the spectral indices obtained at solar minimum, between 2007 - 2009, as illustrated by Fig. 2.
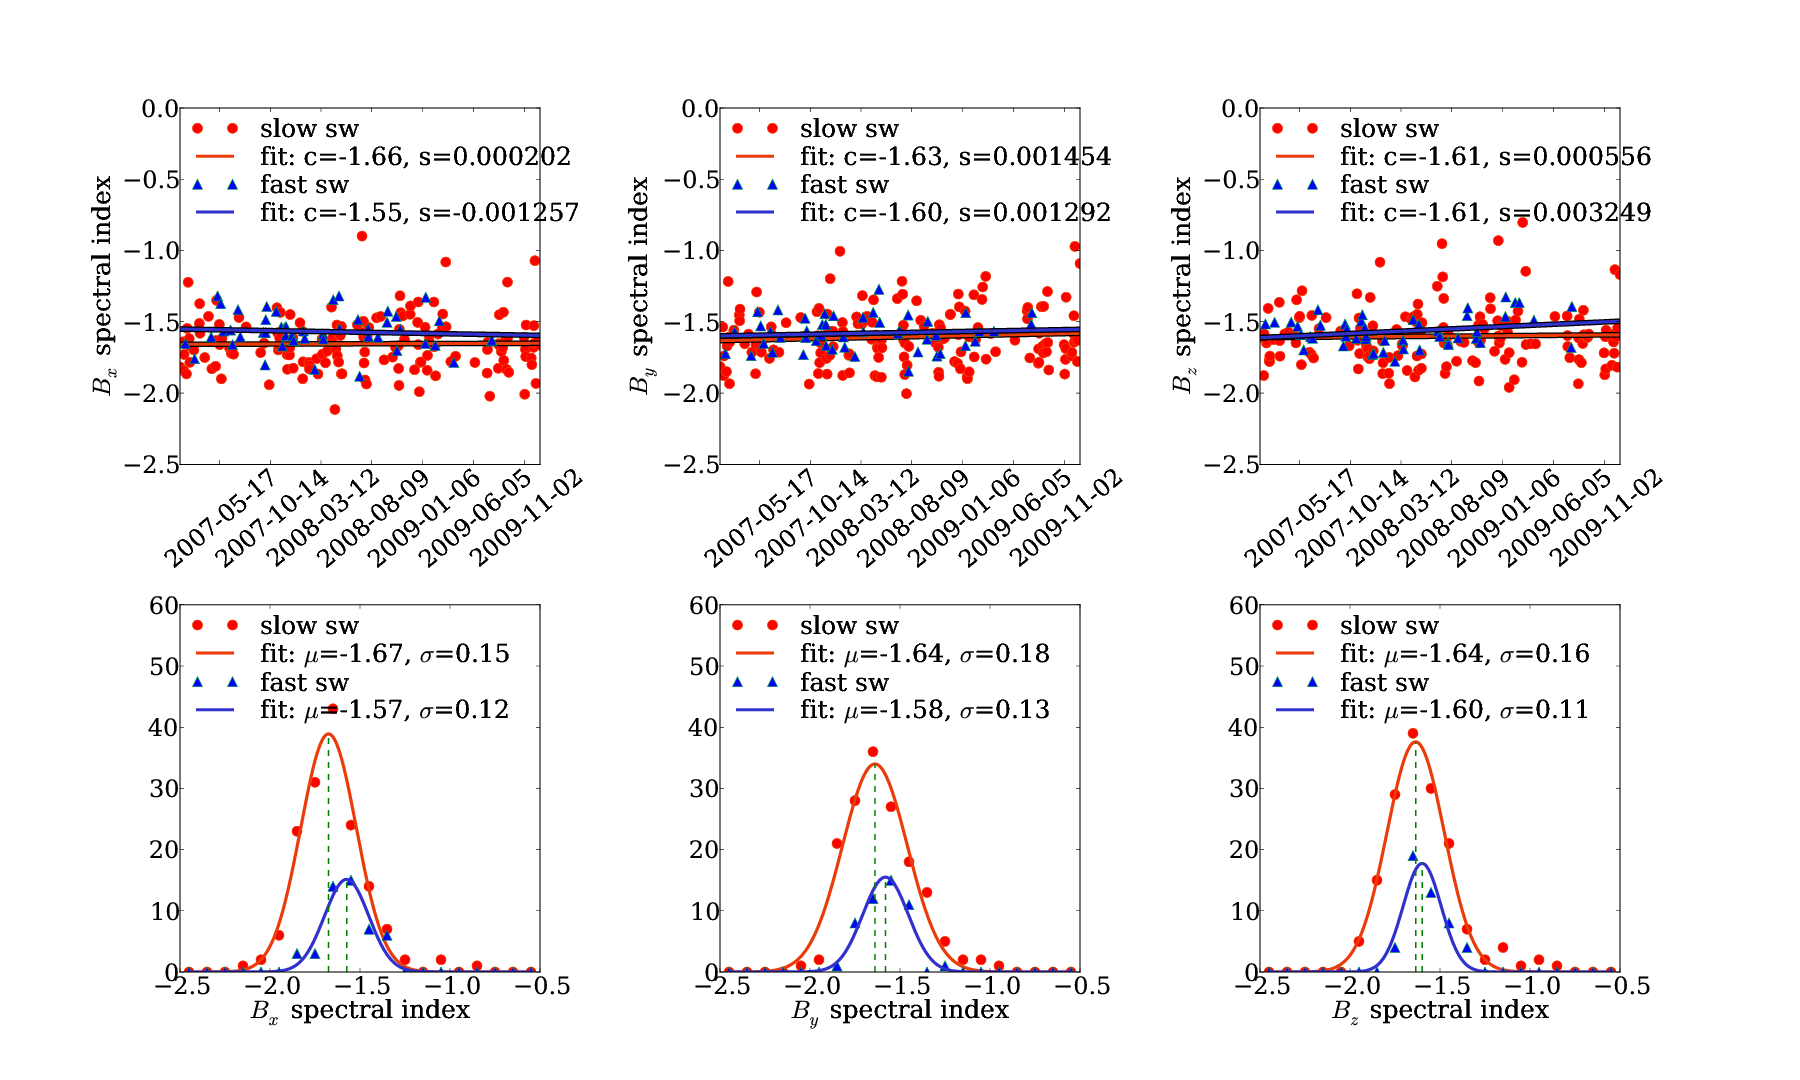
The a priori separation of fast from slow solar wind allows the independent and simultaneous tracking of the evolution of the spectral properties of turbulence for the two types of wind. The least-squares linear fitting of the distributions of the spectral slopes (upper panels of Fig. 2) yields an experimental evidence for the fact that the spectral indices do not exhibit any temporal trends over the years while the solar minimum deepens, both for slow and fast solar wind. This can be considered an indication that the processes that contribute to the power law scaling are mainly local, possibly related to non-linear interactions leading to turbulent transfer of the energy between scales. The histograms of the spectral indices show that the slopes of the magnetic field power spectra in the inertial range fit a Gaussian distribution, as seen in the lower row of plots in Fig. 2. The three components of the magnetic field exhibit different average spectral slopes for fast and slow wind: , , and respectively , , , where is the notation for the mean spectral index of the component and fast or slow type of wind. The mean spectral index of the trace of the spectral matrix (not shown) varies from in the fast wind to in the slow wind.
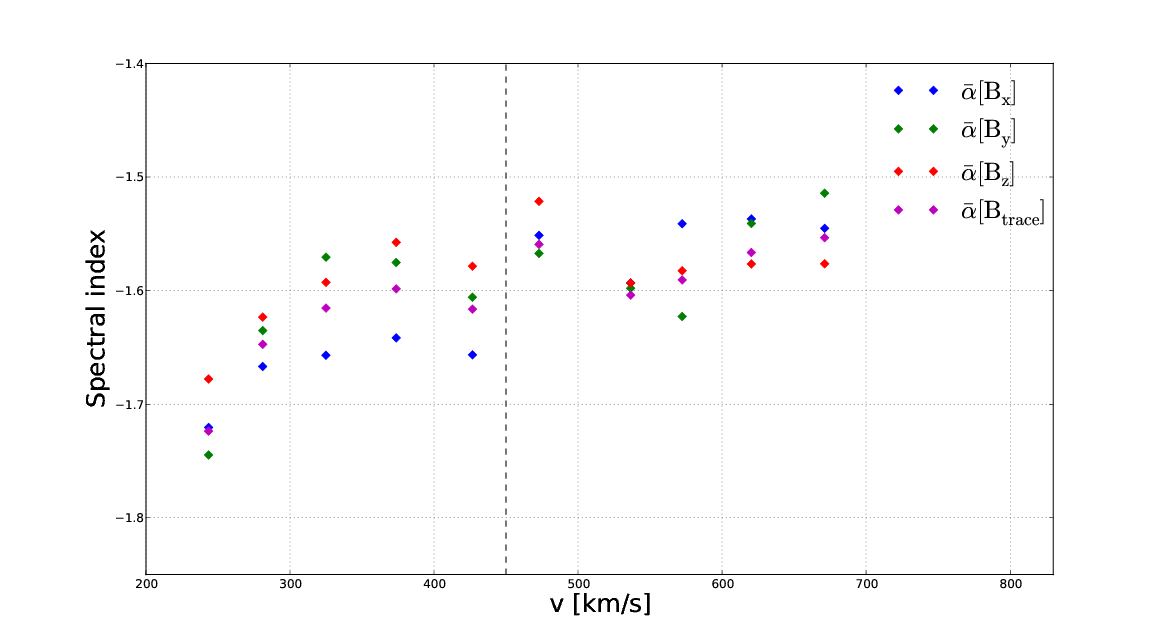
The variation of the spectral index as a function of the solar wind speed is shown in Fig. 3. The average spectral indices of the magnetic field become shallower with increasing plasma velocity which is in good agreement with previous work (Chen et al.,, 2013). The continuous trend also seems to indicate that the solar wind velocity may be a controlling parameter for the spectral slope. Nevertheless, recent studies indicate that cross-helicity is equally important in controlling the spectral behavior (Chen et al.,, 2013).
The Venus Express results show similarities with the spectral analysis of WIND magnetic field data at 1 AU, during roughly the same time interval, between June 2004 and April 2009. Data from WIND showed a mean spectral slope between (for wind speeds larger than km/s) to (for speeds smaller than km/s) (Chen et al.,, 2013). Another analysis of solar wind turbulence at 1 AU, based on ACE data recorded between 1998-2008, suggests a median spectral slope of the magnetic field equal to for speeds larger than km/s and respectively for speeds smaller than km/s (Borovsky, 2012a, ). Nevertheless, the Venus Express data suggest that in average the slope of the slow wind spectra are shallower at 0.72 AU than at 1 AU, while the fast wind shows in average comparable slopes. We note the differences between the mean spectral slopes of the three magnetic field components for slow wind conditions and roughly the same mean slope for fast wind. On the other hand more spectral power is observed for and components in fast wind. This is in agreement with expectations of finding more power on the perpendicular components than the parallel one as fast wind is more Alfvénic and Alfvénic fluctuations are mainly perpendicular to the local mean magnetic field and are not compressive. At 0.72 AU the Parker spiral (mean field) for fast (700km/s) solar wind would be around 24∘, not far from the X direction in the VSO reference system. Thus, more power should be expected on the Y and Z components of the magnetic field (Klein et al.,, 1993). The anisotropy will be the subject of a future study on the same dataset.
3 Discussion and Conclusions
We have investigated the spectral behavior of the solar wind magnetic field at 0.72 AU, for low solar activity, between 2007 and 2009, using data provided by Venus Express. The Power Spectral Densities of magnetic field components and the trace of the spectral matrix indicate that an inertial range of turbulence can be identified as a power-law behavior, in the fast and slow solar wind. More power is contained in the fast wind spectra that also exhibit shallower slopes than the slow wind. The mean value of the slope takes values around for the fast wind and respectively for the slow wind. Our results fully agree with general predictions found in literature about different spectral slopes of magnetic field fluctuations depending on solar wind conditions.
In particular, (Chen et al.,, 2013) clearly showed how the spectral index of magnetic field and velocity fluctuations depend on their Alfvénicity which can be expressed by the normalized cross-helicity . These authors, analysing 5 years of WIND data, found that as decreases, magnetic energy starts to dominate on kinetic energy and the magnetic field spectrum becomes steeper than velocity spectrum, in line with predictions (Müller & Grappin,, 2004), among others. The tendency for the magnetic spectrum to dominate over the kinetic one is a natural outcome for a stationary critically balanced MHD turbulence (Goldreich & Sridhar,, 1995) generated by non-linear interacting Alfvén waves (Gogoberidze et al.,, 2012). As a consequence, since we study fast and slow wind, which differ in Alfvénicity (Bruno & Carbone,, 2013), fast wind being more Alfvénic than slow wind, we should expect to find magnetic field spectra in fast wind less steep than those in slow wind. In addition, a comparison with similar data at 1 AU suggests that in average the spectra steepen while the slow solar wind is transported between 0.72 and 1 AU suggesting that non-linear interactions are at work. On the other hand, the fast wind exhibits less clear evidence of the radial steepening.
The solar wind magnetic field spectral indices between 2007 and 2009 have a normal distribution. We do not find a significant temporal trend of the slopes. The average spectral slopes of the three magnetic components suggest an anisotropic repartition of power. A change in the spectral slope is evidenced in the vicinity of the proton cyclotron radius, possibly associated to the transition from the inertial to the kinetic subrange.
Our results suggest that at 0.72 AU and solar minimum the slow wind exhibits in average a spectral behavior closer to the “” law with some differences between the mean slopes of the magnetic field components. Thus there are indications that the turbulence is anisotropic and models based on the isotropy hypothesis, like Kolmogorov and/or Iroshnickov-Kraichnan, are not applicable. Modern theories of anisotropic strong MHD turbulence (Goldreich & Sridhar,, 1995) predict that the perpendicular spectrum of turbulence may approach in some conditions the “” scaling. In the absence of resolute plasma measurements from VEX we can only suggest that the slow wind spectra are perhaps dominated by the perpendicular component. Nevertheless the ”younger” turbulence carried by the fast wind is described by shallower spectral slopes that show a tendency to approach asymptotically a “” power law. This could possibly signify that the structure of turbulence exhibits features consistent with models of anisotropic turbulence like in Boldyrev, ( 2006). In other words, our results may suggest that the slow wind at 0.72 AU and solar minimum is dominated by filament-like structures at the smallest scales (as suggested by Goldreich & Sridhar,, 1995), while the fast wind turbulence is dominated by the sheet-like structures, at the smallest scales (as suggested by Boldyrev,, 2006), possibly related to phenomenological turbulent features of the solar wind at the origin, in the corona.
References
- Alexandrova et al., (2009) Alexandrova, O., Saur, J., Lacombe, C., et al. 2009, PhRvL, 103, 16
- Alexandrova et al., (2013) Alexandrova, O., Chen, C. H. K., Sorriso-Valvo, L., Horbury T. S., Bale, S. D. 2013, SSRv, 178, 101
- Batchelor, (1970) Batchelor, G.K. 1970, The theory of homogeneous turbulence (U.K.: Cambridge University Press)
- Barabash et al., (2007) Barabash, S., J.-A. Sauvaud, H. Gunell, et al. 2007, P&SS 55, 1772
- Bavassano & Bruno, (1989) Bavassano, B., Bruno, R. 1989, JGR, 94, 168
- Bavassano & Bruno, (1991) Bavassano, B., Bruno, R. 1991, JGR, 96, 1737
- Boldyrev, (2006) Boldyrev, S. 2006, PRL, 96, 115002
- Borovsky, (2008) Borovsky, J. E. 2008, JGR, 113, A8
- (9) Borovsky, J. E. 2012a, JGR, 117, A5
- (10) Borovsky, J. E. 2012b, JGR, 117, A6
- Bruno & Carbone, (2013) Bruno, R., Carbone, V. 2013, LRSP, 10, 2
- Bruno et al., (2007) Bruno, R., D’Amicis, R., Bavassano, B., Carbone, V., Sorriso-Valvo, L. 2007, AnGeo, 25, 1913
- Bruno & Trenchi, (2014) Bruno, R., Trenchi, L. 2014a, ApJ, 787, 2, L24
- (14) Bruno, R., Trenchi, L., Telloni, D. 2014b, ApJ, 793, L15
- Coleman, (1968) Coleman, Paul J. Jr., 1968, ApJ, 153, 371
- Chen et al., (2011) Chen, C. H. K., Mallet, A., Yousef, T. A., Schekochihin, A. A. and Horbury, T. S. 2011, MNRAS, 415, 3219
- Chen et al., (2013) Chen, C. H. K., Bale, S. D., Salem, C. S., Maruca, B. A. 2013, ApJ, 770, 125
- Chen et al., (2014) Chen, C. H. K., Leung, L., Boldyrev, S., Maruca, B. A., Bale, S. D. 2014, GRL, 41, 8081
- Dasso et al., (2005) Dasso, S., Milano, L. J., Matthaeus, W. H., Smith, C. W. 2005, ApJ, 635, L181
- Gogoberidze et al., (2012) Gogoberidze, G., Chapman, S. C. and Hnat, B. 2012, PoP 19, 2310
- Goldreich & Sridhar, (1995) Goldreich, P. & Sridhar, S. 1995, ApJ, 438, 763
- Forman et al., (2011) Forman, M. A., Wicks, R. T., Horbury, T. S. 2011, ApJ, 733, 76
- Frisch, (1995) Frisch, U. 1995, Turbulence, (U.K.: Cambridge University Press)
- Horbury et al., (2008) Horbury, T. S., Forman, M., Oughton, S. 2008, PRL, 101, 175005
- Horbury et al., (2012) Horbury, T. S., Wicks, R. T., Chen, C. H. K. 2012, SSRv, 172, 325
- Kolmogorov, (1941) Kolmogorov, A. 1941, DoANT, 30, 301
- Klein et al., (1993) Klein, L., Bruno, R., Bavassano, B., Rosenbauer, H. 1993, JGR, 98, A10
- Leamon et al., (1999) Leamon, R.J., Smith, C.W., Ness, N.F., Wong, H.K. 1999, JGR, 104, 22331
- Marsch & Tu, (1990) Marsch, E.,Tu, C.-Y. 1990, JGR, 95, 11945
- Matthaeus & Goldstein, (1986) Matthaeus, W.H. and Goldstein, M.L. 1986, PhRvL, 57, 495
- Matthaeus et al., (1994) Matthaeus, W.H., Oughton, S., Pontius, Jr., D.H., Zhou, Y. 1994, JGR, 99, 19267
- Müller & Grappin, (2004) Müller, W.-C., Grappin, R. 2005, PRL 95, 114502
- Podesta, (2009) Podesta, J. J. 2009, ApJ, 698, 986
- Ruiz et al., (2011) Ruiz, M.E., Dasso, S., Matthaeus, W.H., Marsch, E., Weygand, J.M. 2011, JGR, 116, A10
- Smith, (2003) Smith, C. W. 2003, in AIP Conf. Proc. 679, Astronomy and Astrophysics, ed. M. Velli, R. Bruno, F. Malara (AIP), 413
- Tu & Marsch, (1995) Tu, C.-Y., Marsch, E. 1995, SSRv, 73, 1-2, 1-210
- Stawicki et al., (2001) Stawicki, O. Gary, S. P., Li, H. 2001, JGR, 106, A5, 8273
- Verdini et al., (2012) Verdini, A., Grappin, R., Pinto, R., Velli, M. 2012, ApJ, 750, 2, L33
- Weygand et al., (2011) Weygand, James M., Matthaeus, W. H., Dasso, S., Kivelson, M. G. 2011, JGR, 116, A8
- Welch, (1967) Welch, P.D. 1967, IEEE Trans. Audio Electroacoustics, AU-15, 70
- Wicks et al., (2010) Wicks, R. T., Horbury, T. S., Chen, C. H. K., Schekochihin, A. A. 2010, MNRAS 407, L31
- Yordanova et al, (2009) Yordanova, E., Balogh, A., Noullez, A., von Steiger, R. 2009, JGR, 114, A8
- Zhang et al., (2006) Zhang, T., Baumjohann, W., Delva, M., et al. 2006, P&SS, 54, 1336