Solar Sources of 3He-rich Solar Energetic Particle Events in Solar Cycle 24
Abstract
Using high-cadence extreme-ultraviolet (EUV) images obtained by the Atmospheric Imaging Assembly (AIA) on board the Solar Dynamics Observatory, we investigate the solar sources of 26 3He-rich solar energetic particle (SEP) events at 1 MeV nucleon-1 that were well-observed by the Advanced Composition Explorer during solar cycle 24. Identification of the solar sources is based on the association of 3He-rich events with type III radio bursts and electron events as observed by Wind. The source locations are further verified in EUV images from the Solar and Terrestrial Relations Observatory, which provides information on solar activities in the regions not visible from the Earth. Based on AIA observations, 3He-rich events are not only associated with coronal jets as emphasized in solar cycle 23 studies, but also with more spatially extended eruptions. The properties of the 3He-rich events do not appear to be strongly correlated with those of the source regions. As in the previous studies, the magnetic connection between the source region and the observer is not always reproduced adequately by the simple potential field source surface model combined with the Parker spiral. Instead, we find a broad longitudinal distribution of the source regions extending well beyond the west limb, with the longitude deviating significantly from that expected from the observed solar wind speed.
Subject headings:
Sun: flares — Sun: particle emission — Sun: UV radiation — Sun: magnetic fields — Sun: solar wind1. Introduction
Solar energetic particle (SEP) events are classified into two types, corresponding to different origins (Reames, 1999, 2013). Gradual SEP events, which can be intense enough to be space weather hazardous, are attributed to shock waves driven by fast and wide coronal mass ejections (CMEs) as supported by their close correlation (e.g. Kahler et al., 1984). Another class is often called “impulsive” and characterized first by anomalously enriched 3He and heavy ions. They have been known for a long time (e.g. Hsieh & Simpson, 1970), but the origin of 3He-rich SEP events is still not well-understood, although theoretical models on the basis of stochastic acceleration (e.g. Liu et al., 2006) have been developed.
One of the reasons why 3He-rich events still lack compelling explanation may be the difficulty of observing their sources in the corona. Unlike gradual SEP events, the association of 3He-rich events with CMEs is not high (Kahler et al., 1985, but see below for recent results). Until recently it has been generally believed that 3He-rich events could arise without detectable solar activities or be associated with minor flares or brightenings at most (Kahler et al., 1987; Reames et al., 1988).
During solar cycle 23, new studies have started to reveal the properties of solar activities that were possibly related to 3He-rich events, thanks to the uninterrupted full-disk images of the solar corona by the Solar and Heliospheric Observatory (SOHO). Using images from the Extreme-ultraviolet Imaging Telescope (EIT; Delaboudinière et al., 1995) and Large Angle Spectroscopic Coronagraph (LASCO; Brueckner et al., 1995), Wang et al. (2006b) reported on coronal jets (characterized by linear features) typically from coronal hole boundaries around the times of 25 3He-rich events. Some of these jets were seen to extend into the high corona and observed as narrow CMEs. Indeed, due largely to the high sensitivity of LASCO, the association of 3He-rich events with CMEs has become higher than that known earlier if we include these narrow CMEs (Kahler et al., 2001).
3He-rich events are most commonly observed at 1 MeV nucleon-1. These particles take several hours to travel to 1 AU, with a wide temporal spread depending on the effective path length that they traverse in interplanetary space. Therefore it is not straightforward to isolate the solar activities related to 3He enrichment. It has been known that 3He-rich events are often associated with type III bursts at 2 MHz (Reames & Stone, 1986) and 1 – 100 keV electron events (Reames et al., 1985). Using these two observables, Nitta et al. (2006) identified the solar sources of 69 discrete 3He-rich events, many of which were jets. However, they failed to find compelling solar activities for 20% of 3He-rich events even when they had good coverage of full-disk coronal images.
There are three possibilities for 3He-rich events without solar activities detectable in EUV and X-ray images. First, the acceleration and injection of 3He ions may not produce detectable EUV and X-ray emission, as could result, e.g., from flare-like processes that occur high up and leave no traces in the low corona (Cliver & Kahler, 1991). This scenario is similar to the one that was originally proposed for impulsive electron events whose power-law spectrum extended down to 2 keV (Potter et al., 1980). Second, the associated solar activities (such as jets) may last for too short a time to be detected by the EIT, which had typically a 12 m cadence. Lastly, the source region may be located on the far side and the processes responsible for 3He enrichment are limb-occulted.
The primary objective of this paper is to explore these possibilities using the new capabilities that have become available in solar cycle 24. The Atmospheric Imaging Assembly (AIA; Lemen et al., 2012) on the Solar Dynamics Observatory (SDO), which was launched in February 2010, takes full disk images every 12 seconds in a wide range of coronal to chromospheric temperatures. This is a significant improvement over the EIT whose high-rate (12 m) data were taken only in one wavelength. With AIA we can detect minor transient activities that are short-lived and in narrow temperature ranges. Furthermore, we now continuously observe the far side of the Sun as viewed from the Earth, using the EUV Imager (EUVI; Wuelser et al., 2004; Howard et al., 2008) on the Solar and Terrestrial Relations Observatory (STEREO), which consists of twin spacecraft that have separated from the Sun-Earth line with the rate of 22 a year since 2006. The EUVI has taken full-disk images with a typical 5 m (10 m) cadence in the 195 Å (304 Å) channel during the period that overlaps with the SDO. We can readily determine whether 3He-rich events without associated solar activities detected in near-Earth observations are attributable to activities behind the limb.
In the next section, we show how the 3He-rich events are selected and give a brief overview of their properties. Our procedure for finding the solar source is described in §3, using one of the selected events as an example. In §4, we show the results of the analysis of the entire sample of events. We discuss them in §5 in terms of the previous studies. A summary of the work is given in §6.
| Ratio | factor 2 | 3He | Observed | Ratio | ||
|---|---|---|---|---|---|---|
| 3He-rich | of | increase in | Spectral | by | of | |
| ID | Period | 3He/4HeaaIn the range of 0.5 – 2.0 MeV nucleon-1. | 3He/4HebbIn the range of 0.1 – 1.0 MeV nucleon-1. | FormccIn the range of 0.1 – 1.0 MeV nucleon-1. Power-Law (PL) or Curved (C). | SIS? | Fe/OddIn the range of 320 – 450 keV nucleon-1. |
| 1 | 2010 Oct 17 00:02 – Oct 19 18:00eeSingle 3He-enriched period for multiple type III bursts/electron events. | 0.790.07 | Yes | PL | Yes | 1.260.23 |
| 2010 Oct 19 18:00 – Oct 20 18:00 | 2.160.39 | Yes | C | Yes | 1.930.43 | |
| 2 | 2010 Nov 02 00:02 – Nov 03 23:57eeSingle 3He-enriched period for multiple type III bursts/electron events. | 1.370.10 | Yes | C | Yes | 0.910.32 |
| 3 | 2010 Nov 14 00:02 – Nov 17 12:00 | 0.250.03 | No | C | 1.220.18 | |
| 2010 Nov 17 15:00 – Nov 18 12:00 | 4.250.62 | Yes | C | 1.340.35 | ||
| 4 | 2011 Jan 27 12:00 – Jan 30 12:00eeSingle 3He-enriched period for multiple type III bursts/electron events. | 0.080.01 | No | PL | 1.130.17 | |
| 5 | 2011 Jul 07 18:00 – Jul 10 12:00eeSingle 3He-enriched period for multiple type III bursts/electron events. | 1.680.09 | Yes | C | Yes | 1.110.12 |
| 6 | 2011 Jul 31 21:00 – Aug 01 18:00 | 0.050.01 | No | PL | 2.660.45 | |
| 7 | 2011 Aug 26 00:01 – Aug 28 12:00 | 0.640.05 | Yes | C | 1.510.13 | |
| 8 | 2011 Dec 14 12:00 – Dec 15 23:57 | 0.180.02 | Yes | PL | Yes | 1.350.22 |
| 9 | 2011 Dec 24 18:00 – Dec 25 03:00 | 0.130.01 | Yes | PL | Yes | 1.440.26 |
| 10 | 2012 Jan 03 00:01 – Jan 04 06:00eeSingle 3He-enriched period for multiple type III bursts/electron events. | 0.080.01 | No | PL | 0.990.07 | |
| 11 | 2012 Jan 13 12:00 – Jan 14 23:56 | 1.350.14 | Yes | PL | Yes | 2.390.47 |
| 12 | 2012 May 14 12:00 – May 16 18:00 | 0.050.01 | Yes | PL | Yes | 0.400.04 |
| 13 | 2012 Jun 08 03:00 – Jun 09 18:00eeSingle 3He-enriched period for multiple type III bursts/electron events. | 0.360.03 | Yes | PL | Yes | 2.240.35 |
| 14 | 2012 Jul 03 00:00 – Jul 05 18:00eeSingle 3He-enriched period for multiple type III bursts/electron events. | 0.090.01 | No | PL | Yes | 1.100.10 |
| 15 | 2012 Nov 18 06:01 – Nov 20 06:00 | 0.550.07 | Yes | PL | 0.860.18 | |
| 2012 Nov 20 06:01 – Nov 21 03:00eeSingle 3He-enriched period for multiple type III bursts/electron events. | 6.890.71 | Yes | C | 1.060.19 | ||
| 16 | 2013 May 02 12:00 – May 04 06:00 | 0.210.03 | No | PL | 1.040.21 | |
| 17 | 2013 Jul 17 00:01 – Jul 18 12:00 | 0.390.03 | Yes | C | 0.860.18 | |
| 18 | 2013 Dec 24 00:01 – Dec 25 12:00 | 1.300.36 | Yes | PL | 2.330.86 | |
| 19 | 2014 Jan 01 06:00 – Jan 02 18:00 | 0.260.02 | Yes | C | Yes | 1.830.16 |
| 20 | 2014 Feb 06 00:01 – Feb 07 12:00 | 0.490.05 | Yes | C | 1.140.12 | |
| 21 | 2014 Mar 29 00:01 – Mar 30 23:56 | 0.170.02 | Yes | C | 0.360.07 | |
| 22 | 2014 Apr 17 22:20 – Apr 19 12:00 | 0.580.04 | No | PL | 1.370.12 | |
| 23 | 2014 Apr 24 00:01 – Apr 25 23:58 | 1.280.07 | Yes | C | Yes | 0.710.09 |
| 24 | 2014 May 04 09:00 – May 05 18:00 | 0.140.02 | Yes | PL | 0.740.11 | |
| 25 | 2014 May 16 06:00 – May 17 18:00 | 14.881.36 | Yes | C | Yes | 2.130.27 |
| 26 | 2014 May 29 03:00 – May 30 03:00 | 2.640.45 | Yes | C | 2.950.40 |
Note. —
2. Event Selection
The 3He-rich SEP events that we study in this paper are based on data from the Ultra Low Energy Isotope Spectrometer (ULEIS; Mason et al., 1998) on board the Advanced Composition Explorer (ACE). The ULEIS is a time-of-flight mass spectrometer with geometric factor of 1 cm2. We surveyed ULEIS data from May 2010 through May 2014, and selected 26 3He-rich events that showed either clear ion injections or clear 3He presence preceded by a 40 keV electron event that was detected by the Electron, Proton, and Alpha Monitor (Gold et al., 1998) on ACE. We also chose relatively intense events in terms of 3He yields so that we can derive the 3He spectrum in comparison with other ions, which may be important for identifying the right acceleration mechanisms (Mason et al., 2002).
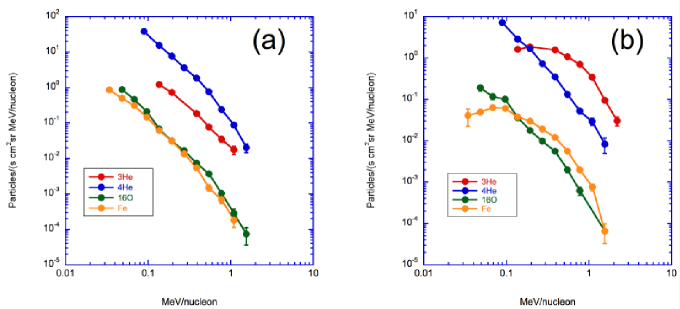
In Table 1, we list the selected 3He-rich events with basic information including the 3He/4He and Fe/O ratios. In the second column, the 3He-rich period is shown. Several events lasted longer than two days, comparable to the multiday events studied by Kocharov et al. (2008). These long-lasting 3He-rich periods may represent either continuous injections or smeared discrete injections. During the survey period we dropped some multiday 3He-rich events because they neither have clear ion injections nor an electron event. We subdivide the period of a long-duration event only when more than one injection are clearly identified. The third column is the 3He/4He ratio in the 0.5 – 2.0 MeV nucleon-1 range, which shows a wide variation from 0.05 to 15. In the next column we show whether more than a factor of two increase in the 3He/4He ratio is observed, measuring how strongly the 3He increase is correlated with 4He. Most events have this attribute. The 3He spectral shape in the range of 0.1 – 1.0 MeV nucleon-1 is given in the fifth column. It is nearly evenly distributed between power-law (PL) and curved (C) spectra. Figure 1 shows examples of the two types. The sixth column shows whether the 3He-rich event was observed at higher energies (4.5 MeV nucleon-1) by the Solar Isotope Spectrometer (SIS; Stone et al., 1998) on ACE. About one half of our events were also SIS events. The last column shows the Fe/O ratio, which ranges from 0.4 to 3, confirming that our 3He-rich events are also Fe-rich (Hurford et al., 1975; Mason et al., 1986).
3. Analysis – Finding Solar Sources of 3He-rich Events
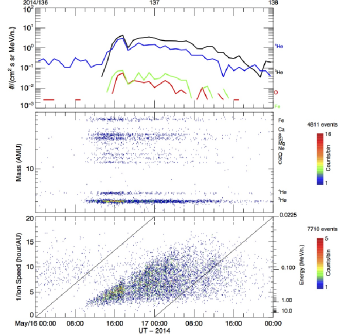
In this work we follow almost the same technique as Nitta et al. (2006), who connected 3He-rich events in solar cycle 23 with solar activities using type III bursts and electron events. We use Event 25 in Table 1 to illustrate how we identify the solar sources of 3He-rich events. This event has the highest 3He/4He ratio in our sample (Table 1). The 3He and Fe spectra are characteristically curved in the 0.1 – 1 MeV nucleon-1 range (see Figure 1(b)). We first find when 3He ions started to increase significantly. Figure 2 is a ULEIS multi-panel plot, which consists of (a) hourly average intensities for 3He, 4He, O and Fe ions for the energy range 0.23 – 0.32 MeV nucleon-1, (b) individual ion masses and arrival times for ions of energy 0.4 – 10 MeV nucleon-1, including ions from He to Fe and indicating clear separation of 3He from 4He, and (c) individual ion reciprocal speed (1/) and arrival time for ions with mass of 10 – 70 AMU. Four-day plots in this format are available at the ACE Science Center site111http://www.srl.caltech.edu/ACE/ASC/DATA/level3/index.html.
In this event, 3He ions started to increase around 10:00 UT on 2014 May 16 (Figure 2(b)). We also note velocity dispersion (Figure 2(c)), which could be used to determine the particle injection time and path length, assuming that (i) the first-arriving particles of all energies are injected at the same time and that (ii) they are scatter-free en route to 1 AU. The upper envelope of the apparent dispersion indicates the particle injection around 05 UT on May 16 . The calculated path length is 1.8 AU, considerably longer than 1.2 AU, which is indicated by the two oblique lines.
In this work, we do not utilize the information from ion velocity dispersion. First, the uncertainty in the injection time may be more than a few hours. Second, neither of the assumptions (i) and (ii) may be generally valid. Furthermore, only four other 3He-rich periods listed in Table 1 have the velocity dispersion as clear as this one. We instead take a more conservative approach to find the solar activity that possibly accounts for the 3He-rich event. That is, we use a type III burst and electron event in a long enough time window before the 3He onset in such a way that the presence of an electron event gives preference to the associated type III burst if there are more than one of them (see Nitta et al., 2006). Then we can determine the time of the solar activity related to the 3He-rich event to the accuracy of one minute. We set a window 1 – 7 hours prior to the 3He onset as indicated by the two lines in cyan. In this event, no major type III bursts are seen if we expand the window by five more hours (i.e., start of the window at 22:00 UT on May 15). Longer time windows are used for a majority of events without clear velocity dispersions.
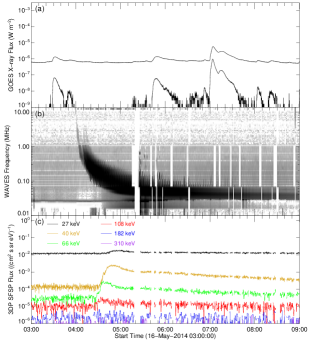
In Figure 3 we show GOES soft X-ray light curves, radio dynamic spectrum and electron time profiles for the time window indicated in Figure 2. The radio dynamic spectrum below 14 MHz is obtained by the Radio and Plasma Wave Experiment (WAVES; Bougeret et al., 1995), and the electron time profiles from the Three-dimensional Plasma and Energetic Particles instrument (3DP; Lin et al., 1995), both on the Wind spacecraft. Although Figure 3(c) is limited to electrons above 30 keV as detected by the solid-state telescope (SST), the 3DP consists also of the electron electrostatic analyzer (EESA) that observes 3 eV – 30 keV electrons. The combined SST and EESA data sometimes produce a clear velocity dispersion over a wide energy range (Wang et al., 2006a, 2012), which may be used to argue for the scatter-free nature of electron events. Although the EESA data did not rise above background in the interval of Figure 3 and therefore are not shown, their availability is one of the reasons we use 3DP data in this work.
In Figure 3(b) we find type III bursts between 04:00 – 04:16 UT. Figure 3(c) shows an electron event with velocity dispersion. It is delayed with respect to the start time of the type III by 15 minutes at the highest-energy channel (108 keV) that observes it. Figure 3(a) shows a C1.3222The peak flux of 1.3 W m-2 in the 1 – 8 Å channel of the GOES X-ray Spectrometer. A C-class flare has of 10-610-5 (W m-2). The M-class (B-class) is an order of magnitude higher (lower). flare that peaks at 03:32 UT, followed by a smaller flare that is better seen in the 0.5 – 4 Å channel. At first, we do not discard the possibility that these flares may be related to the type III bursts even though they are too widely separated in time. We note that the NOAA event list shows the C1.3 flare coming from AR 12053, which is clearly wrong because the region was already 20 behind the west limb. Therefore we need to examine full-disk images to locate them. AIA images in the 94 Å channel that has the peak temperature response around 7 – 8 MK show that they come primarily from AR 12063 (N10 E28) and secondarily from AR 12057 (N17 W40). Despite the effort to locate the minor flares, however, we find a distinctly new pattern after 04:00 UT, much closer in time to the type III bursts, which is a jet-like ejection in a quiescent region at S12 W44. This is clearly seen in AIA images in multiple channels for the next 15 minutes. We therefore consider this jet to be associated with the type III bursts and the 3He-rich event.
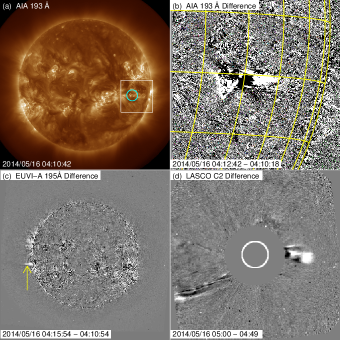
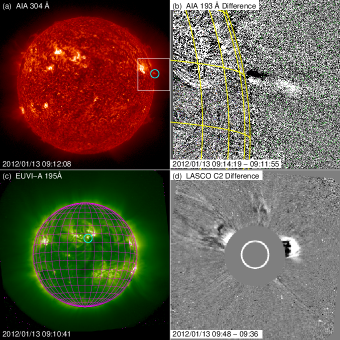
Figure 4(a) shows an AIA 193 Å full-disk image on which the location of the jet is encircled. An enlarged view of the jet is shown as a difference image in Figure 4(b). Its field-of-view is marked in Figure 4(a). The jet is extended both in time and space, and it would probably have been detected by EIT. As in previous studies (Wang et al., 2006b; Nitta et al., 2006, 2008), this jet is later identified as a relatively narrow CME (Figure 4(d)). The same jet also appears on the east limb in a STEREO-A EUVI difference image (Figure 4(c)). The footpoint of the jet should be at longitude of E114 as viewed from STEREO-A, which was then located at 158 west of the Sun-Earth line. In other events, the coronal signatures can be much weaker in the 193 Å channel than those in this event. Therefore we examine images in different channels and various forms, that is, intensity, running difference and ratio, and base (pre-event) difference and ratio, applying wide ranges of normalization factors.
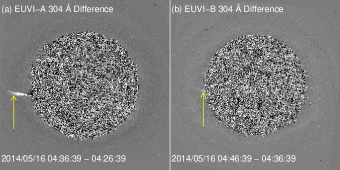
The lower part of this jet was more clearly observed later in 304 Å images (Figure 5) that primarily represent chromospheric temperatures. It is interesting to note that the jet is seen even from STEREO-B, for which the region’s longitude was E151 (see Figure 6). The corresponding occultation height is 1.08 R☉ from the photosphere. This example demonstrates that STEREO data are not only useful to confirm the locations of the solar activities associated with 3He-rich events, but also to determine their extensions in height.
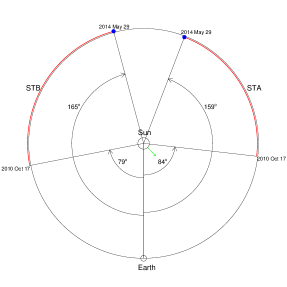
To further illustrate the unique information coming from STEREO observations, Figure 6 shows the locations of STEREO-A (STA) and STEREO-B (STB) during the survey period for the 3He-rich events studied in this paper. EUVI on STEREO-A unambiguously observed as disk events those that were behind the west limb as seen from Earth. Early in the period, events near central meridian in Earth view were observed as limb events by both STEREO. Toward the end of the period, STEREO-B observed western-hemisphere events as occulted by the east limb as was the case for Figure 5(b).
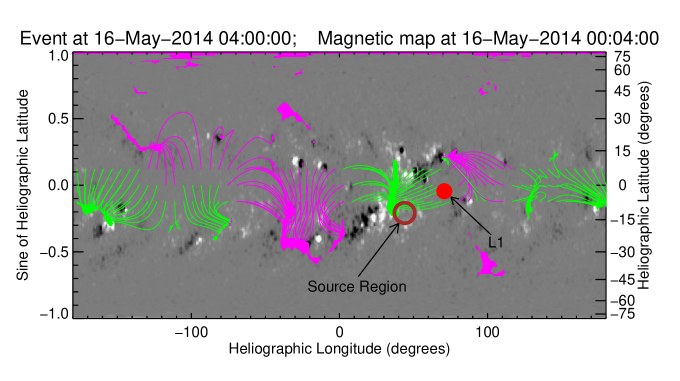
Now we study the source region of the 3He-rich event in terms of the global magnetic field that becomes part of solar wind sampled at 1 AU. In particular, we are interested in the relation of the source region with the open field lines that are connected to ACE, because the observed particles propagate along them. In Figure 7 we show the relation of the source region with the magnetic footprint of the observer at ACE, marked L1, in terms of computed open field lines. The grayscale image is a synoptic magnetic map, not in the usual Carrington coordinates, but in the Stonyhurst (Earth-view) coordinate systems, in which zero of the X-axis corresponds to zero heliographic longitude. The source region is plotted in its photospheric location, i.e. S12 W44, whereas the L1 symbol is in the projected location on the source surface (at 2.5 R☉ from the Sun center) of the foot-point of the field line that crosses L1. In order to obtain the latter, we assume the Parker spiral that corresponds to the observed solar wind speed averaged over 5 hours around the type III burst. The magnetic field is extrapolated from the photosphere, using the potential field source surface (PFSS) model.
Specifically, we base this study on the PFSS package in SolarSoft as implemented by Schrijver & DeRosa (2003), which includes updates of synoptic magnetic maps every 6 hours. They have equal-area pixels with the resolution of 1 deg2 at the equator. These maps are used as the lower boundary conditions for the PFSS extrapolation. They are constructed from (1) the longitudinal magnetograms taken by the Helioseismic and Magnetic Imager (HMI; Scherrer et al., 2012; Schou et al., 2012) for the area 60 from disk center, and (2) a flux transport model (Schrijver, 2001) for the remainder of the solar surface. Here we overplot coronal holes or contiguous open field regions as filled areas. They are color-coded depending on the polarity of the photospheric footpoint (green for positive and pink for negative). We use the same color code to show open field lines that reach the source surface at the ecliptic and 7 latitudes. We include the latter field lines to show the latitudinal uncertainties of the PFSS results (cf. Nitta & DeRosa, 2008).
In Event 25, the photospheric location of the jet is close to the coronal hole of positive polarity, and to open field lines that are connected to L1. This is discussed more quantitatively in the next section. The positive polarity of these open field lines is consistent with the observed polarity of the Interplanetary Magnetic Field (IMF) during the whole period of the 3He-rich event, and also with that indicated by the anisotropy of electrons observed in 3DP pitch-angle data. In this work, we examine solar wind data from Wind and ACE, not only to compare the polarities of the IMF and the source regions of the 3He-rich events, but also to identify interplanetary CMEs (ICMEs), corotating interaction regions and other non-steady structures that may modify the Sun-Earth magnetic field connections.
4. Results
| Onset TimesaaTime referred to 1 AU. | Source (Flare) | CME | Solar Wind | |||||||||||||
|---|---|---|---|---|---|---|---|---|---|---|---|---|---|---|---|---|
| ID | 3He Start | Type III | Electron | Flare | GOES | Loc. | Pol.bbPolarity of the source region, ‘-’, ‘+’ or ‘C’. ‘C’ stands for ‘closed’, meaning that the location has no open field lines within 20 heliographic coordinates. | Mot.ddCharacteristic motions seen in EUV images. J: jet, E: eruption, L: Large-scale coronal propagating front (EUV wave). | AWeeCME angular width in degrees. | ffCME plane-of-the-sky speed in km s-1. | ggSolar wind speed (protons) in km s-1. | Pol.hhPolarity of solar wind magnetic field during the electron and 3He-rich events. | ||||
| PFSSccMeasure of PFSS extrapolations, 1: best to 4: worst (see text). | ||||||||||||||||
| 1 | 2010 Oct 17 | Oct 17 08:55 | 09:10 | 08:52 | C1.7 | S18 W33 | C 2 | E | 54 | 304 | 383 | |||||
| Oct 19 06:48 | 07:05 | 06:45 | C1.3 | S18 W57 | C 4 | E | 77 | 385 | 406 | |||||||
| 2 | 2010 Nov 02 | Nov 02 07:28 | 07:55 | 07:26 | B1.9 | N20 W90 | 2 | L | 67 | 253 | 337 | |||||
| 3 | 2010 Nov 14 | Nov 13 23:52 | N | 23:50 | C1.1 | S23 W26 | 1 | E | 63 | 442 | 465 | |||||
| Nov 17 08:09 | 08:20 | 08:07 | B3.4 | S22 W72 | C 3 | J | 41 | 639 | 498 | |||||||
| 4 | 2011 Jan 27 | Jan 27 08:45 | 08:40 | 08:40 | B6.6 | N14 W80 | 1 | L | 52 | 316 | 304 | |||||
| 5 | 2011 Jul 07 | Jul 07 14:27 | 14:50 | 14:25 | B7.6 | N15 W91 | 1 | J | 33 | 715 | 348 | |||||
| 6 | 2011 Jul 31 | Jul 31 19:01 | 19:15 | 19:01 | C1.7 | N18 W51 | 1 | L | 47 | 280 | 659 | |||||
| 7 | 2011 Aug 26 | Aug 26 00:42 | 01:05 | 00:41 | B4.4 | N18 W62 | 1 | J | 26 | 305 | 422 | |||||
| 8 | 2011 Dec 14 | Dec 14 03:11 | 03:45 | 03:01 | C3.5 | S18 W86 | C 3 | E | 40 | 576 | 441 | |||||
| 9 | 2011 Dec 24 | Dec 24 11:58 | 12:15 | 11:20 | C4.9 | N16 W92 | 1 | E | 42 | 536 | 352 | |||||
| 10 | 2012 Jan 03 | Jan 03 01:51 | 02:10 | 01:40 | B5.0 | S20 W63 | 1 | J | 29 | 670 | 411 | |||||
| 11 | 2012 Jan 13 | Jan 13 09:08 | 09:20 | 09:10 | N | N16 W111 | 4 | J | 62 | 350 | 501 | |||||
| 12 | 2012 May 14 | May 14 09:35 | 09:55 | 09:35 | C2.5 | N08 W45 | 1 | E | 48 | 551 | 438 | |||||
| 13 | 2012 Jun 08 | Jun 08 07:15 | 07:45 | 07:11 | C4.8 | N13 W40 | 1 | L | 34 | 308 | 593 | |||||
| 14 | 2012 Jul 03 | Jul 02 18:04 | 18:45 | 18:03 | C4.5 | N16 W09 | 1 | J | N | N | 638 | |||||
| 15 | 2012 Nov 18 | Nov 18 04:00 | 04:30 | 03:55 | C5.7 | N08 W07 | C 4 | E | 29iiDerived using STEREO COR-1 data. | 49iiDerived using STEREO COR-1 data. | 407 | |||||
| Nov 20 01:30 | N | 01:31 | N | S17 W60 | C 2 | J | N | N | 390 | |||||||
| 16 | 2013 May 02 | May 02 04:55 | 05:25 | 04:58 | M1.1 | N10 W25 | 1 | E | 99 | 671 | 460 | |||||
| 17 | 2013 Jul 17 | Jul 16 20:21 | 20:35 | 20:18 | B1.8 | N21 W70 | C 4 | J | 21 | 270 | 349 | |||||
| 18 | 2013 Dec 24 | Dec 24 12:45 | 20:35 | 12:42 | C1.2 | S17 W92 | 1 | J | 21 | 270 | 285 | |||||
| 19 | 2014 Jan 01 | Jan 01 07:24 | 07:45 | 07:21 | C3.2 | S13 W47 | 1 | J | 185jjNot clear if the CME consists of a single eruption. | 465jjNot clear if the CME consists of a single eruption. | 375 | |||||
| 20 | 2014 Feb 06 | Feb 05 22:55 | 23:10 | 22:55 | N | S13 W84 | C 3 | J | N | N | 385 | |||||
| 21 | 2014 Mar 29 | Mar 28 21:00 | 21:15 | 20:57 | C1.0 | S17 W66 | C 3 | J | 10iiDerived using STEREO COR-1 data. | 314iiDerived using STEREO COR-1 data. | 427 | |||||
| 22 | 2014 Apr 17 | Apr 17 21:58 | 22:20 | 21:50 | C3.2 | S15 W24 | 1 | E | 119jjNot clear if the CME consists of a single eruption. | 824jjNot clear if the CME consists of a single eruption. | 388 | |||||
| 23 | 2014 Apr 24 | Apr 24 00:40kkTime from STEREO Waves (Bougeret et al., 2008). | 01:35 | 00:50 | N | S18 W102 | C 2 | E | 90 | 601 | 414 | |||||
| 24 | 2014 May 03 | May 03 20:16 | 21:00 | 20:18 | C1.8 | S11 W36 | 1 | E | 218jjNot clear if the CME consists of a single eruption. | 494jjNot clear if the CME consists of a single eruption. | 353 | |||||
| 25 | 2014 May 16 | May 16 03:57 | 04:25 | 20:18 | N | S12 W44 | 1 | J | 43 | 592 | 327 | |||||
| 26 | 2014 May 29 | May 29 02:37kkTime from STEREO Waves (Bougeret et al., 2008). | 03:00 | 02:50 | N | S14 W105 | 1 | E | 35 | 418 | 330 | |||||
Note. —
We perform the analysis described in the previous section for all the selected 3He-rich events. Table 2 gives the results. First of all, we always found at least one type III burst in a time window up to 10 hours before the observed 3He onset, confirming the excellent correlation between the two phenomena (see Nitta et al., 2006). Moreover, except for a few cases, there is no ambiguity finding the type III burst that appears to be associated with the 3He-rich event. Even when multiple type III bursts are present within the time window preceding a 3He-rich event (as identified by the subscript e in Table 1), they often share the same source region (e.g. Event 5, see Bučík et al., 2014). It is possible that they are all associated with the 3He-rich event. In such cases, Table 2 lists only a representative type III burst for each 3He-rich interval in Table 1.
Almost all the type III bursts accompany an electron event as in the fourth column, which may appear contradictory to Nitta et al. (2006), who found that 3He-rich events are much less frequently associated with electron events than with type III bursts (62% vs 95%.) However, this largely results from one of our selection criteria. Note that not all the electron events exhibit the velocity dispersion that points to a release time close to the type III burst. Some of them start long (e.g. 30 m) after the type III burst or flare, have gradual time profiles, or show no velocity dispersion. Although these properties may suggest their different origins, it is beyond the scope of this work to study electron events in detail.

The magnitude of the associated flare is given in the sixth column. Most events are associated with flares that are the GOES C-class or below. Some of the type III bursts have no associated GOES flare, labeled N (no flare). Events in this category tend to have high 3He/4He ratios as shown in Table 1 (e.g. Event 25 featured in § 3), which is consistent with earlier findings (see Reames et al., 1988). They also include some events with curved 3He spectrum.
The ninth column shows the characteristic motion of the solar activity possibly responsible for 3He-rich events. It is one of the three types (see Figure 8). If it contains linear features (see Figure 8(a)), we label it a jet (J). If it shows larger angular expanse, probably involving closed loop structures like CMEs that are not narrow (Figure 8(b)), it is labeled an eruption (E). The distinction between these two can be subjective and dependent on projection and observed temperatures. Lastly the motion may reach large distances (Figure 8(c)), which we classify as the EIT wave or large-scale coronal propagating front (LCPF, see Nitta et al., 2013). We label such an event L. We note that most events belong to either E or J with only a few showing large-scale motions. There is no clear correlation of these motions with the basic properties of 3He-rich events in Table 1, except that events with high 3He/4He ratios and curved 3He spectra are more often associated with jets.
Now we look at the association of 3He-rich events with CMEs whose angular width and velocity (in the plane of the sky) are given in the tenth and eleventh columns. They are mostly taken from the CDAW catalog333http://cdaw.gsfc.nasa.gov/CME_list/, but we also made independent identification and measurement for unclear cases. In addition, we examined data from the STEREO COR-1 and COR-2 coronagraphs (Howard et al., 2008) when no CMEs were found in LASCO data (e.g. Events 15 and 21). At first we expect CMEs to be influenced by the three types of coronal motions. For example, CMEs associated with an eruption may be wider than those associated with a jet. The same may be true for CMEs associated with a LCPF as compared with those that are associated with an eruption or a jet. Such expectations are not supported by the observed CME width. The CME velocity is also uncorrelated with the coronal motions. In short, we still do not understand the relation of 3He-rich events with CMEs, which often, but not always, accompany them and whose properties vary.

Next, we discuss where the 3He-rich events come from. The location of the source region is shown in the seventh column of Table 2. The 3He-rich events occurred predominantly in the northern hemisphere up to 2013, but all of the more recent events are in the southern hemisphere. This may simply reflect a larger number of active regions that emerged in the southern hemisphere during the period in question. An important result comes from the direct observation of regions behind the limb made possible by STEREO. We find three cases where the source region is more than 10 behind the limb. An example is shown in Figure 9 (Event 11). This event is actually preceded by a less intense 3He-rich period that lasts for 15 hours, but we study only the later event, which is more intense. About five hours before the 3He onset, we find a strong type III burst, which is observed at the highest frequency of WAVES even though it is limb-occulted as shown below. Around the time of the type III burst, we see a diffuse linear feature stick out of the limb (Figure 9(b)). Its associated brightening is readily located in an EUVI-A image to be N16 W04 (Figure 9(c)). Since STEREO-A was 107 west of the Sun-Earth line, we determine the source location to be N16 W111 as viewed from the Earth. With reference to the type III burst, the delay of the electron event is only 12 minutes. However, there is no velocity dispersion, and the time profiles are gradual.
The existence of such events naturally adds to the broad longitudinal distribution of 3He-rich events, which was already found by Wang et al. (2006b) and Nitta et al. (2006). In Figure 10, we show a scatter plot of the longitude of the source regions and the solar wind speed (the five hour average around the type III burst as shown in the twelfth column), in comparison with the earlier works. We confirm that the longitudinal distribution is broad, often far from the longitude of the nominal Parker spiral, which is farther from the west limb for faster solar wind as indicated by the curve in Figure 10. In this work, examples of the source longitude close to and behind the west limb are established for the first time by direct observations without extrapolating the longitudes found earlier.
Now we compare the polarities of the source regions (the eighth column) with those in-situ at L1 around the times of 3He-rich events (the thirteenth column). The latter is determined with respect to the Parker spiral for the observed solar wind speeds. We assign either positive (away) or negative (toward) polarity as long as the azimuth angle of the magnetic field measured at L1 is more than 15 from the normal to the Parker spiral. In reality we find that the observed field is often far from the Parker spiral (cf. Luhmann et al., 1993). The polarity of the source region is less straightforward, since the region may not have a dominant polarity. We conduct PFSS extrapolations to find if the region contains open field lines with the same polarity. In several regions we find no open field lines within a 20 heliographic distance, in which case we put C (closed) in the eighth column. When open field lines are identified in or near the source region, the polarities generally match at the Sun and L1.
Following Nitta et al. (2006), we also grade the performance of field line tracing on the basis of the PFSS model and Parker spiral, respectively, within and beyond the source surface. We trace field lines from the source surface to the photosphere. Given the uncertainty in the IMF, we include field lines that are within 7.5 and 2.5, respectively, from the longitude and latitude of the footpoint of the Parker spiral that intersects L1. We trace about 2000 field lines downward that are uniformly distributed in the above longitudinal and latitudinal ranges on the source surface. Our grading is 1 (best) to 4 (worst) depending on the minimum distance () of the footpoints of the traced field lines to the source region: 1 if , 2 if , 3 if and 4 if . The results shown in the eighth column are consistent with those by Nitta et al. (2006). This simply represents the status of how we model the Sun-Earth magnetic field connection. The results may not improve drastically with state-of-the-art numerical models rather than the simple PFSS Parker spiral model (MacNeice et al., 2011), as long as the lower boundary conditions are set by the photospheric magnetic maps, only about 1/3 of which reflect direct observations.
5. Discussion
In this paper we use SDO/AIA data to identify the solar sources of 3He-rich SEP events, which have been known to be weak in terms of coronal signatures. The significantly improved quality of AIA images do reveal a much larger number of weak transients than did previous instruments (e.g. EIT). Although it is possible that EIT missed many weak and short-lived transients, AIA data present another challenge of identifying the activity responsible for a given 3He-rich SEP event from among the numerous other activities that are occurring here and there all the time. Fortunately, we know that type III bursts are highly associated with 3He-rich SEP events (Reames & Stone, 1986; Nitta et al., 2006). They let us narrow down the time range in which we need to examine images, and it turns out to be relatively easy to find the solar activity associated with the type III burst. We also use the association of electron events as a selection criterion because of their known correlation with 3He-rich events (Reames et al., 1985).
We need to ask how valid is our approach that assumes that type III bursts (and electron events to some extent) are a progenitor of 3He-rich events. Type III bursts often accompany large gradual SEP events (Cane et al., 2002). Many of them are better seen at low frequencies, e.g. below 1 MHz, and delayed with respect to the associated gradual flare. But there are others that start at the beginning of the associated impulsive flare and are seen at the highest frequency of WAVES. It is true that the appearances of type III bursts and electron events alone do not distinguish between impulsive (3He-rich) and gradual SEP events. However, the regions that produce large CMEs responsible for gradual events tend to be different from the regions that produce smaller activities responsible for 3He-rich events. It is usually trivial to separate them in EUV images.
A lingering puzzle in the sources of 3He-rich events is the height of the acceleration process in the corona. There is strong evidence that the ionization state of the ions is caused by passage through coronal material, and this requires a low coronal source (e.g. Klecker et al., 2006; Kartavykh et al., 2007; Dröge et al., 2006). However, simple models have shown that the low energy ions in these events are injected about 1 hour later than the electrons, suggesting a high coronal source. We have examined the five events in Table 1 (Nos. 6, 9, 20, 25 and 26) that have clear velocity dispersion such as shown in Figure 2, and found that fits to the onset profiles yield ion injection times about 2 hours later than the electron onset times shown in Table 2, roughly consistent with earlier work. Such simple fits assume that there is no scattering during transport from the Sun, and this may not be the case for these ions. Sáiz et al. (2005) have discussed how interplanetary scattering can be present and yet still produce a clear velocity dispersion pattern at 1 AU where the path length traveled is not the IMF length but rather the IMF length divided by the average pitch cosine for the particles. Their model investigation showed how this can produce inferred injection times significantly later than the actual injection time.
In this study we find 3He-rich events produced by solar eruptions that are not necessarily jets. However, none of these eruptions are very energetic CMEs like those that often accompany large gradual SEP events. Furthermore, it is possible that the jet, even though it is present, can be overlooked when the primary activity is a wider eruption. Models have been developed to explain particle escape, which accommodate both jets and flux ropes (Masson et al., 2013). One of the surprises may be the involvement of EUV waves or LCPFs (Figure 8(c)), which used to be connected to large CMEs. For larger, gradual SEP events attempts have been made to reproduce the SEP onset behavior in terms of the injection as the LCPF intersects the footpoint of the field line that crosses the observer (e.g. Krucker et al., 1999; Rouillard et al., 2011, 2012). Here we suggest the possibility that LCPFs may play a role in 3He-rich events observed at widely separate longitudes (Wiedenbeck et al., 2013) because several examples in Wiedenbeck et al. also accompany LCPFs including the solar minimum event (on 2008 November 4) discussed by Mason et al. (2009) and our event 2. LCPFs may also lead to injection of particles in an open field region away from the flare site (Krucker et al., 1999), which may be closed. Again, we point out that even those LCPFs could start off as jets. The event shown in Figure 8(c) is such an example.
Figure 10 shows the longitude and solar wind speed distributions for the events in Table 1, along with previous recent studies by Wang et al. (2006b) and Nitta et al. (2006). The distribution is very wide, covering more than the entire western hemisphere. This contrasts with the earlier view (Reames, 1999) that these events had western hemisphere source locations peaked near W60 that varied due to solar wind speed, with some additional broadening from magnetic field line random walk. The more sensitive observations of recent years show that this is not the case: there is little evidence in Figure 10 of the expected correlation between source longitude and solar wind speed. For the events in Table 2, the correlation coefficient between source location and solar wind speed is -0.36. The p-value of 0.05 indicates that this is a statistically significant correlation for 29 events (including a second injection in three of the 26 events), but it is clear that solar wind speed does not dominate the variations in source longitude. Recent multi-spacecraft studies have shown that some 3He-rich events are observed over very wide longitude ranges (Wiedenbeck et al., 2013).
Giacalone & Jokipii (2012) have shown that perpendicular transport combined with field line meandering may produce significant transport of particles over wide longitudinal ranges, but it is not clear if such models can reproduce the observed onset timing. These problems combined with the limited success of the PFSS model in predicting other properties such as field polarity or even connection to known 3He-rich event sources (e.g. Mason et al., 2009) suggest that the difficulties encountered here are due at least partly to an insufficiently realistic model of the coronal magnetic field. Recent models (S-web) with more sophisticated approaches (e.g. Antiochos et al., 2011; Linker et al., 2011) regarding solar wind sources have shown that relatively small regions on the Sun can be magnetically connected to large regions in the inner heliosphere, as would be required to explain the energetic particle observations discussed here. These new models require large computational resources so it is not a simple matter to test them against a set of events such as studied here.
Comparison of Tables 1 and 2 shows that 3He-rich events with high 3He/4He ratios and curved 3He spectrum tend to be associated with weak of no GOES flares. Moreover, they are more frequently associated with jets than those that have power-law spectra. However, the correlation is not strong, and we need a larger sample to verify it.
6. Conclusions
Using high-cadence AIA images in combination with EUVI images for areas not viewed from Earth, we have identified the source regions of 26 3He-rich SEP events in solar cycle 24, and classified the activity at their source. Combined with prior work the basic properties of these sources can be summarized as follows:
-
1.
We confirm the previously identified association of these events with type III radio bursts and electron events.
-
2.
Solar activity at the source locations is generally weak in terms of soft X-ray flux, and can be associated with a variety of motions such as small eruptions, jets, and large-scale coronal propagating fronts.
-
3.
The broad longitudinal distribution of sources is not consistent with simple Parker spiral, nor with Parker spiral plus PFSS modeling of the coronal magnetic field. The actual magnetic connection between the sources and IMF may be much broader.
-
4.
Besides these clear associations the correlation is not strong between the properties of the solar sources and the energetic ions such as 3He/4He ratio or spectral form.
Given the extremely high sensitivity of the AIA and ACE measurements, it is likely that inner solar system measurements from upcoming missions will be needed to settle many of the observational ambiguities not resolved by the currently available data.
References
- Antiochos et al. (2011) Antiochos, S. K., Mikić, Z., Titov, V. S., Lionello, R., & Linker, J. A. 2011, ApJ, 731, 112
- Bougeret et al. (1995) Bougeret, J.-L., Kaiser, M. L., Kellogg, P. J., et al. 1995, Space Sci. Rev., 71, 231
- Bougeret et al. (2008) Bougeret, J. L., Goetz, K., Kaiser, M. L., et al. 2008, Space Sci. Rev., 136, 487
- Brueckner et al. (1995) Brueckner, G. E., Howard, R. A., Koomen, M. J., et al. 1995, Sol. Phys., 162, 357
- Bučík et al. (2014) Bučík, R., Innes, D. E., Mall, U., et al. 2014, ApJ, 786, 71
- Cane et al. (2002) Cane, H. V., Erickson, W. C., & Prestage, N. P. 2002, JGRA, 107, 1315
- Cliver & Kahler (1991) Cliver, E., & Kahler, S. 1991, ApJ, 366, L91
- Delaboudinière et al. (1995) Delaboudinière, J.-P., Artzner, G. E., Brunaud, J., et al. 1995, Sol. Phys., 162, 291
- Dröge et al. (2006) Dröge, W., Kartavykh, Y. Y., Klecker, B., & Mason, G. M. 2006, ApJ, 645, 1516
- Giacalone & Jokipii (2012) Giacalone, J., & Jokipii, J. R. 2012, ApJ, 751, L33
- Gold et al. (1998) Gold, R. E., Krimigis, S. M., Hawkins, III, S. E., et al. 1998, Space Sci. Rev., 86, 541
- Howard et al. (2008) Howard, R. A., Moses, J. D., Vourlidas, A., et al. 2008, Space Sci. Rev., 136, 67
- Hsieh & Simpson (1970) Hsieh, K. C., & Simpson, J. A. 1970, ApJ, 162, L191
- Hurford et al. (1975) Hurford, G. J., Mewaldt, R. A., Stone, E. C., & Vogt, R. E. 1975, ApJ, 201, L95
- Kahler et al. (1985) Kahler, S., Reames, D. V., Sheeley, Jr., N. R., et al. 1985, ApJ, 290, 742
- Kahler et al. (1987) Kahler, S. W., Lin, R. P., Reames, D. V., Stone, R. G., & Liggett, M. 1987, Sol. Phys., 107, 385
- Kahler et al. (2001) Kahler, S. W., Reames, D. V., & Sheeley, Jr., N. R. 2001, ApJ, 562, 558
- Kahler et al. (1984) Kahler, S. W., Sheeley, Jr., N. R., Howard, R. A., et al. 1984, J. Geophys. Res., 89, 9683
- Kartavykh et al. (2007) Kartavykh, Y. Y., Dröge, W., Klecker, B., et al. 2007, ApJ, 671, 947
- Klecker et al. (2006) Klecker, B., Kunow, H., Cane, H. V., et al. 2006, Space Sci. Rev., 123, 217
- Kocharov et al. (2008) Kocharov, L., Laivola, J., Mason, G. M., Didkovsky, L., & Judge, D. L. 2008, ApJS, 176, 497
- Krucker et al. (1999) Krucker, S., Larson, D. E., Lin, R. P., & Thompson, B. J. 1999, ApJ, 519, 864
- Lemen et al. (2012) Lemen, J. R., Title, A. M., Akin, D. J., et al. 2012, Sol. Phys., 275, 17
- Lin et al. (1995) Lin, R. P., Anderson, K. A., Ashford, S., et al. 1995, Space Sci. Rev., 71, 125
- Linker et al. (2011) Linker, J. A., Lionello, R., Mikić, Z., Titov, V. S., & Antiochos, S. K. 2011, ApJ, 731, 110
- Liu et al. (2006) Liu, S., Petrosian, V., & Mason, G. M. 2006, ApJ, 636, 462
- Luhmann et al. (1993) Luhmann, J. G., Zhang, T.-L., Petrinec, S. M., et al. 1993, J. Geophys. Res., 98, 5559
- MacNeice et al. (2011) MacNeice, P., Elliott, B., & Acebal, A. 2011, Space Weather, 9, 10003
- Mason et al. (2009) Mason, G. M., Nitta, N. V., Cohen, C. M. S., & Wiedenbeck, M. E. 2009, ApJ, 700, L56
- Mason et al. (1986) Mason, G. M., Reames, D. V., von Rosenvinge, T. T., Klecker, B., & Hovestadt, D. 1986, ApJ, 303, 849
- Mason et al. (1998) Mason, G. M., Gold, R. E., Krimigis, S. M., et al. 1998, Space Sci. Rev., 86, 409
- Mason et al. (2002) Mason, G. M., Wiedenbeck, M. E., Miller, J. A., et al. 2002, ApJ, 574, 1039
- Masson et al. (2013) Masson, S., Antiochos, S. K., & DeVore, C. R. 2013, ApJ, 771, 82
- Nitta & DeRosa (2008) Nitta, N. V., & DeRosa, M. L. 2008, ApJ, 673, L207
- Nitta et al. (2008) Nitta, N. V., Mason, G. M., Wiedenbeck, M. E., et al. 2008, ApJ, 675, L125
- Nitta et al. (2006) Nitta, N. V., Reames, D. V., De Rosa, M. L., et al. 2006, ApJ, 650, 438
- Nitta et al. (2013) Nitta, N. V., Schrijver, C. J., Title, A. M., & Liu, W. 2013, ApJ, 776, 58
- Potter et al. (1980) Potter, D. W., Lin, R. P., & Anderson, K. A. 1980, ApJ, 236, L97
- Reames (1999) Reames, D. V. 1999, Space Sci. Rev., 90, 413
- Reames (2013) —. 2013, Space Sci. Rev., 175, 53
- Reames et al. (1988) Reames, D. V., Dennis, B. R., Stone, R. G., & Lin, R. P. 1988, ApJ, 327, 998
- Reames & Stone (1986) Reames, D. V., & Stone, R. G. 1986, ApJ, 308, 902
- Reames et al. (1985) Reames, D. V., von Rosenvinge, T. T., & Lin, R. P. 1985, ApJ, 292, 716
- Rouillard et al. (2011) Rouillard, A. P., Odstrčil, D., Sheeley, N. R., et al. 2011, ApJ, 735, 7
- Rouillard et al. (2012) Rouillard, A. P., Sheeley, N. R., Tylka, A., et al. 2012, ApJ, 752, 44
- Sáiz et al. (2005) Sáiz, A., Evenson, P., Ruffolo, D., & Bieber, J. W. 2005, ApJ, 626, 1131
- Scherrer et al. (2012) Scherrer, P. H., Schou, J., Bush, R. I., et al. 2012, Sol. Phys., 275, 207
- Schou et al. (2012) Schou, J., Scherrer, P. H., Bush, R. I., et al. 2012, Sol. Phys., 275, 229
- Schrijver (2001) Schrijver, C. J. 2001, ApJ, 547, 475
- Schrijver & DeRosa (2003) Schrijver, C. J., & DeRosa, M. L. 2003, Sol. Phys., 212, 165
- Stone et al. (1998) Stone, E. C., Cohen, C. M. S., Cook, W. R., et al. 1998, Space Sci. Rev., 86, 357
- Wang et al. (2006a) Wang, L., Lin, R. P., Krucker, S., & Gosling, J. T. 2006a, Geophys. Res. Lett., 33, 3106
- Wang et al. (2012) Wang, L., Lin, R. P., Krucker, S., & Mason, G. M. 2012, ApJ, 759, 69
- Wang et al. (2006b) Wang, Y.-M., Pick, M., & Mason, G. M. 2006b, ApJ, 639, 495
- Wiedenbeck et al. (2013) Wiedenbeck, M. E., Mason, G. M., Cohen, C. M. S., et al. 2013, ApJ, 762, 54
- Wuelser et al. (2004) Wuelser, J.-P., Lemen, J. R., Tarbell, T. D., et al. 2004, in Society of Photo-Optical Instrumentation Engineers (SPIE) Conference Series, Vol. 5171, Telescopes and Instrumentation for Solar Astrophysics, ed. S. Fineschi & M. A. Gummin, 111–122