PASA \jyear2024
Lyman alpha Emitting Galaxies in the Nearby Universe
Abstract
The Lyman alpha emission line (Ly) of neutral hydrogen (Hi) is intrinsically the brightest emission feature in the spectrum of astrophysical nebulae, making it a very attractive observational feature with which to survey galaxies. Moreover as an ultraviolet (UV) resonance line, Ly possesses several unique characteristics that make it useful to study the properties of the interstellar medium (ISM) and ionizing stellar population at all cosmic epochs. In this review I present a summary of Ly observations of galaxies in the nearby universe. By UV continuum selection, at the magnitudes reachable with current facilities, only % of the local galaxy population shows a Ly equivalent width () that exceeds 20 Å. This fraction increases dramatically at higher redshifts, but only in the local universe can we study galaxies in detail and assemble unprecedented multi-wavelength datasets. I discuss many local Ly observations, showing that when galaxies show net Ly emission, they ubiquitously also produce large-scale halos of scattered Ly, that dominate the integrated luminosity. Concerning global measurements, we discuss how and the Ly escape fraction () are higher ( Å and %) in galaxies that represent the less massive and younger end of the distribution for local objects. This is connected with various properties, such that Ly-emitting galaxies have lower metal abundances (median value of ) and dust reddening. However, the presence of galactic outflows/winds is also vital to Doppler shift the Ly line out of resonance with the atomic gas, as high is found only among galaxies with winds faster than km s-1. The empirical evidence is then assembled into a coherent picture, and the requirement for star formation driven feedback is discussed in the context of an evolutionary sequence where the ISM is accelerated and/or subject to hydrodynamical instabilities, which reduce the scattering of Ly. Concluding remarks take the form of perspectives upon future developments, and the most pressing questions that can be answered by observation.
doi:
10.1017/pas.2024.2014keywords:
Galaxies: evolution –– Galaxies: starburst –– Physical data and processes: radiative transfer — Ultraviolet: galaxies — Galaxies: individual: Haro 11; iZw 18; SBS 0335–052; Haro 2; Mrk 701; IRAS 08208+2816; ESO 338-IG04.1 INTRODUCTION
The Lyman alpha (Ly) emission line of atomic hydrogen (Hi) is intrinsically the most luminous spectral emission feature in astrophysical nebulae. It is produced by the spontaneous decay from the first excited state to the ground state (, where is the principle quantum number), where the energy difference between the levels dictates a photon energy of 10.2 eV, or wavelength Å. After the capture of an electron in ionized gas, the transition probabilities of the following radiative cascade are such that 68% of recombinations involve the production of a Ly photon (Dijkstra, 2014). Thus if all ionizing photons had an energy slightly above the ionization edge of Hi, % of the total ionizing energy would be reprocessed into the Ly line. Because the line may be intrinsically so luminous, Ly was initially proposed as the spectral beacon by which to identify the first generations of primeval galaxies almost five decades ago (Partridge & Peebles, 1967).
Ly plays a pivotal role in contemporary astrophysics, where it is used to identify high-redshift () star-forming galaxies by either narrowband filter observations or spectroscopic techniques, and frequently to confirm the redshift of candidate galaxies selected by other methods. Indeed the recognition that Ly observations have attained makes the detection of Ly a primary science goal for many new instruments on large telescopes: first light has recently been seen by HyperSuprime Cam (HSC, Takada, 2010) at the Subaru Telescope, the Multi Unit Spectroscopic Explorer (MUSE, Bacon et al., 2010) at ESO’s Very Large Telescope, and the Cosmic Web Imager (CWI, Martin et al., 2010) at Palomar. Furthermore, the Hobby Eberly Dark Energy EXperiment (HETDEX, Hill et al., 2008) will find on the order of Ly galaxies, and Ly detection is among the science goals for spectroscopic instruments on the James Webb Space Telescope (JWST) and all plans for Extremely Large Telescopes (ELTs).
The above introductory paragraphs on Ly production are incomplete. While Ly forms in astrophysical nebulae at the stated intensities, the transition is a resonant one, and Ly is also absorbed by Hi in the same transition. After absorption to the level (in the absence of electron collisions), there is is no alternative but for the electron to de-excite through Ly. The optical depth of Hi, as seen in the core of the absorption line, is given by , where is the temperature of the gas and the column density in cm-2 (Verhamme et al., 2006). Thus at the limiting temperatures to which hydrogen can remain neutral, Hi becomes optically thick to Ly at cm-2. Assuming a number density of 1 atom per cubic cm, a cloud will exceed when its diameter exceeds pc, or just 2 AU. Taking the Milky Way as an example, there are very few sightlines through which drops below cm-2 (Kalberla et al., 2005), implying that Ly would almost always see upwards of optical depths.
The upshot is that in most galaxies, Ly undergoes a radiative transfer process: photons scatter until they either escape from the galaxy or are absorbed by a dust grain, and dust extinction is also strongest in the far UV. This transfer may be thought of as a diffusion-like process, where photons take random walks in both physical and frequency space (Osterbrock, 1962). The path taken by Ly is entirely regulated by the distribution of Hi that it encounters and must traverse, which in turn determines the likelihood that Ly will encounter dust. Fortunately Ly may see a significantly lower optical depth if it is shifted in frequency or the Hi is moving; the former can occur either after many scattering events as it diffuses in frequency through the redistribution profile, or by scattering in Hi that is itself kinematically offset from the Hii media where the Ly formed. Ultimately the emitted Ly luminosity (also its EW and departure from intrinsic Ly/H ratio of 8.7) will be a function of Hi distribution, gas kinematics, dust content, and galaxy viewing angle.
1.1 Key Applications of Lyman alpha
Ly transfer makes it hard to interpret the observed Ly flux and EW from an individual galaxy, because the escape fraction, , is difficult to predict for given configuration. However the transfer process, and the sensitivity of Ly to different ISM properties, is also one of the major advantages of the transition. I now outline some key applications.
The Evolution of Galaxies. The fraction of galaxies with Å (the canonical definition of a Ly-emitter, LAE), at absolute UV magnitudes brighter than –18, is just 5% in the nearby universe (Cowie et al., 2010), where LAEs are rare. However this fraction increases strongly with increasing redshift, to % at (Shapley et al., 2003) to over 50% at (Stark et al., 2010; Curtis-Lake et al., 2012). evolves even more strongly over the same redshift range (Hayes et al., 2011; Blanc et al., 2011). This monotonic evolution, that spans a factor of 100 in , is a key result of many Ly surveys but has no conclusive explanation. Dust and Hi covering have both been suggested, and the answer must indeed lie among the quantities mentioned above, or combinations thereof, in the co-evolving properties of stars, gas and dust.
The Epoch of Reionization. Ly emission offers a unique opportunity to study the ionization state of intergalactic medium (IGM) at an epoch where other methods – e.g. the Gunn-Peterson trough in QSO spectra and Thompson scattering of the cosmic microwave background (CMB) – are insensitive. The Ly emitter fraction and evolution discussed above reverses after , decreasing to % (e.g. Pentericci et al., 2014) at . Possible interpretations include an increase in the ionizing photon escape fraction (Dijkstra & Jeeson-Daniel, 2013, which is anyway needed for reionization), but also that and increasingly neutral IGM starts to absorb the Ly produced by the galaxies themselves. Disentangling the scenarios requires more information and solid constraints on the reionization history and topology require much larger samples (e.g. Jensen et al., 2014), but these will become available in the coming years with HSC. Moreover, as the IGM becomes neutral, the damping wing of Hi Ly absorption may begin to affect the profile shape of the Ly line that is transmitted, giving Ly another unique application.
Galaxy Kinematics. Ly scatters coherently in the restframe of the Hi atom, and at scattering events is shifted in frequency by the velocity of the scattering medium. Thus as Ly may escape from galaxies because of frequency shifts, the kinematic structure of the atomic gas becomes imprinted onto the line. This manifests as both a redshift (for outflowing gas) of the centroid of the main emission peak (e.g. Hashimoto et al., 2013) and also as characteristic features that modify the shape of the line profile (e.g. Verhamme et al., 2008). While there are many probes of kinematics in astrophysics, nebular line kinematics exclusively traces the warm ionized medium. Ly kinematics on the other hand is shaped by kinematic differences between Hii (production) and Hi (scattering) media. Moreover Ly is intrinsically very bright, and can be seen redshifted from the most distant galaxies. This again provides unique insights into the evolution of the ISM of galaxies, which can only feasibly be done with Ly.
Atomic Gas Surrounding Galaxies. As well as modifying the line profile, scattering also changes the surface brightness profile of emitted Ly (Steidel et al., 2011; Hayes et al., 2013). The mechanisms by which galaxies obtain the gas they need to fuel star formation is one of the most pressing issues in extragalactic science (e.g. Kereš et al., 2005; Dekel et al., 2009), and necessitates a knowledge of the Hi distribution outside of star-forming regions and into the circumgalactic medium (CGM). Probing this circumgalactic Hi is observationally very challenging. In principle it can be done by cm observations of Hi directly, but current telescopes cannot push such techniques beyond the very local universe. An alternative is to use absorption spectroscopy of background QSOs that pierce galaxy halos at different impact factors, enabling us to measure Hi temperatures, densities and kinematics (e.g. Lanzetta et al., 1995; Tumlinson et al., 2013; Danforth et al., 2014). Unfortunately appropriately bright QSOs are rare and thus studies, while rich with information, are limited to statistical studies of the average galaxy. A promising third method is to illuminate the circumgalactic Hi with Ly produced in the central star-forming regions. Indeed Ly is perfect for such an application, being both the brightest intrinsic emission line, and being resonant in precisely the medium we need in order to image the CGM.
1.2 Lyman alpha Observations of the Nearby Universe – This Review
Section 1.1 presents the main astrophysical applications of Ly emission, both as a diagnostic of the galaxies themselves and the IGM. The key difficulties of observing high- galaxies are that fluxes are low and high signal-to-noise data are hard to obtain, that spatial information is minimal or absent, and that important features are redshifted away from atmospheric transmission windows. In the local universe surface brightness is higher by a factor of , and spatial sampling can become almost arbitrarily high. Moreover, only in the local universe can we assemble the complete set of multi-wavelength observations, including but not limited to, all the continuum bands that probe both hot and cold stars, emission lines that provide a wealth of intrinsic diagnostics of the nebulae in which Ly forms, direct measurements of far infrared continuum for both hot and cold dust, direct Hi measurements at cm, X-ray observations of coronal gas, and many more.
Indeed the science objectives discussed in Section 1.1 can, with the exception of reionization, all be undertaken in the low- universe. Here Ly provides a unique suite of information about the ISM of galaxies that still cannot be extracted using other techniques. This makes Ly an import observable to obtain in any thorough study of (particularly star-forming) local galaxies. Moreover the question can be inverted: when as much information on the dust and gas content (distribution, kinematics, etc) has been assembled, observations of Ly can then be used to calibrate our understanding of the Ly transport mechanisms, and the effects of dust, gas, star-formation evolutionary stage may all be disentangled. This is the way, for example, we will assemble the relevant knowledge to interpret the evolution of the Ly fraction with redshift. In turn we will be able to calibrate Ly for high- galaxy surveys, which will soon deliver million objects, by using local Ly emitters as analogues – laboratories in which to dissect in detail the processes ongoing in high- systems. Local Ly observations will allow us to read kinematic information off the line profile and conversely to predict the flux, EW, and line profile shapes, precisely as needed to address topics such as cosmic reionization that really hinge upon knowing the spectral profile. Indeed this is one of the major legacies established by our ultraviolet satellites; the only difficulties are that such satellites are both expensive and competitive.
This review focuses mainly upon empirical studies of Ly emission and
absorption in star-forming galaxies in the local universe. Somewhat
arbitrarily, I have defined the ‘local universe’ to mean redshifts where
space-based facilities are needed to observe Ly. In principle this means
or so, but the most distant samples discussed are at ,
and thus we are considering roughly the latter half of cosmic time. Where
appropriate I may concentrate upon what about galaxies teach us about Ly, or
about what Ly teaches us about galaxies. The layout of the remainder is as
follows:
In Section 3 I present a brief history of Ly observations in the local universe, which were ongoing at a time when the first
generations of high- searches were also beginning. This concerns the first
vacuum UV observations of active galactic nuclei (AGN) and star-forming galaxies
using low dispersion spectrographs.
In Section 4 we discuss how the Hubble Space
Telescope changed the landscape by providing high-resolution spectra that can
resolve the Ly feature and interstellar absorption lines, thereby probing
atomic gas kinematics and covering.
Section 5 is concerned with Ly imaging
observations, also from HST, that simultaneously resolve very fine structures
and reveal large-scale, diffuse Ly halos.
In Section 6 I present a large number of key results
from survey data, that aim to answer questions about how various globally
measured properties influence Ly emission and under what conditions Ly can
be expected to be bright.
These
Sections 3–6 aim to establish empirically
how we have arrived at the current state-of-the-art.
In Section 7 I then synthesize all the observational
data from the previous Sections, and introduce some more speculative discussion
about how various processes fit together.
Finally I do not present explicit conclusions, but close the review in
Section 8 with a number of perspectives and pressing open
questions. These are concerned future observations and uses of Ly at both
low- and intermediate-, with a view to understanding galaxy formation.
2 LYMAN ALPHA OBSERVABLES
The literature makes use of several observable quantities that pertain to Ly, that often are specific to how much escapes or aim to illustrate how ‘strong’ the feature is. This Section summarizes some of these quantities and conventions, and lists several caveats that may be considered while reading.
2.1 Flux, Luminosity, and Equivalent Width
Ly is mainly produced by recombinations in photoionized nebulae, where under standard Case B assumptions 68% of ionizing photons absorbed by hydrogen are reprocessed into Ly in the following radiative cascade (See Dijkstra 2014 for an intuitive explanation). For continuously star-forming galaxies, with constant star formation rate (SFR), the Ly equivalent width (EW) ranges between Å. For very young systems the EW peaks around 300Å (Charlot & Fall, 1993), while very high EWs that exceed 1000 Å may in principle be expected for very low metallicity, population iii stellar systems (Schaerer, 2003; Raiter et al., 2010). Naturally if the SFR is declining the intrinsic Ly EW may take any value less than these, and it is worth noting that for a simple stellar population (SSP), exceeds 20 Å only during the first 6 Myr (Leitherer et al., 1999).
Measuring the flux and EW of most emission lines is straightforward. However for Ly this is not necessarily so and these quantities may depend upon both methodology and definition. As a resonant transition, both nebular Ly and continuum radiation with wavelength Å may be absorbed by Hi. Depending upon the column density, this absorption may reach equivalent widths of several tens of Å, which is a substantial fraction of the nebular flux. Fluxes measured in a given aperture may or may not be reduced by this amount. Narrowband imaging, for example, needs to be continuum-subtracted and therefore measures the sum of nebular emission and absorption. Spectroscopic observations, on the other hand, may enable the observer to isolate the components and separate nebular emission from ISM absorption, should this be the goal of the measurement. However even with in spectroscopic mode isolating the emission-only flux depends upon the spectral resolution, and the separation will be much easier with high-resolution slit spectrographs than low-resolution survey telescopes.
Not only is Ly absorbed in the ISM but also, depending on temperature and the properties of their winds, in the atmospheres of stars. For the hottest O stars Ly EWs may be negligible, but as the population ages or the star formation rate declines, the dominant source of UV continuum will shift to progressively cooler stars. Valls-Gabaud (1993) showed that Ly measurements from some local galaxies may be subject to significant uncertainties from stellar absorption, and recent models by Peña-Guerrero & Leitherer (2013) demonstrate that stellar Ly absorption may reach EWs of Å. For example, the effect of stellar absorption may also vary from O-star dominated systems where the nebular EW is high and the stellar feature is negligible, to later B-star systems where the reverse is true. The stellar feature may therefore shorten the timescale over which an episode of star-formation remains bright in Ly, and the effect may even be seen on resolved scales within a galaxy.
2.2 Ly/Balmer Ratios and Escape Fraction
Equivalent widths have the advantage that only a short range in wavelength is needed to make the measurement, over which the effects of interstellar dust (reddening curve, total extinction) should have a negligible effect. As discussed above, the evolutionary phase of star formation dominates the intrinsic EW. Ly/Balmer line ratios, however, may also be used as a measure of the strength of Ly, and because the intrinsic ratios are limited to a narrow range of values, have other advantages. For example the H line (Å) is a well-known, calibrated tracer of current star-formation activity in nearby galaxies (e.g. Kennicutt, 1983). For Case B nebulae at temperatures in the range 5,000–20,000 K and electron density in the range – cm-3, the Ly/H ratio ranges between 8.1 and 11.6 (Hummer & Storey, 1987). Thus deviations from the intrinsic line ratios encode information about the Hi scattering and dust absorption. While different authors do tend to adopt slightly different values, the range of permitted values is relatively narrow. For this review we will adopt the value of Ly/H, which for K gas corresponds to cm-3, and as a convention can be traced back to at least Hu et al. (1998).
Frequently we make reference to the Ly escape fraction (), in an effort to find a quantity that most closely reflects the combined impact that gas and dust have on suppressing the emission line. We define as the ratio of the emitted Ly luminosity to that intrinsically produced, but naturally a number of assumptions can enter our estimates of the intrinsic value. The most robust estimates of will naturally come from comparing Ly with other hydrogen recombination lines, where in practice H is the strongest and easiest to observe. Assuming that H is unobscured, will simply be the observed Ly/H ratio divided by its intrinsic case B value (8.7 as mentioned above). Of course H can also be significantly absorbed by dust, and in local ‘normal’ galaxies suffers about 1 magnitude of extinction on average (Kennicutt & Kent, 1983). Obviously redder hydrogen lines would be better as they suffer less extinction but also become systematically weaker in flux, and become harder to observe in the near infrared. Radio recombination lines would be optimal, suffering no extinction at all, but are even more challenging to observe beyond the very local universe. Thus often the best route to is to dust-correct H using the H line, which should recover all the star formation down to moderate optical depths (Hayes et al., 2005; Atek et al., 2009a). However when H becomes very optically thick, in very dusty star-forming galaxies (e.g. Martin et al., 2015), even dust-corrected H traces only a small fraction of the true ionized gas, making the inferred escape fraction prone to strong biases. In such instances, one may do better by comparing the Ly-derived SFR with that estimated from dust emission in the FIR, under the assumption that systematic errors on the SFR calibrations are smaller than the fraction of H that is recoverable. In the highest optical depth regimes this is probably true.
3 THE FIRST LOW REDSHIFT LYMAN ALPHA OBSERVATIONS
The major contributing observatories in this field are just three: the International Ultraviolet Explorer (IUE), the Hubble Space Telescope (HST), and the Galaxy Evolution Explorer (GALEX), while piecemeal observations have been contributed by other telescopes. Restframe FUV observations began with the IUE in 1977, HST started operation just 13 years later and is still returning Ly data at some 25 years on; the demarcation between history and present is arbitrary of course. For the sake of this review, I will adopt the pre-HST era, which is almost exclusively the IUE and thus is also restricted by method to spectrophotometry of pre-selected targets. In the ‘modern’ era we then have two main operational tools. Firstly HST, which like IUE performs pointed observations of individual targets, but in doing so yields data that are always rich with features since both spatial and spectral resolutions are significantly higher. Secondly, the GALEX satellite is similar to the IUE in resolving power but its strength comes instead from its 1.2 degree field of view, which provided the survey efficiency to yield the statistical significance that was not available at low- with any other telescope.
3.1 The First Ly Spectra of Active Galactic Nuclei
Even before IUE some extragalactic objects were observed with sounding rocket experiments, which were able to launch small UV telescopes above enough of the atmosphere to observe in the UV. Specifically targeting the first known quasar 3C 273, rocket payloads provided the first measurement of Ly and Balmer emission lines from any astrophysical body (Davidsen et al., 1977). Combining the measured Ly flux with optical measurements revealed a Ly/H ratio of 4, a measurement that then sat in stark contrast to the value of that was expected for nebular recombinations and a Ly enhancement from collisions. In 1977 Davidsen et al. discussed the order-of-magnitude Ly deficit with the following statement:
The most obvious explanation, that the ultraviolet lines are attenuated by absorption by dust similar to that observed in the interstellar medium, seems untenable in view of observations of Paschen that indicate the hydrogen lines are unreddened. But, dust which is distributed within the line-emitting gas might destroy L without having much affect on the Balmer and Paschen lines if the nebula has high optical depth to L photons.
[ …]
Whatever mechanism is at work, an understanding of the reduced Ly/H ratio may lead to a vastly improved knowledge of the physical conditions in QSO envelopes.
While this review is not focused upon QSOs, replacing “QSO” with “galaxy” in this statement comes precisely to the point. Today Ly observations play a major role in understanding the interstellar and circumgalactic media of galaxies at effectively all redshifts.
The 1978 launch of IUE opened up the restframe UV to systematic study. IUE had a single 20′′10′′ entrance aperture and Short and Long-Wavelength Prime channels (SWP and LWP, respectively) that could provide spectroscopy between 1150 and 3000 Å. First observations were again turned to QSOs and various Seyfert galaxies, and immediately showed Ly to be weaker than expected for recombination theory, with Ly/H and H/H values almost never falling along characteristic reddening curves, and Ly always being preferentially suppressed (Oke & Zimmerman, 1979; Wu et al., 1980; Lacy et al., 1982). Interpretations varied, with suggestions that multiple scatterings of Ly could be responsible, that broad-line regions experience a wide variation in their extinction laws, ionization/excitation from already-excited states, and that there may be no representative intrinsic spectral shape for Seyfert galaxies (Wu et al., 1980). Indeed Lacy et al. (1982) concluded that the low observed Ly fluxes were likely the result of a combination of reddening, high densities, and high Hi optical depth. All these effects conspire in the same direction but as no single dominant quantities could be identified, it started to become clear that Ly transfer in true astrophysical objects is a complicated multi-parametric process.
3.2 Star-forming Galaxies
When IUE was first turned to star-forming galaxies, the results directly mirrored those obtained in both nearby QSOs and also those being reported from high- blind narrowband and spectroscopic surveys (see Pritchet, 1994, for a review, and the forthcoming PASA review in this series by S. Malhotra): Ly was either absent or unexpectedly weak in all galaxies.
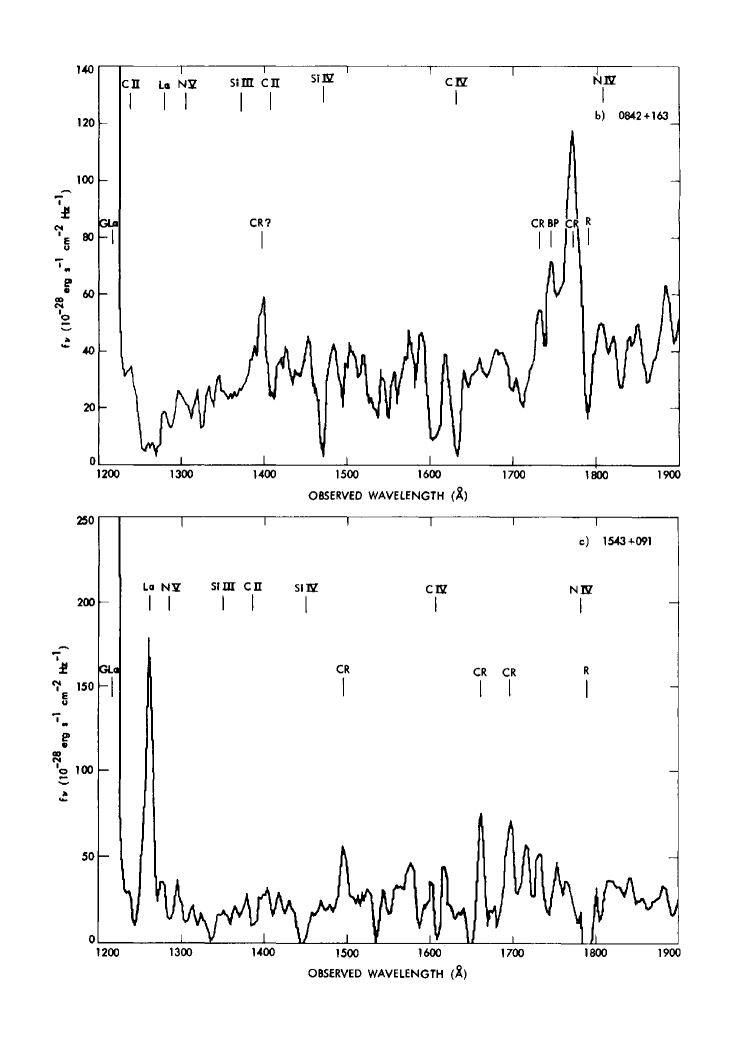
With the intent of studying the analogues of primeval galaxies at high-, Meier & Terlevich (1981) found Ly in emission from just one of three nearby Hii-selected galaxies, and in that single case with a flux well below that expected for the nebular dust content (Figure 1). This led them to conclude that under normal conditions, Ly emission would be an unlikely phenomenon. It was determined that if a normal prescription for dust attenuation were used to explain the Ly/H ratio, this would greatly over-predict the H/H ratio compared to observation. Similar conclusions were reached by Hartmann et al. (1984), who furthered the discussion, showing how a mixed medium of Hi and dust could preferentially suppress Ly, and that static Hi columns of density above cm-2 would be needed to reconcile the line ratios. Further, they raised the issue that, where Hi 21 cm data are available, most blue compact galaxies (BCGs) are found to sit inside extended Hi halos of sufficient column density to reproduce the measured fluxes. All signs pointed towards the fact Ly emission would not be the good observational beacon to identify primeval galaxies in the early universe that Partridge & Peebles (1967) had predicted.
While the influence of Hi on Ly visibility was starting to be seen empirically, some correlation with the dust abundance should still be expected, albeit with a large spread. After subsequent data acquisition, the anticorrelation between Ly EW and gas-phase metallicity () was discovered (Hartmann et al., 1988; Calzetti & Kinney, 1992; Terlevich et al., 1993; Charlot & Fall, 1993), seemingly confirming the prediction. However the spread on the relation was worryingly large, and it was clear that something beyond variations in the extinction law (e.g. Valls-Gabaud, 1993) were behind the wide range of line ratios, with ISM geometry and holes being the most often cited scenarios.
Giavalisco et al. (1996) performed a full reanalysis of the IUE archival data, resulting in several changes. Firstly the IUE data reduction software reached a higher level of maturity, and new spectral extraction and cosmic-ray removal tools were implemented: this reduced the measured significantly in about half the sample, and completely removed the weak Ly feature that had been reported in some galaxies. Secondly, these authors performed proper spatial matching between the IUE and apertures used for optical line spectroscopy. When the homogenized reanalysis was complete, both the and Ly/Balmer line ratios showed no significant correlation with nebular dust attenuation or the UV continuum colour (), and only a weak but significant correlation with nebular oxygen abundance. Results concerning the Ly/H line ratios can be seen Figure 2.
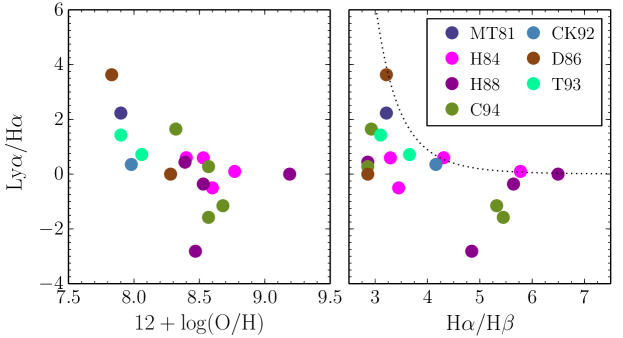
Regarding these correlations, it is not clear why Ly throughput should be more strongly correlated with oxygen abundance than nebular attenuation. Metals alone do not absorb Ly, which can only happen by interaction with dust grains. Thus if the – anti-correlation results from a positive correlation between metal and dust abundance, then a tighter correlation between Ly/H and would be expected. This correlation is completely absent. Furthermore, when the dust reddening measured from the Balmer decrement is used to correct the observed Ly for extinction, the Ly flux does not reach the expected case B recombination value in a single galaxy in the IUE sample. This demonstrates that either some preferential attenuation of Ly must be at play in every galaxy, or/and that dust attenuation laws, when applied as a screen of absorbing material, are not representative.
When interpreting these analyses of the IUE samples, it is important to keep in mind the selection functions by which the individual samples were established. When effective telescope areas are small and exposure times need to be long, the result is small samples. Some of the blue compact dwarf (BCD) and Hii galaxy studies were designed to study the analogues to ‘primeval’ galaxies that are undergoing their first phase of star-formation, and the samples did not include galaxies with strong starbursting nuclei (Hartmann et al., 1984). Yet the primeval stages of galaxy formation, prior to the initial dust and metal production, are expected to be short-lived because the first generations of supernovae will enrich the local ISM on timescales of just a few Myr. Consequently the bulk of the galaxy population we can observe in the high redshift universe is likely to be significantly more metal-enriched than that of primeval galaxies (e.g. Pettini et al., 2002; Shapley et al., 2003), unless observations catch galaxies in very narrow time window. Thus while providing very interesting astrophysical laboratories, the samples are biased and not necessarily in a direction tuned to the real importance of Ly: probing the faint population of normal galaxies at . The IUE samples contain few galaxies that can be considered the local analogues of high- Lyman Break Galaxies (LBG), Ly-emitters, or primeval galaxy building blocks.
4 HIGH RESOLUTION SPECTROSCOPY WITH THE HUBBLE SPACE TELESCOPE
High-resolution ultraviolet observations in the nearby universe, both imaging and spectroscopy, are one of the major legacies of HST. The main UV spectrographs on HST were designed to have high resolving powers, which necessitated either small entrance apertures or the use of narrow slits. The natural consequence is that while HST spectra may be rich with features, any measurements strictly reflect the properties of the stars and gas that fall within the aperture. In most cases these will be the regions of highest UV surface brightness, which in general will be unobscured massive stellar clusters. However it is not necessary that these local properties, whether regarding Ly or interstellar gas, are representative of the entire galaxy. Thus we must always keep in mind that HST derived measurements of gas kinematics, densities, and covering, such as those discussed in this Section, are local.
The first-generation instrument, the Goddard High Resolution Spectrograph (GHRS) increased the resolving power over that of the IUE () by a factor of 10–100. This enabled studies of the kinematics and covering of the atomic gas which are topics completely absent from discussion in every previous paper presenting IUE data. Furthermore, with the IUE observers needed to target galaxies at high enough radial velocity to separate the intrinsic Ly feature from the bright Ly line produced in the Earth’s corona, which is brighter than any known extragalactic object. Indeed because of the tentative anticorrelation between and metallicity, Meier & Terlevich (1981) already commented upon how it was unfortunate that the lowest metallicity galaxy known – i Zw 18, with – had at too small a redshift to be observed with IUE, for logically it must be very bright in Ly. With HST/GHRS it could finally be observed.
4.1 HST Finds Deep Ly Absorption
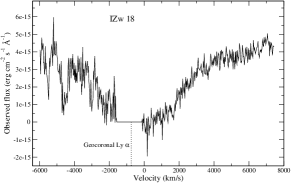
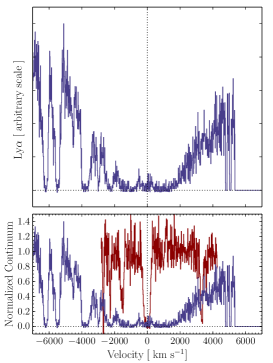
GHRS observations of i Zw 18 revealed a profile showing only damped Ly absorption and no hint of emission (Kunth et al., 1994). The Lorentzian wings of the absorption profile can be traced out to at least 6000 km s-1 (Figure 3; Mas-Hesse et al. 2003), implying a Hi column density above several cm-2. Furthermore, measurements of the low ionization stage (LIS) metal lines that form in the neutral ISM (e.g. Oi , Siii ) show that the Hi gas is static with respect to to the Hii regions, and at the measured column density Ly radiation at line-centre will have to traverse optical depths in order to escape if the Hi is homogeneous.
Subsequent observations of i Zw 18 with the Space Telescope Imaging Spectrograph (STIS) enabled detailed, spatially resolved, and empirically well-constrained studies of Ly radiative transport, which indeed shows that this profile can be reproduced, including spatial variation in the damping wings, using column densities of cm-2, and =0.05 (Atek et al., 2009b). This is fully consistent with the directly observed values on both and . Moreover the same transport simulations predict that for static gas with this Hi column density, almost all the Ly radiation is absorbed by the small amount of available dust (escape fraction the order of to ), as many scattering events increase the probability of absorption.
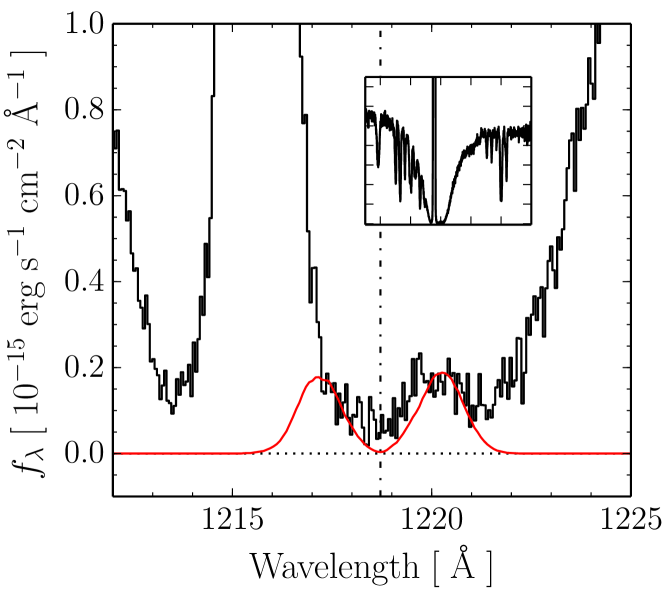
With the HST servicing mission 4, the Cosmic Origins Spectrograph (COS) was installed on HST. COS has a similarly sized entrance window to GHRS and similar grating specifications, but can observe much larger wavelength range in a single observation, and is many times more sensitive. Recently obtained COS observations of i Zw 18 enable us to go much deeper than was previously possible, and a COS/G130M exposure of 29 ksec actually does reveal a small bump of Ly emission, hidden at the bottom of the absorption profile (Figure 4; see also Lebouteiller et al. 2013; James et al. 2014). The Ly emission feature lies in the centre of the absorption trough, and the flux amounts to just erg s-1 cm-2. Recalling at this point that HST spectrographs measure only very local properties, we would need to make a large aperture correction to estimate the total Ly output. However assuming an exponential Ly surface brightness profile we would need a scale length of 80 arcsec in order for 100% of the Ly to be emitted (integrating to infinity). While this is not ruled out – Hi is extends over at least a square arcmin (van Zee et al., 1998) – this scale length is 40 times the UV effective radius, which is an extreme extension of Ly compared with other nearby objects (Section 5). The alternative is that a large fraction of the Ly photons are absorbed by dust after numerous scattering events, as suggested by Atek et al. (2009b).
In i Zw 18 the Ly bump is also offset from the systemic velocity (measured from H) by 350 km s-1 while the neutral gas shows bulk velocities of km s-1 (measured from Siii). The bulk motion is insufficient by an order of magnitude to kinematically redshift the Ly by such a velocity, so other physical processes must be at play. The red line in Figure 4 shows a radiative transport model produced by the grid of Schaerer et al. (2011), for a completely static and dust-free Hi shell with a column density , which is within 0.25 dex of previous estimates based upon modeling just the absorption feature. A plausible interpretation is that the bump is the red half of a double-peaked profile, which results from wing scattering events that shift photons in frequency many Doppler widths into the redistribution profile. If so, and the scattering medium is completely static, there would be a corresponding blue peak at –350 km s-1; this however would be hidden below the geocoronal Ly line, that swamps any intrinsic emission.
Observations of similar dwarf galaxies show the deep Ly absorption seen in i Zw 18 is not unique. Two of the other most metal-deficient galaxies known, SBS 0335–052 and Tol 65 (Thuan & Izotov, 1997), have metallicities just a factor of 2 higher than i Zw 18. Both also show broad Ly absorption profiles with equivalent widths of to Å, no hints of Ly emission, and clear damping wings that imply Hi column densities above cm-2. Similar deep absorption is visible in the COS spectrum of low-metallicity dwarf SBS 1415+437 (James et al., 2014, ), which also shows a similarly redshifted bump of Ly in emission. These galaxies are very rare in the local universe, and one may question whether far-reaching conclusions may be drawn from them. Nevertheless, such objects may become more abundant at higher redshifts, and any complete theoretical picture of Ly must also include them.
4.2 Galaxy Winds and Atomic Gas Kinematics
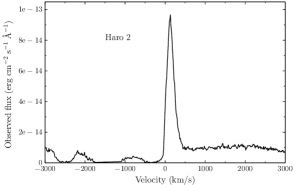
In contrast to the strongly absorbing dwarfs the second BCG with a published HST Ly spectrum, Haro 2, was found to emit a strong Ly line with Å (emission part only, Lequeux et al., 1995, right panel of Figure 3). This is particularly curious because Haro 2 is an order of magnitude more dust- and metal-rich than the dwarf galaxies. Comparing with the absorbing BCDs discussed in Section 4.1, the total column density of hydrogen along the line-of-sight is roughly the same, but with two important differences. Firstly, much less of that hydrogen column density is contributed by the neutral phase, although the measured column of cm-2 would still be sufficient to cause a damped absorption. Secondly, the absorption centroid of Ly is blue-shifted by km s-1 relative to the systemic frame of rest of the galaxy. The result of this first resolved observation of a Ly emission line is an asymmetric profile that comprises a blue absorption component and a red emission peak, similar to the P Cygni profile. Even though the wing of the absorption profile is quite extended, the velocity offset is sufficient to shift the neutral medium partially out of resonance with Ly, and enable some of the Ly radiation to escape.
The LIS lines intrinsic to Haro 2 were also found to be blue-shifted with respect to the systemic velocity and by the same velocity as measured from the Ly absorption ( km s-1). The peak of the Ly emission, however, is instead redshifted by 350 km s-1, or roughly twice the blueshift of the neutral medium. This led Lequeux et al. (1995) to suggest that much of the Ly is able to avoid Hi absorption in Haro 2 because it does not see the atomic gas as static, and the redshifted Ly emission supports a picture in which the Ly that is emitted is ‘backscattered’ from a receding shell of Hi gas (Verhamme et al., 2008). Furthermore in Haro 2, diffuse soft X-ray emission covers and extends beyond the UV-bright, star-forming regions, which is produced by the mechanical energy released by the star formation episode (Otí-Floranes et al., 2012). This X-ray emission is spatially consistent with an extension of the Ly emission in the 2D spectral image. In contrast i Zw 18, which shows only Ly absorption and static low-ionization absorption lines, is undetected at soft X-ray energies (Ott et al., 2005). The conventional picture for galaxy outflows is that cold gas is accelerated by expanding hotter gas (e.g. Strickland et al., 2004), which supports scenario where feedback-driven outflows promote the emission of Ly.
This early picture easily generalized in a sample of eight local BCGs observed by Kunth et al. (1998), four of which show net Ly in emission and four absorption. For those with net absorption, their Oi and Siii absorption lines lie close to the systemic velocity (within 25 km s-1), while the other four show outflowing gas with centroid velocities shifted by 60–180 km s-1 (see also Leitherer et al., 2013). This correlation does not necessarily imply a causal relationship and the fact that Ly is seen to be locally emitted where outflows are strong could also be explained also by orientation: transport models show more Ly to be emitted perpendicular to galaxy disks purely because of the Hi distribution (Verhamme et al., 2012; Laursen et al., 2013), and winds are also stronger in the polar direction because the pressure is also lower (e.g. Bland & Tully, 1988; Veilleux & Rupke, 2002). More compelling evidence for a causal association comes from the fact that all the Ly emission lines in the sample show P Cygni-like asymmetric profiles, indicating that photons are interacting directly in the outflowing medium. For this, it is much harder to argue for a non-causal relation.
Galaxies in the Kunth et al. (1998) sample were originally chosen to span a range of metallicities and dust contents, but both of these quantities were found to be secondary in governing Ly emission/absorption when compared to the presence/absence of outflowing neutral gas.
COS Ly observations of local galaxies are ongoing, but already the instrument has far outdone the GHRS in terms of numbers. Using larger samples of both FUV-selected (Heckman et al., 2011) and H-selected objects (Wofford et al., 2013) this picture of kinematic regulation easily has strengthened. For galaxies in the ‘Lyman-break analog’ (LBA) samples of Heckman et al. (2011) P Cygni emission is ubiquitous while for the H-galaxies, redshifted Ly peaks and LIS lines blueshifted by around 100 km s-1 are found among the emitters, while absorption lines (including Ly) consistent with zero velocity shift at 68% confidence are exhibited by the absorbers.
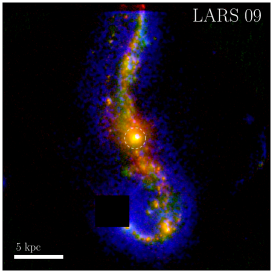
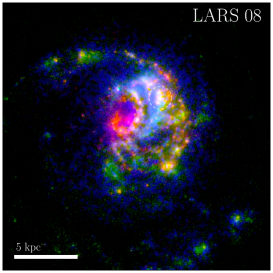
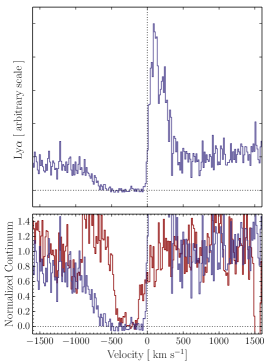
Similar results are found among the Lyman alpha Reference Sample (LARS; Section 5.2; Rivera-Thorsen et al. 2015), which are summarized in the lower panels of Figure 5. The left-most panel shows an example where the ISM in front of the brightest nuclear star cluster (where the COS aperture is positioned) is static, and from where broad damped Ly absorption is also observed. From other regions of the galaxy, however, Ly emission is recovered and the galaxy becomes a weak Ly emitter ( Å) in apertures that encompass the galaxy. The central panel shows an example where the neutral ISM is outflowing along the line-of-sight by around 250 km s-1, the Hi absorption is similarly blueshifted, and a weak Ly emission feature is visible within the pointing of the COS. The right panel instead shows a galaxy where the atomic gas is outflowing at higher velocity still, and a very bright Ly emission line is visible with Å (80 Å when including extended emission).
Obviously if all neutral gas can be cleared from zero velocity, then Ly should escape unhindered. For the column densities probed using the Siii lines, this appears to be the case in the right panel of Figure 5, where only more tenuous gas appears to remain at to absorb Ly. Yet removal of cold gas from not a requirement for Ly emission, and Rivera-Thorsen et al. (2015) present several examples of galaxies that show strong Siii absorption at , but also significant Ly emission (their Figure 8). However while there is clearly gas that does not have a velocity shift, the centroids of the absorption profiles are offset – usually by km s-1 – which demonstrates that there is fast-moving gas that can Doppler shift Ly out of resonance with the static material. Additional support for this comes from the fact that the peak of the Ly profile is redshifted in every case.
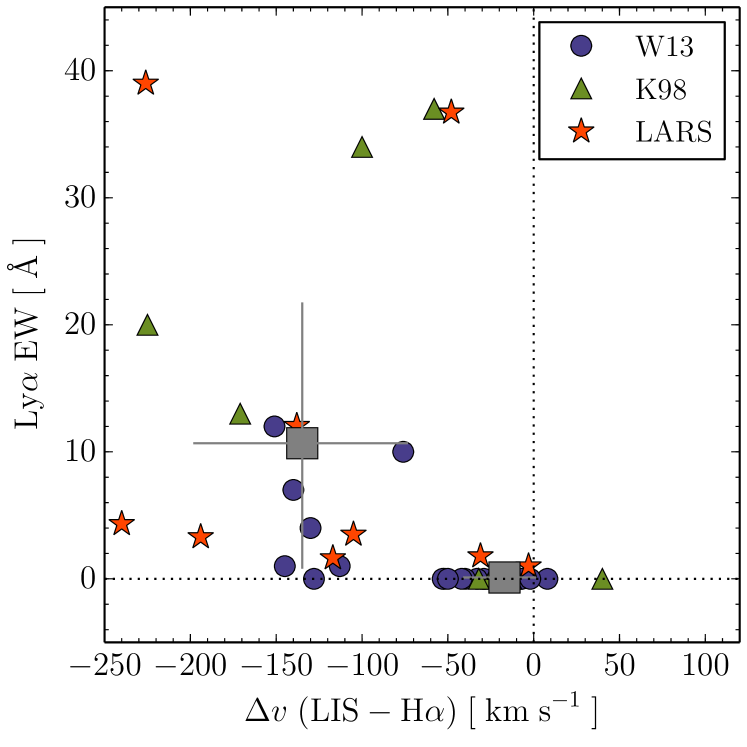
Figure 6 summarizes the situation, by showing the average velocity shift of low-ionization absorption lines compared with measured in the same aperture (diameter of 1.9 and 2.5 arcsec with GHRS and COS, respectively). Outflow velocities span a range from to km s-1 (net inflow), with a median value of km s-1. No galaxy with low-ionization gas moving in the velocity range to km s-1 shows significant Ly emission: all but two of these objects show either net absorption or emit Ly with a total EW below 3 Å. However galaxies with faster outflowing gas show a wide range of , which reaches up to 40Å, with an average near 10Å. We can state with confidence that at least on small scales Ly emission is correlated with feedback of sufficient magnitude, that acts to accelerate the highest density neutral ISM along the line-of-sight. Note, however, that this does not mean it is the case that all galaxies with a strong outflow are Ly emitters – clearly there are galaxies with km s-1 and below 2 Å. Furthermore while the correlation exists, the causal mechanism by which feedback affects the transport has not necessarily been established. For example, whether feedback is simply shifting the Ly out of resonance by scattering from bulk-flowing gas, or the instigation of fluid instabilities that disrupt the ISM.
4.3 Dissecting the Neutral Medium in Detail
In addition to gas kinematics, the plethora of resonance absorption lines in the UV also provide a proxy for the fractional covering of the cold Hi medium (e.g. Savage & Sembach, 1996; Pettini et al., 2002). The principle is simple: strong resonance transitions are assumed to be saturated at normal metallicities and column densities, and thus if the absorbing line does not drop to the level of zero intensity then the observation hints that there may be multiple clouds inside the spectroscopic aperture that do not fully cover the stellar sources of continuum radiation that lie beneath. Thus if there are direct sightlines between the observer and the ionized regions, Ly may escape unimpeded, and importantly, without frequency shift. Indeed if scattering could be completely mitigated and dust confined to the cold gas phase, should be at least , where is the Hi covering fraction.
These methods have been used to place indirect limits on the escape of ionizing radiation from starburst galaxies (Grimes et al., 2009; Heckman et al., 2011), and have recently been verified by direct observations in the ionizing continuum with HST/COS (Borthakur et al., 2014). Similar tests, verified against Ly emission, have been conducted at high- (e.g. Jones et al., 2013) and low- COS studies focussed on Ly recently been presented. For the majority of local UV-selected galaxies the depth of the normally-saturated Siii lines indicates a covering fraction close to unity. However there is some deviation from this: a weak trend is seen for galaxies with above 0.1 to be drawn from systems with Siii Å absorption lines that are not saturated (Rivera-Thorsen et al., 2015). Very well exposed continuum observations are needed to solve for covering fraction, but solutions include the possibility of for the thickest gas neutral columns in Ly-emitting galaxies but not in the case of absorbing systems.
Many of the resonant UV transitions, including the Siii discussed above, have an associated fluorescent transition at longer wavelength, denoted with a * (e.g. Cii*), that provide additional diagnostics of the atomic medium (Prochaska et al., 2011; Rubin et al., 2011; Jaskot & Oey, 2014; Scarlata & Panagia, 2015). Since the absorption lines are resonant, they may be partially filled by scattered radiation, very similarly to Ly. However, the fluorescent transition associated with each line has a roughly similar Einstein coefficient to the resonant de-excitation, which implies that roughly half of absorbed photons should be emitted in the longer wavelength * line at every scattering. In a symmetric, energy-conserving system without losses, absorption along the sightline must be balanced by isotropic fluorescent emission.
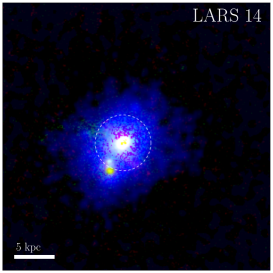
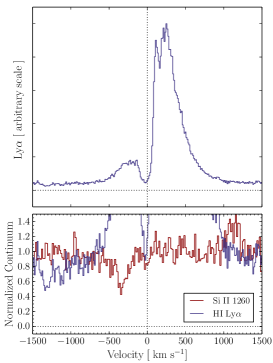
Jaskot & Oey (2014) recently presented spectra of two particularly interesting bright Ly emitters, with between 70 and 150 Å. Both of these objects are well-detected in the stellar continuum, but absorption lines of Cii and SiiiÅ lines are barely visible. However the fluorescent counterpart of each transition is clearly seen in emission, suggesting that the ISM is indeed partly covered or shows a low Hi column density in these galaxies. A similar spectrum is that of LARS 14, illustrated in the lower-right panel of 5 (Rivera-Thorsen et al., 2015), which shows a bright Ly line with a blue peak, incomplete Siii absorption, and a fluorescent emission line (seen at relative velocity of +1200 km s-1).
Further information may be inferred from the profiles of Ly. While Ly and Siii have cross sections of the same order of magnitude and become optically think at similar column density, the metal abundances imply that Ly may be absorbed by gas that is not visible to metal absorption. Particularly in the galaxies of Jaskot & Oey (2014) and LARS 14, the Ly lines do not resemble the strongly asymmetric absorption+emission of P Cygni profiles that occur at high column densities of completely covered gas. Instead they show double-peaked profiles with narrow absorption at . This indicates that there must be absorbing Hi that is not Doppler shifted, but that is also not of sufficient column density and/or metallicity to be seen in metal absorption lines. This implies between and cm-2 for normal ranges of metal abundance.
5 FROM SMALL TO LARGE SCALES: COMPLETING THE QUANTITATIVE PICTURE WITH HST IMAGING
Are HST spectroscopic studies are performed in small apertures or narrow slits. Even for the most distant objects discussed so far, the 2.5 arcsec entrance window of COS corresponds to a physical size of just 6 kpc, and obviously the apertures will sample much smaller scales in more nearby galaxies (e.g. just 130 pc in i Zw 18). Thus while providing a very rich picture about Ly and the ISM, spectroscopic measurements are restricted to the chosen sightlines: as shown in Figure 5, these will sample only a fraction of the galaxies. These small apertures are necessary to get the high spectral resolution, but to capture a representative fraction of the Ly they are likely far too small, particularly when considering that Ly can scatter. To get this, spectroscopic observations must be complimented with large-aperture imaging.
Thick columns of neutral gas have been observed in most of the starbursts mentioned so far, and spectroscopic data strongly suggest that scattering removes Ly from the line-of-sight. An important question becomes whether the bulk of the absorbed Ly is truly absorbed, or simply scattered to larger radii from where it is subsequently emitted. Such information is vital for the comparison with high- data, where ordinarily a flux and EW measurement may be available but little more, and standard practice is to adopt small aperture appropriate for point sources ( ′′).
Ly imaging at became efficient with HST when the Advanced Camera for Surveys (ACS) was installed. Although it was technically possible with earlier cameras, the Solar Blind Channel of ACS has a total throughput of a few percent, and made such observations feasible for the first time. Not only did this bring about the first resolved information on Ly (aside from very extended high- Ly-blobs), but also an immediate leap to an angular resolution of arcsec. However galaxies still need to be sufficiently redshifted in order for Ly not to be absorbed my Milky Way Hi ( km s-1 is sufficient) so obvious targets such as very well-studied nearby systems such as M82 or M33 still cannot be observed.
The first Ly images revealed a range of morphologies. Near the central starbursts, Ly is seen in both emission and absorption, where it may vary between the two on sub-kpc scales with little obvious dependence upon local properties such as age or reddening. For example the first starburst with a photometrically calibrated Ly image, ESO 338–IG04 (Hayes et al., 2005), shows a lane of Ly absorption that runs approximately E–W, and loops around one side of the galaxy only. This is seen at no other wavelength. In other regions jets of brighter Ly fuzz are visible, again seeming uncorrelated with obvious signs of Ly production such as H emission. Obviously spectroscopic results will be a strong function of aperture placement. Furthermore, as soon as ACS was turned towards local starbursts, Ly halos were discovered to surround the starbursting regions (Atek et al., 2008; Östlin et al., 2009). I now proceed to discuss the results of small-scale resolved analyses and extended Ly halos, beginning with a case study of one system.
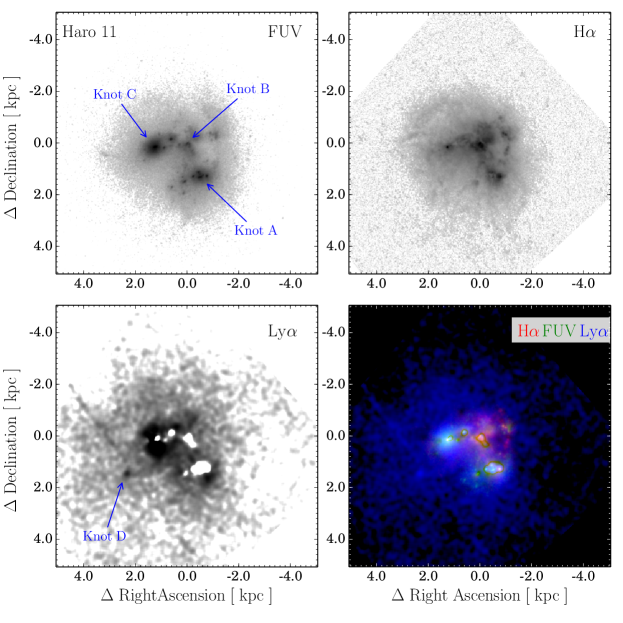
5.1 Resolved Analyses: A Case Study of Haro 11
Local luminous BCG Haro 11 is a Lyman break analog (e.g. Grimes et al., 2007), and emits Ly with a total EW of 15 Å. As shown in Figure 7, it comprises three main star-forming knots (labeled in the FUV image), all of which are bright in the UV and H, but only one of these condensations emits Ly (Hayes et al., 2007). Following this breakdown of the galaxy, knots A and B (the west-most two) are by far the brightest in H and must produce the bulk of the Ly radiation, but both absorb at Ly. In contrast it is only the single easterly knot C, which is the faintest of the three in H but brightest in the UV, that locally emits its Ly. Haro 11 also emits a halo of Ly emission, centred around knot C, which can most easily be explained if Ly is re-radiated after scattering in the surrounding neutral gas. Diffuse emission also surrounds the two easterly knots, but at the positions of the clusters absorption outweighs the emission, giving a negative overall flux. While the Ly surface brightness of the halo is low, it is also very much larger than the UV continuum-bright regions, and in total contributes % of the total Ly flux (Hayes et al., 2007). Results inferred from small-aperture spectroscopic observations will be a strong function of both the size and placement of the aperture.
In Haro 11, Ly produced in knots A and B may still be emitted, and all the observation can say is that more radiation from the stellar continuum is absorbed locally than the sum of directly emitted Ly and any Ly scattered into the line-of-sight. Thus for a given pixel we still cannot say whether Ly is scattered and absorbed by dust locally, or whether it propagates some kpc and contributes to the halo emission. Remarkably in this three-region decomposition of Haro 11, is that the strongly emitting knot C is also the dustiest, and shows magnitudes, while knot A in particular is far less extinguished (Atek et al., 2008). Under the simplistic assumption that dust plays a dominant role in regulating Ly visibility, this would be unexpected, although results from these Ly absorbing knots are reminiscent of the dwarf galaxies discussed in Section 4.
Similar phenomena were noted throughout the sample of nearby galaxies first observed with ACS. Specifically ESO 338–IG04 was also found to exhibit a diffuse Ly halo that dominates the Ly output (Hayes et al., 2005), and in a small sample of six local starbursts, global Ly emission is invariably associated with large-scale halo emission (Atek et al., 2008; Östlin et al., 2009).
Nebulae produce Ly radiation intrinsically at an intensity of 8.7 times that
of H (Section 2), but when we contrast the local
surface brightnesses of the two lines a very wide range of line ratios is found.
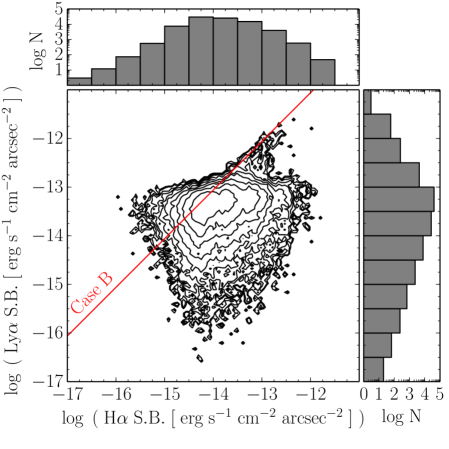
These are illustrated in Figure 8, which contrasts the H and Ly surface brightness in Haro 11 pixel-by-pixel. We now discuss various
regions of the diagram:
a. Ly can be emitted with fluxes similar to those expected
from recombination. In Figure 8 above log Ly surface
brightness of , a region of proportionality is seen between Ly and H that falls right on top of the expectation value for Case B. These
pixels correspond to knot C in Figure 7. Since this region of
points is well defined and rather narrow, it can most easily be understood as
Ly photons leaving the galaxy with little interaction with surrounding Hi.
Ly photons emitted in these regions were most likely produced here.
b. Ly can be emitted with fluxes below those expected from
recombination. The preponderance of points in Figure 8 lie below
the case B line. This can be the result of two factors: Ly can be absorbed
by dust, decreasing the Ly/H ratio (just as the Balmer decrement
increases with dust in nebulae), or Ly can be scattered out of the
line-of-sight by Hi. I.e. dust and Hi scattering act to move
points down from the red line. Recall, also, that in this logarithmic plot
Ly absorption cannot be visualized and more pixels are to be found at
negative values of Ly.
c. Ly can be emitted with fluxes above those expected from
recombination. Toward the upper left region of the diagram, Ly/H exceeds the value of 8.7 expected for Case B. In this example, some pixels are
10 times brighter in Ly than expected. This happens only at lower H surface brightness, and here Ly is spatially redistributed from elsewhere and
emitted after scattering in the neutral ISM, resulting in the halo phenomenon
discussed above and in the following section. Thus some of the Ly that shows
Ly/H Case B (point b) must be scattered and not simply
attenuated by dust.
5.2 Extended Halos
Early imaging observations showed that in galaxies with net Ly emission, the dominant fraction comes from a component of large-scale extended emission that surrounds the star-forming regions. Indeed upwards of 50% of the Ly is typically emitted in halo regions that extended at least 10 kpc from the UV-bright clusters (Hayes et al., 2005; Atek et al., 2008), and in some galaxies this is the only Ly that emerges. The first large-scale Ly imaging survey of local starbursts – the Lyman alpha Reference Sample (LARS, Östlin et al., 2014) – has shown that extended halos are near ubiquitous in Ly emitting galaxies (Hayes et al., 2013). Moreover LARS has enabled the first systematic survey of the sizes of these halos and the comparison with other wavelengths.
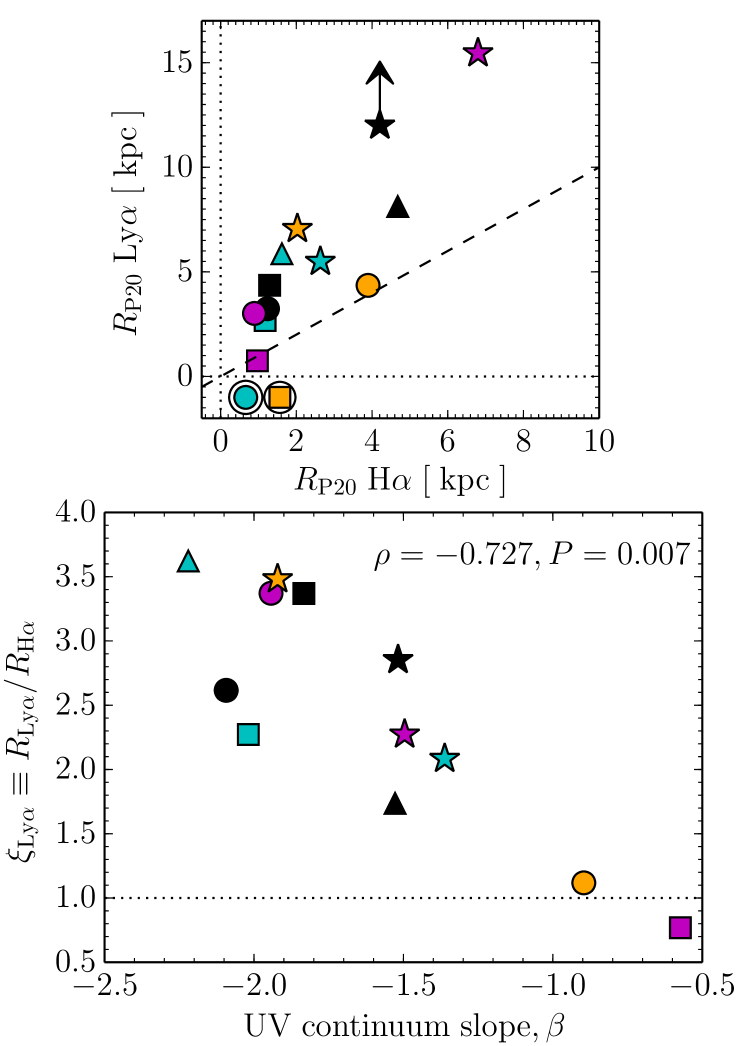
Continuum-subtracted Ly images show a wide range of morphologies. Typically they do qualitatively resemble those of the UV and H, but are more extended, and envelop the galaxies. On average halos have twice the linear size in Ly that the galaxy does in either the UV stellar continuum or H (Figure 9, Hayes et al. 2013). These estimates are made using the depth and redshift independent Petrosian radii, which are found to be below 15 kpc in Ly for LARS galaxies, with a median value of 5 kpc. Furthermore, the extension of the Ly surface (, the ratio of Ly radius to H radius) is not an independent quantity, and is correlated with a number of measured properties: notably is anti-correlated with dust abundance, as demonstrated by the lower panel of Figure 9, and Ly extension is found to be larger at lower metallicity and stellar mass. Radiative transfer simulations (using Verhamme et al., 2012) show that this effect cannot be reproduced simply varying the dust content and what gives rise to these extended halos is currently unclear. Pardy et al. (2014) have shown that higher is produced by galaxies with narrower 21 cm line-widths, but not the total mass in Hi (which neglecting mergers correlates with the line-width), possibly indicating that lower mass galaxies with less complex large-scale morphologies are the ones in which Ly scatters to the largest relative distances.
6 LYMAN ALPHA SURVEYS AT LOW REDSHIFT
A common criticism of some local Ly studies is that the sample selection is different from that of LAEs and LBGs at . The first generations of small HST studies were assembled largely from IUE atlas (Kinney et al., 1993), which in turn were selected from older objective prism or BCG surveys; in contrast most high- objects are selected by Lyman break techniques or Ly detection in narrowband filters. Several recent studies have begun to rectify this: firstly using HST the Lyman Break Analog samples (Heckman et al., 2005; Hoopes et al., 2007, based upon UV luminosity and compactness), the Lyman alpha Reference Sample (LARS; Hayes et al. 2013, 2014, based upon UV luminosity and H EW), and studies undertaken with the GALEX Satellite (Deharveng et al., 2008; Cowie et al., 2010, based upon selection by Ly emission).
The GALEX satellite has been a vital contributer to low- Ly astrophysics. As well as FUV and NUV imaging channels, GALEX also had the capability to perform slitless spectroscopy across the same FUV and NUV bandpasses, providing low-resolution spectroscopy of Ly for objects at and . In turn, this enables us to really survey the low- universe for Ly-emitting galaxies (Deharveng et al., 2008; Cowie et al., 2010), and redshifts around 1 (Barger et al., 2012; Wold et al., 2014), in a manner very similar to those employed at high-. In the FUV channels GALEX LAE surveys capture objects with NUV apparent magnitudes down to 21.8 (AB); at this corresponds to a SFR of 3.6 M⊙ yr-1, assuming the continuum is unobscured.
Figure 10 shows the Ly luminosities probed by various studies out to . As shown by the cyan squares and red upward-facing triangles, UV-selected LARS galaxies and GALEX LAEs occupy a very similar range of Ly luminosities. Contrasting these luminosities with some surveys, significant overlap is seen with the deepest ground-based observations: surveys of Hayes et al. (2010), Cantalupo et al. (2012, both narrowband), and Rauch et al. (2008, blind long-slit spectroscopy, without aperture correction) overlap the local HST and GALEX samples at above the 50% level.
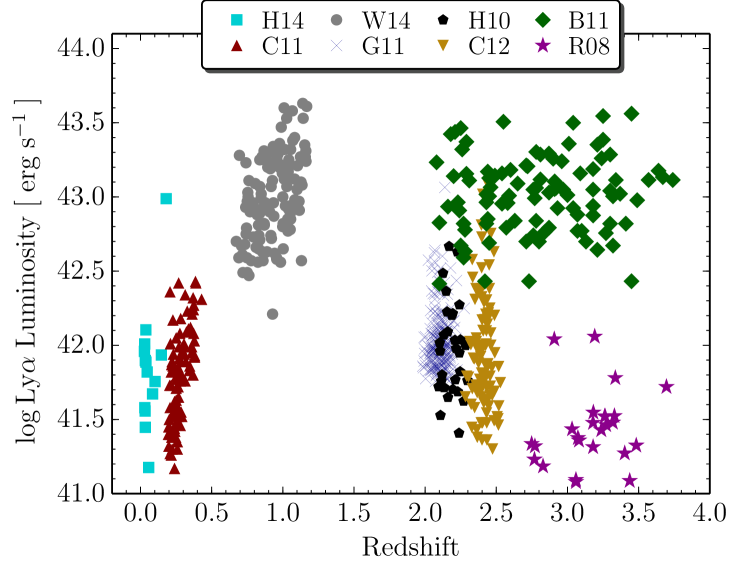
The LAEs discovered by GALEX, however, are an order of magnitude more luminous than the sample, and show almost no overlap with the more local objects. This is entirely a matter of distance, where the same limiting flux corresponds to a factor of 20 difference luminosity between and 1. This difference in luminosity may introduce some biases when comparing the luminosity distributions of the two GALEX samples, as we show in the coming Section. These LAEs, however, do span a similar luminosity range to some of the larger volume, shallower Ly-surveys at (e.g. Blanc et al., 2011).
In the following Sections I discuss the most important results from the and studies with GALEX, regarding the numbers/evolution of Ly-emitting galaxies (Section 6.1), and statistical studies of their properties (Section 6.2); in part of course the properties of galaxies are part of that evolutionary process.
6.1 Evolution of Lyman alpha Galaxies into the Nearby Universe
IUE demonstrated that Ly emission is rare in the nearby universe but GALEX could determine how rare. The first Ly luminosity functions (LFs) at showed that Ly emitting galaxies have become both fainter and less abundant than at high-. Figure 11 shows the LFs measured at and 1 (Cowie et al., 2010; Wold et al., 2014, respectively), together with recent measurements for (Ciardullo et al., 2012).
It should be noted that, while these LFs are the best that can be done with GALEX, the samples are not large: 119 at and 141 at . However, because of GALEX’s wide field-of-view and the large continuous wavelength range provided by slitless spectroscopy, the cosmic volumes probed are in fact rather large, and covering several comoving Mpc3. Thus while the individual parameters in the Schechter function may not be very tightly constrained, the small number of galaxies is certainly because of the relative paucity of LAEs at lower redshifts.
As discussed in Section 6, the two GALEX samples cover different luminosity ranges (Figure 10). Moreover the dynamic range of the surveys is not large, and even for the less luminous sample it is not possible to calculate the faint-end-slope () of the LF. Thus the LFs presented in Figure 11 assume , basing the assumption on measured values at for the sample, and the for local H-emitters for the sample. Note also that the faint-end slope of the Ly LF is also not very tightly constrained at high redshift (reasons outlined in Dressler et al., 2014).
At and to the UV limits mentioned in Section 6, the shape of the Ly LF closely resembles that of H and H, although is lower in normalization: Ly-emitting galaxies make up about % of the local H-selected galaxy population (Deharveng et al., 2008; Hu et al., 2009) and 1/20 the FUV counts at the same (Cowie et al., 2010). This equates to a volume-averaged escape fraction of below 1 % (Hayes et al., 2011), although this will be slightly higher when considering possible emission from galaxies not formally classed as LAEs (i.e. galaxies that emit weaker Ly with Å). At the average is %, so the average Ly output of the whole cosmic volume decreases 5-fold. Note that this decrease in the emitted fraction of Ly happens on top of the decrease in the cosmic star formation rate density, which also drops by a factor of 5–10 over the same change in redshift (Madau & Dickinson, 2014), implying the Ly luminosity density of the local universe is far below that of .
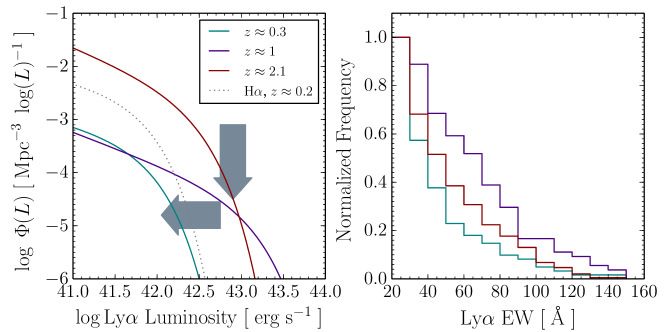
A large fraction of this evolution takes place in the 4.3 Gyr that elapses between redshifts of 1 and 0.3 (Wold et al., 2014). At the higher redshift of 1 luminous Ly emitters are certainly in place, with luminosities equivalent to at , and the evolution between and 1 can be well described by a simple factor of 10 increase of in the Schechter (1976) function. Over this redshift range the space density of LAEs does not appear to change but the galaxies simply scale up in luminosity. Between and 2 (3 Gyr), increases by an order of magnitude to produce the LFs observed in ground-based surveys. Arrows in Figure 11 show how the evolution of the LF manifests as a drop in density, followed by a dimming. Between the peak in the cosmic SFRD at and , the universe first acts to turn off a fraction of the Ly emitters, whereafter between and the nearby universe the abundance is constant but the galaxies get fainter in line with the evolution in both the UV and H.
Interestingly, this evolution is not strongly reflected in the equivalent width distribution of LAEs, which does not evolve as dramatically. The EW distribution of Guaita et al. (2011) at agrees well with the distribution at (shown in the right panel of Figure 11) despite the fact that the overall Ly-emitting fraction has decreased by a factor near 5 (Cowie et al. 2010 contrasted with Shapley et al. 2003). Thus whatever process is turning Ly-emitters off it does not affect the shape of the remaining EW distribution (i.e. galaxies with Å). Of course the equivalent width distribution of the overall population changes significantly, as many galaxies drop below the canonical 20Å limit; the higher EW tail of the distribution remains largely constant. Note that it is not necessarily fair to conclude strong evolution in the EW distribution to from Figure 11, as the GALEX FUV observations are first continuum selected. This will lead to a fraction of continuum-faint objects with high EWs being missed, which will extend the tail of the distribution. However because the bulk of the luminosity comes from low EW galaxies, the LFs are will be largely unaffected.
In light of the extended Ly halos discussed in Section 5.2, we may ask whether much Ly also extends beyond the spectroscopic extraction apertures of GALEX. These spectra are extracted using an optimal model of the point spread function (PSF, Morrissey et al., 2007), which has FWHM of ′′. At () this aperture corresponds to a spatial scale of 22 (40) kpc, and thus one dimensional spectra are summed over scales that exceed this. At the aperture is 5 times the median Ly Petrosian radius in LARS, and while we do not known precisely how the Ly profiles behave at larger radii, it is likely that in most cases GALEX captures the majority of the total flux. At Barger et al. (2012) discovered a giant Ly blob, extended over an 18′′ diameter, but also measure such objects to be extremely rare (one in the whole volume). Moreover, aperture sizes (′′ at ) are equivalent to a 3′′ diameter aperture at , so if halo extension does significantly affect the recovered Ly flux, it is likely by a similar factor as in high- observations.
6.2 The Properties of Nearby Lyman alpha Galaxies
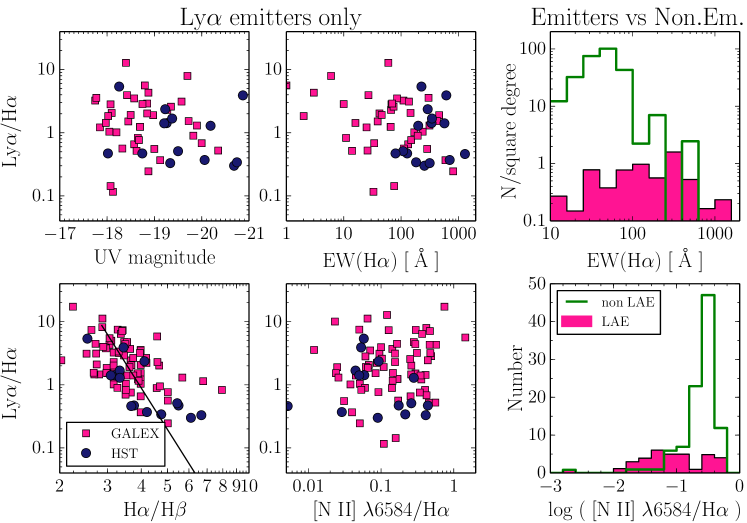
Unlike most high- studies, both the GALEX and HST samples are sufficiently close that many of their properties may be systematically measured. I assemble some of the key data obtained from these telescopes in Figure 12, and in this Section discuss what we have learned about galaxies that emit, and do not emit, Ly.
6.2.1 Stellar Populations
Over the Ly luminosity ranges probed by low- Ly observations ( erg s-1), known LAEs have typical stellar masses on the order of M⊙ (Finkelstein et al., 2011; Hayes et al., 2014). This is significantly higher than estimates made for most LAE samples at high-, while the Ly luminosities are equivalent or somewhat lower. This difference in the (Ly) reflects the fact that the average nearby galaxy is more evolved, and has had substantially more time to build stellar mass than a similarly selected galaxy in the more distant universe.
This evolution is also reflected in recovered stellar ages. However caution is needed here: when estimated from SED fitting age is a luminosity-weighted average, and wavelength-dependent function of the included bands and the range of permitted star-formation histories. Finkelstein et al. (2011) find a wide range of SED-fit ages with a median of Myr. However when subtracting an underlying population of old stars, Hayes et al. (2014) determine recent star-formation to have occurred in short bursts with luminosity-weighted ages up to a few tens of Myr. This suggests that Ly emitting galaxies, like starbursts in general, have temp temporarily elevated SFRs. The total Ly luminosity shows no dependency upon stellar age, but both and the relative throughput () are higher in younger galaxies.
The above would suggest that Ly escape fractions and equivalent widths are higher in galaxies with higher H equivalent width, which roughly measures the specific SFR (sSFR). Cowie et al. (2011) indeed show that the fraction of Ly-emitting galaxies increases when progressively higher H EW thresholds are applied, finding almost 60% LAEs in sub-samples of Å. Hayes et al. (2014) similarly find that all their galaxies with above 10% have H EWs above 400Å. Interestingly, however this effect is not visible when comparing the Ly/H ratio (or ) with (Figure 12) for the objects with Å. The most convincing results emerge when we compare the average properties of LAE and non-LAE samples.
6.2.2 Galaxy Morphology
In UV-selected local galaxies, the objects with the highest and are found to be among the more compact ones. LARS galaxies tend to have particularly compact UV morphologies and LAEs are found among those with Petrosian radii of kpc on average, similar to higher redshift results of Malhotra et al. (2012). Larger galaxies all show lower .
Galaxies hosting Ly-emitting starbursts represent a mixture of various types, although still a mixture that is distinct from the UV-selected galaxy population in general. The LAEs contain a higher fraction of compact galaxies and merging systems. More curiously, an enhanced fraction of the GALEX LAE disks appear to be face on (Cowie et al., 2010). This phenomenon is also expected from radiative transfer modeling (Verhamme et al., 2012; Laursen et al., 2013), and suggests that orientation effects may hide some disks from Ly selection. Unfortunately current samples are not sufficiently large to test Ly emission as a function of inclination angle.
6.2.3 Interstellar Dust and Metals
6.2.3.1 Dust
LAEs have bluer UV-optical colours than non-emitting galaxies of the same magnitude (Cowie et al., 2010, 2011) but there is significant overlap in colours between the emitting and non-emitting subsamples. UV-selected samples similarly exhibit higher Ly escape fractions ( %) where UV colours are bluer (; Hayes et al. 2014). This should be in part a reflection of the stellar age effects discussed in Section 6.2.1, but may also be due to dust extinction that reduces the Ly throughput: Ly/H ratios and escape fractions (independent of age) are both higher for bluer galaxies, not only equivalent widths.
The average Ly/H ratio found for the GALEX-selected LAEs is slightly above 2 (Atek et al., 2009a; Scarlata et al., 2009; Cowie et al., 2010), although perhaps surprisingly, plots comparing Ly and H flux directly show no general covariance over more than 1 dex in each quantity. Examining Ly/H however, the ratio decreases significantly with increasing H/H, and the conclusion that dust reduces the transmitted Ly in the LAE samples is shared over many studies. Indeed as shown in the lower left panel of Figure 12a, the anticorrelation between Ly/H and H/H is one of the few trends that is significant over the dynamic range of today’s surveys.
The comparison of these line ratios with extinction laws reveals several curious features. Firstly, at the lowest H/H ratios, most of the galaxies lie below the predicted curves, and even in Ly-selected samples only % of Ly photons escape when H/H is in the range 2.8–3.2. These galaxies emit less Ly than dust attenuation would predict. However the same is not true for dustier galaxies: at H/H the mean Ly/H ratio is , even though from this Balmer decrement we would would expect 97% of the Ly radiation to be absorbed. Thus the locus of points in the Ly/H–H/H plane shows a trend that is much flatter than known extinction laws, and the normalized Ly escape fraction (measured divided by that which is expected for the derived dust content) increases with attenuation. Above Ly emission becomes on average several times stronger than expected (Scarlata et al., 2009; Atek et al., 2014; Hayes et al., 2014).
The most basic example of a simple screen of dust that reddens the nebular lines is incompatible with observation. Atek et al. (2009a) and Finkelstein et al. (2009) invoked the Neufeld (1991) geometry to explain this apparent enhancement of Ly, in which dust is embedded within the Hi clumps of a multiphase ISM, and Ly scattering prevents photons from encountering dust. Radiative transport simulations show that this effective ‘boost’ of Ly is very difficult to reproduce without rather contrived combinations of parameters (Laursen et al., 2013; Duval et al., 2014), and the predicted increase of Ly EW with measured attenuation is not observed.
Scarlata et al. (2009) argue instead for a scenario that requires no such preservational scattering, but is still built upon a clumpy dust distribution (which may anyway follow the cold gas). This model does not require clumps to act as mirrors to Ly and nor does it predict Ly EW to rise with . Similarly Atek et al. (2014) point out that a galaxy is likely made up of many Hii regions with a large variety of optical depths and since we see only down to an optical depth of 1 at each wavelength, observed radiation in each line (and continuum) comes from regions of different sizes. At the dusty end of the galaxy distribution these latter two scenarios do not require any scattering at all, and indeed recently Martin et al. (2015) have shown that significant Ly emission can be detected from ultraluminous infrared galaxies (ULIRGs), from which it most likely escapes through holes in the ISM.
6.2.3.2 Metal Abundance
Dust can absorb Ly and metals cannot. At the UV luminosities probed by GALEX and LARS, the LAEs exhibit metallicities that overlap with the UV-continuum selected galaxies, but extend down to lower metal abundance. LAEs are on average deficient in nebular oxygen by about 0.4 dex (Figure 12c), and are drawn mainly from a sub-populations with metallicities of . Indeed a remarkable result from the GALEX studies is that the N2 index (=log([Nii]/H) segregates Ly-emitters from non-emitters more cleanly than H/H.
Part of this apparent preference for low metallicity galaxies comes from an enhanced fraction of more compact irregular galaxies (Section 6.2.2), which are lower metallicity in general. Comparing Ly EW with age and metallicity, Cowie et al. (2011) suggest LAEs are drawn from a stage in the evolutionary sequence during which metals build up and Ly EWs decrease, in a similar way to that which would be expected for H. In addition Hayes et al. (2014) find that not only does EW decrease with age but also the Ly escape fraction, which has no dependence upon stellar evolutionary stage. This shows that not only do older stellar populations produce less Ly, but also that their ISM become more opaque to Ly; this would also support hypothesis of dust buildup, although current samples do not have the statistical power to say whether this is purely a dust effect.
6.2.4 Neutral Gas
While dust absorption is ultimately the process that can expunge Ly radiation from a galaxy, Hi scattering determines the path length of Ly between the nebulae in which it is produced and eventual emission. Here we discuss observations that probe the Hi phase directly by 21 cm emission, telling us about the total amount of Hi available for scattering, and its large scale kinematics. For a discussion of the Hi properties measured on small scales by absorption line studies, see Section 4.
Masses in Hi, and the large scale Hi envelope of individual galaxies can only be measured by 21 cm observations, which currently limits us to the nearby universe. However to avoid Ly absorption by the Milky Way and to separate the line from geocoronal emission, the lower limit of a galaxy’s recession velocity is km s-1. By this distance of Mpc, Hi 21 cm observations are already challenging (Pardy et al., 2014).
Regarding the Ly-absorbing dwarf galaxies, i Zw 18 is known to lie within a huge Hi envelope that is many times its optical size, with a central column density of cm-2 (van Zee et al., 1998) and total mass of M⊙. Thus if all the Hi were static with respect to the Hii regions, Ly would see upwards of optical depths at line centre. SBS 0335–052 exhibits very similar properties in both central Ly absorption and large static Hi envelope (Thuan et al., 1999). In cases like this the fate of the Ly radiation is unclear: does the Ly scatter so many times that it is eventually absorbed by the small amount of available dust, or does the Ly eventually leak out in a large, low surface-brightness halo that cannot easily be detected? Without very large aperture imaging observations that cannot be obtained with existing facilities, conclusive answers are difficult to provide.
Sixteen more starbursts ( to , from Östlin et al. 2009 and the LARS sample), complete with Ly imaging and spectroscopy from HST, have been observed at cm with the Green Bank Telescope (GBT) and/or Karl G. Jansky Very Large Array (VLA, Cannon et al., 2004; Pardy et al., 2014). Hi masses are between to several M⊙, which is or 10–100 times as much as the dwarf galaxies , but for the seven galaxies where Hi detections are resolved the central column densities are comparable. In these samples the Ly-emitting objects with above 10% all have Hi masses below M⊙. While galaxies above this mass emit only a small fraction of their Ly photons, several of the less Hi-massive galaxies also show below a few percent, or in absorption. The same result is seen with dynamical masses derived from Hi line-widths. While it may be hypothesized that less Hi would permit more Ly photons to escape, it cannot be ruled out that this anti-correlation between and is not simply reflecting the fact that higher is also seen at lower stellar mass (Section 6.2.1) and is not causally connected with Hi.
Spatial resolution in these 21 cm observations is currently still low, even with the VLA, but in every case the Hi is resolved, and extends over more than 10 Petrosian radii in the UV. Most galaxies show signs of tidal interactions, both in their 21 cm morphologies and line shapes. Perhaps most interestingly ESO 338–IG04, IRAS 08339+6517 (Cannon et al., 2004) and Arp 238 (LARS 03, Pardy et al., 2014) show long Hi tidal streams and debris trails: in the cases of ESO 338–IG04 and IRAS 08339+6517 these streams stretch over 50–100 kpc to companion objects, while in Arp 238 a huge () Hi body has been ejected that contains no apparent companion galaxy at the level of SDSS imaging.
7 SYNTHESIZING THE OBSERVATIONAL DATA: WHAT MAKES A LYMAN ALPHA EMITTER?
As we have seen in Sections 4, 5, and 6.2, current data show that and are influenced by a large number of physical properties. In recent years much attention has been devoted to determining their order of precedence: i.e. whether covering fraction is more important than kinematic properties, which in turn is more important than dust reddening. Mostly we have been driven to find a way to predict the emergent Ly flux, EW or from a given set of conditions. We have now assembled significant samples of low- observations, selected by Ly, H, and UV continuum, and have studied various subsets of them between the X-ray and radio, measuring all the physical properties discussed in Section 6. By combining this literature we now have substantial power to determine how Ly is regulated and test for the primary effects in homogeneously selected galaxies that do and do not emit Ly.
Simultaneously we need to explain:
-
•
Why only % of local UV-selected galaxies (down to the SFRs of M⊙ yr-1, that are within reach of GALEX) show above 20 Å.
-
•
Why and are anti-correlated in Ly-selected galaxies, but many galaxies significantly outlie this relationship; that many seemingly dust-free galaxies absorb their Ly, while many dusty galaxies exhibit that appears too high for their extinction.
-
•
Why higher and are found among galaxies with lower stellar mass and metallicity, and younger stellar age.
-
•
Why higher and are found among more compact galaxies and face-on spirals.
-
•
Why Ly emission, at least on small scales, is frequently associated with galaxy outflows, and the spectroscopic line profile is almost always asymmetric.
-
•
Why among our highest EW Ly-emitting galaxies we often infer covering fractions below unity (measured from, Cii and Siii) or low Hi column densities.
In doing so we must remain cognizant of the fact that data have been assembled from different selection functions, measurements have been made in apertures that probe a variety of physical sizes, and that large scale halo emission may affect some, but not all, of our results.
We first address stellar properties, as these dictate the intrinsic but do not affect transmission (i.e. they have no direct influence over , and only set a limit on the emergent ). Since Ly is reprocessed ionizing continuum, will exceed 20Å only during for ages below Myr (Leitherer et al., 1999, and Section 2.1), assuming an SSP. The SSP assumption is probably over-simplistic for whole galaxies but it does serve to illustrate that the Ly-bright period cannot be sustained if the SFR is declining, and that episodes must be young. The Ly production must be most strongly correlated with the evolutionary stage of the stars.
However the observed is not strongly correlated with instantaneous SFR, and neither are the high-EW galaxies the most luminous in Ly. If anything the reverse is true, at least within the current samples, and over the UV and Ly luminosity ranges probed at low- high-EW galaxies are among the less luminous. Indeed similar can be said for galaxy samples selected by other emission lines such as H or [Oiii] (e.g Atek et al., 2011): the requirement for high EW line emission necessitates not only ongoing star formation, but at a given SFR the UV continuum must be faint enough for the EW to be high. This at least partially explains why local LAEs are drawn from galaxies with higher H EWs (as seen by, e.g. Cowie et al., 2011), and at lower stellar age and mass. Considering the well-known mass-metallicity relationship (Tremonti et al., 2004), it equally well explains why LAEs should be more prevalent at lower metallicities. Note, however, that according to current spectroscopic data, this relationship does not extend indefinitely to the lowest metallicity, gas-rich dwarf galaxies; a point to which we will return below.
Ly transfer however is not affected by any of the above considerations: stellar age, mass, and nebular oxygen abundance are not properties that influence radiation, although they may correlate with quantities that do. What matters from this point is the properties of dust and Hi. is anticorrelated with the , as would be expected, but the spread is very large. Moreover the slope of the – relationship in LAE samples is flatter than would be expected for pure extinction (Atek et al., 2014), indicating that the role of dust is diminished. At the dust-free end the under-luminous Ly can be most easily be explained by the presence of Hi, as it may scatter Ly photons many times, and increase the probability of dust absorption. This is supported by, for example, small aperture spectroscopic observations of almost dust-free dwarf galaxies that show not only a lack of nebular Ly but also the absorption of continuum photons in the Ly resonance.
If this dust were distributed purely as a screen surrounding the star-forming regions, the apparent over-luminous Ly observed in some LAEs cannot be explained without severely modifying extinction laws. Ly would have to see at least the expected attenuation, plus an excess of absorption because of scattering. To explain this we must invoke geometrical effects. Evenly mixing dust into the Hii regions would produce an effective attenuation of the form at high , and asymptotically sets a lower limit to Ly/H ratio of (without scattering). However such a dust geometry cannot make high a H/H ratio, which saturates for optically thick nebulae at . What can explain the simultaneous high Ly/H and H/H ratios is a clumpy distribution of dust, as advocated by Scarlata et al. (2009). This model, originally implemented by Natta & Panagia (1984) and Caplan & Deharveng (1986), assumes dust to be distributed in dense clumps and the effective attenuation law changes significantly with the average number of clumps along the line-of-sight. E.g. again without scattering, varying within 10 clumps may produce Ly/H with H/H, and can explain the line ratios seen in the dustiest local LAEs. The fact that Ly is seen at all from local ULIRGs (Martin et al., 2015) also suggests that Ly must find paths of low dust optical depth.
Then we need to explain why the local dwarf galaxies (e.g. i Zw 18, SBS 0335–052) centrally absorb at Ly despite their very low dust contents. Indeed HST spectroscopy shows some absorption component in every object observed, demonstrating that Hi has effects that range between small dips and very broad, damped absorption features. Tenorio-Tagle et al. (1999) presented an evolutionary sequence for the Ly spectral profile expected from a star cluster (assuming an SSP). This model assumes that during the earliest stages of a cluster’s evolution ( Myr) local Ly absorption would be expected because the surrounding medium is completely static. Over the subsequent Myr mechanical feedback from O star winds and the first supernovae accelerate the Hi outwards, producing P Cygni-shaped Ly profiles. The application of this model to dwarf galaxies suggests that their star-formation episodes may be too young and that feedback has not yet had time to accelerate the neutral ISM (Mas-Hesse et al., 2003).
This scenario is probably an over-simplistic representation of whole galaxies, where stars form in different regions over extended timescales, but nevertheless the qualitative arguments may be helpful in understanding the influence of galaxy winds. All the observed line profiles, including those of the local dwarf galaxies, can in principle be unified within such a scenario (Mas-Hesse et al., 2003). In the complete literature of low- galaxies only one example shows symmetric Ly emission without an obvious absorption component (Tol 1214–277, Thuan & Izotov, 1997), and as Figure 6 shows, an outflow in the neutral medium appears to be a requirement (but not uniquely sufficient) for net Ly emission (Kunth et al., 1998; Wofford et al., 2013; Rivera-Thorsen et al., 2015).
8 PERSPECTIVES AND FUTURE DEVELOPMENTS: THE MOST PRESSING QUESTIONS
With GALEX and HST Ly observations now running to over hundred galaxies for each telescope, local samples are substantial. Nevertheless, several major questions still remain to be answered. This closing Section is dedicated to outlining a handful of the most pressing questions that, while perhaps challenging, can be addressed within current samples, or with possible extensions with present-day facilities.
8.1 What is the Atomic Gas Distribution in Star-Forming Galaxies?
The spatial distribution of emitted and absorbed Ly must reflect some set of properties of the Hi gas. In very nearby galaxies, 21 cm observations have already revealed the structure of the cold atomic gas where, for example, the Hi Nearby Galaxy Survey (THINGS, Walter et al. 2008) and VLA-ANGST (Ott et al., 2012) surveys have found an atomic medium that is largely inhomogeneous and clumpy. It is clear that if Ly photons were injected in these galaxies they would experience more scattering in some regions than others. Examining at least these 21 cm observations, we see that the Hi does not much resemble the shells and slabs in which many radiation transfer calculations are done. In order to empirically determine the effects that Hi and its distribution have on Ly emission requires resolved observations of individual targets in both Hi and Ly.
Currently we may contrast average Ly surface brightness profiles (e.g. Hayes et al., 2014) with those of the intensity at 21 cm (e.g. Bigiel & Blitz, 2012). These samples show both Ly and 21 cm intensity profiles that are best fit with Sérsic profiles that are close to exponential (), while UV/optical wavelengths in the LARS sample show significantly higher Sérsic indices (). Does the Ly surface brightness trace the gas column density? While curious, this may be entirely coincidental as the sample selection is very different in the two cases. Such observations established in the same galaxies would be enormously instructive in interpreting the Ly halos of both galaxies at low and high redshifts.
It is unfortunate that resolutions attainable in 21 cm and in the UV/optical are not well matched; sampling small physical scales at 21 cm requires very local galaxies, while the redshift requirements to observe Ly imply targets must lie beyond several tens of Mpc. Progress has been made by Cannon et al. (2004) and Pardy et al. (2014), but with synthesized beam sizes of arcsec in the best case (usually much coarser), such Hi observations can place only two resolution elements inside the linear size of the ACS/SBC camera. However VLA in configurations B and A can provide resolutions down to around 4 and 1.3 arcsec, respectively, albeit with a substantial increase in observing time. Observational programmes at higher resolution (VLA C and B configurations) are ongoing, but it is clear that large steps forward may be taken if Hi observations are pushed to the highest spatial resolutions, and such observations are now essential.
8.2 How is the Ly Spectral Profile Built?
The total integrated Ly profile of a galaxy is built by emission from different regions, likely with differing kinematics, orientation, and with different contributions to the total Ly. The spectral profiles of Ly measured in small apertures tend to be P Cygni, with radiation absorbed from the blue and re-radiated in the red. In these small apertures, Ly escape fractions are also low. However imaging tells us that these photons are often not expunged from the system, but scattered back into the line of sight at different position, where large-aperture photometry measures significantly higher . It is an unfortunately common feature of absorption spectroscopy that we rarely know the line-of-sight distance between the emitting sources and the absorbing gas.
Ideally we would like to know where the frequency redistribution of Ly occurs, and whether the halo emission shares a similar profile to that of the more central regions where the starburst is located. For example if frequency redistribution occurs close to ionizing clusters and Ly is singly scattered at large radii, the profile may indeed be similar over large distances. However if photons also get caught for many scatterings in halo gas then a new kinematic structure may be encoded in the Ly, or double-peaked profiles may be seen.
To resolve this we may take high resolution spectra of the diffuse Ly-emitting regions in galaxy halos. These observations would be best supported by aperture-matched optical spectroscopy of H or H, to tightly constrain the rest velocity distribution of Ly, and ideally also the highest possible resolution 21 cm observations (previous section). The best tool for this would be HST/STIS with narrow slits, which could provide resolutions of around 20 km s-1, but again at the cost of long integrations in faint regions. Mas-Hesse et al. (2003) have shown that in IRAS 08339+6517, the blue wing of the Ly profile sets on at a similar wavelength over at least 10 kpc, suggesting the star forming regions are surrounded by a Hi medium that may be rather homogeneous in both space and velocity. However 21 cm observations find gas at much larger radii, where Ly has not yet been spectroscopically detected; whether the profile bends smoothly and traces the edge of a bubble, and how this effect may vary in different galaxies are all currently unknown.
8.3 Ionization State of the Interstellar Medium
Section 6.2 discusses the effect of a large number of galaxy properties on the emission of Ly. Many have been studied over time, but largely overlooked has been the effect of ionization state of the ISM. Specifically ionizing radiation from stars may not only produce recombination nebulae but also heat the diffuse warm medium. Thus as well as producing Ly, the further propagation of LyC radiation may increase the ionization levels of the diffuse gas, lowering the optical depth of the Hii regions to Lyman radiation (e.g. Pellegrini et al., 2012). Given that the ISM of galaxies may be very inhomogeneous, and that Ly may be absorbed close the nebulae in which it forms, the propagation of ionizing radiation could potentially have a large impact upon the first stages of Ly transfer.
The ionization parameter (the number of hydrogen-ionizing photons per atom) governs the excitation of the gas, which is usually quantified observationally by the excitation parameter (an emission line ratio that contrasts high and low ionization species). This is done most effectively by taking ratios of and ions: Zastrow et al. (2011, 2013) performed ‘ionization parameter mapping’ of several local starbursts using the [Siii]/[Sii] ratio, to identify highly ionized cones that could signpost LyC emission. Similar integrated measurements of ‘Green Pea’ galaxies found high [Oiii]/[Oii] ratios (Jaskot & Oey, 2013) that implies high ionization states, and indeed these galaxies have been found to be high-EW Ly emitters (Jaskot & Oey 2014; Henry et al., in preparation).
Currently we do not know how these highly ionized regions affect Ly on small scales in the ISM. Resolved Ly imaging has now been obtained for over 50 galaxies with ACS, but as yet the ionization structure has only been mapped in one of them. Bik et al. (2015) used VLT/MUSE observations of [Siii] and [Oiii] to map the ionization parameter and gas kinematics in ESO 338–IG04, and compare with the Ly imaging from Hayes et al. (2005). Two outflowing and highly-ionized conical regions are revealed, that approximately align with the brightest Ly regions. This would be consistent with a scenario in which Ly may propagate with less scattering through these highly ionized regions, but the observations of one system cannot establish a causal relation, and a large sample of similar observations needs to be obtained. Pertinent observational questions include whether Ly emission is systematically enhanced in regions of high [Siii]/[Sii], or whether chimneys through the ISM may feed brighter regions of Ly emission in extended halos.
8.4 Can we Predict Ly Observables from Other Information?
Given the importance of Ly observations at both low and high redshift (see Section 1.1), a vital question becomes whether we can predict the Ly escape fraction, equivalent width, or line profile from a given set of quantities. I.e. if we are given a dust content, a characteristic velocity for outflowing atomic gas, etc, do our predictions for Ly emission/absorption match reality?
Given the absence of strong correlations involving Ly (for example in Figure 12), one may be tempted to conclude that our understanding is not this sophisticated. However if, on the other hand, the Ly that we observe is governed by geometrical considerations such as viewing angle, then averaged over many galaxies the answer may be more encouraging. For example it has been shown that transfer models inside homogeneous shells can reproduce very wide ranges of line profiles Schaerer et al. (2011), similar to those that are observed globally at high-; furthermore when coupled with semi-analytical models of galaxy formation, such models are able to reproduce the broad features of the Ly LF over a wide range of redshift (Garel et al., 2012). This may imply that our more general picture of Ly transport is correct.
It is not clear whether current samples are sufficiently large, or span a high enough dynamic range in luminosity/SFR for such an exploration. However in the coming years, larger databases of global properties will become available; GALEX LAEs will remain at around 100 objects; HST spectroscopic samples already exceed this while imaging observations remain somewhat smaller. This should permit statistical studies studies using linear discriminant analyses, to determine how combinations of properties produce the observed Ly characteristics. Many such possibilities may be envisaged if the signal is strong enough and the samples are sufficiently large.
More empirically motivated simulations can be performed using the wealth of data available for low- galaxies as input. In such an approach, nature sets up the ISM instead of computers. For example, transport calculations have been run in synthetic galaxies output by hydrodynamical simulations (Laursen et al., 2009; Verhamme et al., 2012; Yajima et al., 2014), although as yet there has been no attempt to construct realistic input conditions of a galaxy based upon observation. Such an experiment is not easy, especially without detailed knowledge of the Hi, but as that becomes available the more the study becomes a possibility. With maps of the ionizing stellar population, nebular gas and ionization structure, Hi distribution including large and small scale kinematics, it will become possible to generate sets of model galaxies that are based upon real systems for which Ly observations have been obtained. Transfer simulations in such models will then recover the Ly morphology and spectral profile, that can be tested against observation.
Acknowledgements.
I acknowledge the support of the Swedish Research Council, Vetenskapsrådet and the Swedish National Space Board (SNSB). This research has made use of the NASA/IPAC Extragalactic Database (NED) which is operated by the Jet Propulsion Laboratory, California Institute of Technology, under contract with the National Aeronautics and Space Administration. I would like to extend warm thanks to my friends and collaborators for comments and feedback on the manuscript: John Cannon, Mark Dijkstra, Daniel Kunth, Peter Laursen, J. Miguel Mas-Hesse, Jens Melinder, Héctor Otí Floranes, Ivana Orlitová, Daniel Schaerer and Anne Verhamme. Lucia Guaita is thanked for making equivalent width tables available for Figure 11. Further I would like to thank Göran Östlin, Claudia Scarlata, Sebastiano Cantalupo, Len Cowie, and many others, especially those from the 2013 NORDITA Ly workshops, for valuable and stimulating discussions. I thank the anonymous referee for several careful readings of the manuscript, and providing many thoughtful comments that have greatly improved the content.References
- Atek et al. (2008) Atek, H., Kunth, D., Hayes, M., Östlin, G., & Mas-Hesse, J. M. 2008, A&A, 488, 491
- Atek et al. (2009a) Atek, H., Kunth, D., Schaerer, D., et al. 2009a, A&A, 506, L1
- Atek et al. (2014) —. 2014, A&A, 561, A89
- Atek et al. (2009b) Atek, H., Schaerer, D., & Kunth, D. 2009b, A&A, 502, 791
- Atek et al. (2011) Atek, H., Siana, B., Scarlata, C., et al. 2011, ApJ, 743, 121
- Bacon et al. (2010) Bacon, R., Accardo, M., Adjali, L., et al. 2010, in Society of Photo-Optical Instrumentation Engineers (SPIE) Conference Series, Vol. 7735, Society of Photo-Optical Instrumentation Engineers (SPIE) Conference Series
- Barger et al. (2012) Barger, A. J., Cowie, L. L., & Wold, I. G. B. 2012, ApJ, 749, 106
- Bigiel & Blitz (2012) Bigiel, F., & Blitz, L. 2012, ApJ, 756, 183
- Bik et al. (2015) Bik, A., Östlin, G., Hayes, M., et al. 2015, A&A, 576, L13
- Blanc et al. (2011) Blanc, G. A., Adams, J. J., Gebhardt, K., et al. 2011, ApJ, 736, 31
- Bland & Tully (1988) Bland, J., & Tully, B. 1988, Nature, 334, 43
- Borthakur et al. (2014) Borthakur, S., Heckman, T. M., Leitherer, C., & Overzier, R. A. 2014, Science, 346, 216
- Calzetti et al. (2000) Calzetti, D., Armus, L., Bohlin, R. C., et al. 2000, ApJ, 533, 682
- Calzetti & Kinney (1992) Calzetti, D., & Kinney, A. L. 1992, ApJ, 399, L39
- Calzetti et al. (1994) Calzetti, D., Kinney, A. L., & Storchi-Bergmann, T. 1994, ApJ, 429, 582
- Cannon et al. (2004) Cannon, J. M., Skillman, E. D., Kunth, D., et al. 2004, ApJ, 608, 768
- Cantalupo et al. (2012) Cantalupo, S., Lilly, S. J., & Haehnelt, M. G. 2012, MNRAS, 425, 1992
- Caplan & Deharveng (1986) Caplan, J., & Deharveng, L. 1986, A&A, 155, 297
- Charlot & Fall (1993) Charlot, S., & Fall, S. M. 1993, ApJ, 415, 580
- Ciardullo et al. (2012) Ciardullo, R., Gronwall, C., Wolf, C., et al. 2012, ApJ, 744, 110
- Cowie et al. (2010) Cowie, L. L., Barger, A. J., & Hu, E. M. 2010, ApJ, 711, 928
- Cowie et al. (2011) —. 2011, ApJ, 738, 136
- Curtis-Lake et al. (2012) Curtis-Lake, E., McLure, R. J., Pearce, H. J., et al. 2012, MNRAS, 422, 1425
- Danforth et al. (2014) Danforth, C. W., Tilton, E. M., Shull, J. M., et al. 2014, ArXiv e-prints, arXiv:1402.2655
- Davidsen et al. (1977) Davidsen, A. F., Hartig, G. F., & Fastie, W. G. 1977, Nature, 269, 203
- Deharveng et al. (1986) Deharveng, J. M., Joubert, M., & Kunth, D. 1986, in Star-forming Dwarf Galaxies and Related Objects, ed. D. Kunth, T. X. Thuan, J. Tran Thanh Van, J. Lequeux, & J. Audouze, 431–437
- Deharveng et al. (2008) Deharveng, J.-M., Small, T., Barlow, T. A., et al. 2008, ApJ, 680, 1072
- Dekel et al. (2009) Dekel, A., Birnboim, Y., Engel, G., et al. 2009, Nature, 457, 451
- Dijkstra (2014) Dijkstra, M. 2014, PASA, 31, 40
- Dijkstra & Jeeson-Daniel (2013) Dijkstra, M., & Jeeson-Daniel, A. 2013, MNRAS, 435, 3333
- Dressler et al. (2014) Dressler, A., Henry, A., Martin, C. L., et al. 2014, ArXiv e-prints, arXiv:1412.0655
- Duval et al. (2014) Duval, F., Schaerer, D., Östlin, G., & Laursen, P. 2014, A&A, 562, A52
- Finkelstein et al. (2009) Finkelstein, S. L., Cohen, S. H., Malhotra, S., & Rhoads, J. E. 2009, ApJ, 700, 276
- Finkelstein et al. (2011) Finkelstein, S. L., Cohen, S. H., Moustakas, J., et al. 2011, ApJ, 733, 117
- Garel et al. (2012) Garel, T., Blaizot, J., Guiderdoni, B., et al. 2012, MNRAS, 422, 310
- Giavalisco et al. (1996) Giavalisco, M., Koratkar, A., & Calzetti, D. 1996, ApJ, 466, 831
- Grimes et al. (2007) Grimes, J. P., Heckman, T., Strickland, D., et al. 2007, ApJ, 668, 891
- Grimes et al. (2009) Grimes, J. P., Heckman, T., Aloisi, A., et al. 2009, ApJS, 181, 272
- Guaita et al. (2010) Guaita, L., Gawiser, E., Padilla, N., et al. 2010, ApJ, 714, 255
- Guaita et al. (2011) Guaita, L., Acquaviva, V., Padilla, N., et al. 2011, ApJ, 733, 114
- Hartmann et al. (1984) Hartmann, L. W., Huchra, J. P., & Geller, M. J. 1984, ApJ, 287, 487
- Hartmann et al. (1988) Hartmann, L. W., Huchra, J. P., Geller, M. J., O’Brien, P., & Wilson, R. 1988, ApJ, 326, 101
- Hashimoto et al. (2013) Hashimoto, T., Ouchi, M., Shimasaku, K., et al. 2013, ApJ, 765, 70
- Hayes et al. (2007) Hayes, M., Östlin, G., Atek, H., et al. 2007, MNRAS, 382, 1465
- Hayes et al. (2005) Hayes, M., Östlin, G., Mas-Hesse, J. M., et al. 2005, A&A, 438, 71
- Hayes et al. (2011) Hayes, M., Schaerer, D., Östlin, G., et al. 2011, ApJ, 730, 8
- Hayes et al. (2010) Hayes, M., Östlin, G., Schaerer, D., et al. 2010, Nature, 464, 562
- Hayes et al. (2013) —. 2013, ApJ, 765, L27
- Hayes et al. (2014) Hayes, M., Östlin, G., Duval, F., et al. 2014, ApJ, 782, 6
- Heckman et al. (2005) Heckman, T. M., Hoopes, C. G., Seibert, M., et al. 2005, ApJ, 619, L35
- Heckman et al. (2011) Heckman, T. M., Borthakur, S., Overzier, R., et al. 2011, ApJ, 730, 5
- Hill et al. (2008) Hill, G. J., Gebhardt, K., Komatsu, E., et al. 2008, in Astronomical Society of the Pacific Conference Series, Vol. 399, Panoramic Views of Galaxy Formation and Evolution, ed. T. Kodama, T. Yamada, & K. Aoki, 115
- Hoopes et al. (2007) Hoopes, C. G., Heckman, T. M., Salim, S., et al. 2007, ApJS, 173, 441
- Hu et al. (2009) Hu, E. M., Cowie, L. L., Kakazu, Y., & Barger, A. J. 2009, ApJ, 698, 2014
- Hu et al. (1998) Hu, E. M., Cowie, L. L., & McMahon, R. G. 1998, ApJ, 502, L99
- Hummer & Storey (1987) Hummer, D. G., & Storey, P. J. 1987, MNRAS, 224, 801
- James et al. (2014) James, B. L., Aloisi, A., Heckman, T., Sohn, S. T., & Wolfe, M. A. 2014, ApJ, 795, 109
- Jaskot & Oey (2013) Jaskot, A. E., & Oey, M. S. 2013, ApJ, 766, 91
- Jaskot & Oey (2014) —. 2014, ApJ, 791, L19
- Jensen et al. (2014) Jensen, H., Hayes, M., Iliev, I. T., et al. 2014, MNRAS, 444, 2114
- Jones et al. (2013) Jones, T. A., Ellis, R. S., Schenker, M. A., & Stark, D. P. 2013, ApJ, 779, 52
- Kalberla et al. (2005) Kalberla, P. M. W., Burton, W. B., Hartmann, D., et al. 2005, A&A, 440, 775
- Kennicutt (1983) Kennicutt, Jr., R. C. 1983, ApJ, 272, 54
- Kennicutt & Kent (1983) Kennicutt, Jr., R. C., & Kent, S. M. 1983, AJ, 88, 1094
- Kereš et al. (2005) Kereš, D., Katz, N., Weinberg, D. H., & Davé, R. 2005, MNRAS, 363, 2
- Kinney et al. (1993) Kinney, A. L., Bohlin, R. C., Calzetti, D., Panagia, N., & Wyse, R. F. G. 1993, ApJS, 86, 5
- Kunth et al. (2003) Kunth, D., Leitherer, C., Mas-Hesse, J. M., Östlin, G., & Petrosian, A. 2003, ApJ, 597, 263
- Kunth et al. (1994) Kunth, D., Lequeux, J., Sargent, W. L. W., & Viallefond, F. 1994, A&A, 282, 709
- Kunth et al. (1998) Kunth, D., Mas-Hesse, J. M., Terlevich, E., et al. 1998, A&A, 334, 11
- Lacy et al. (1982) Lacy, J. H., Malkan, M., Becklin, E. E., et al. 1982, ApJ, 256, 75
- Lanzetta et al. (1995) Lanzetta, K. M., Bowen, D. V., Tytler, D., & Webb, J. K. 1995, ApJ, 442, 538
- Laursen et al. (2013) Laursen, P., Duval, F., & Östlin, G. 2013, ApJ, 766, 124
- Laursen et al. (2009) Laursen, P., Sommer-Larsen, J., & Andersen, A. C. 2009, ApJ, 704, 1640
- Lebouteiller et al. (2013) Lebouteiller, V., Heap, S., Hubeny, I., & Kunth, D. 2013, A&A, 553, A16
- Leitherer et al. (2013) Leitherer, C., Chandar, R., Tremonti, C. A., Wofford, A., & Schaerer, D. 2013, ApJ, 772, 120
- Leitherer et al. (1999) Leitherer, C., Schaerer, D., Goldader, J. D., et al. 1999, ApJS, 123, 3
- Lequeux et al. (1995) Lequeux, J., Kunth, D., Mas-Hesse, J. M., & Sargent, W. L. W. 1995, A&A, 301, 18
- Madau & Dickinson (2014) Madau, P., & Dickinson, M. 2014, ARA&A, 52, 415
- Malhotra et al. (2012) Malhotra, S., Rhoads, J. E., Finkelstein, S. L., et al. 2012, ApJ, 750, L36
- Martin et al. (2010) Martin, C., Moore, A., Morrissey, P., et al. 2010, in Society of Photo-Optical Instrumentation Engineers (SPIE) Conference Series, Vol. 7735, Society of Photo-Optical Instrumentation Engineers (SPIE) Conference Series
- Martin et al. (2015) Martin, C. L., Dijkstra, M., Henry, A., et al. 2015, ApJ, 803, 6
- Mas-Hesse et al. (2003) Mas-Hesse, J. M., Kunth, D., Tenorio-Tagle, G., et al. 2003, ApJ, 598, 858
- Meier & Terlevich (1981) Meier, D. L., & Terlevich, R. 1981, ApJ, 246, L109
- Morrissey et al. (2007) Morrissey, P., Conrow, T., Barlow, T. A., et al. 2007, ApJS, 173, 682
- Natta & Panagia (1984) Natta, A., & Panagia, N. 1984, ApJ, 287, 228
- Neufeld (1991) Neufeld, D. A. 1991, ApJ, 370, L85
- Oke & Zimmerman (1979) Oke, J. B., & Zimmerman, B. 1979, ApJ, 231, L13
- Osterbrock (1962) Osterbrock, D. E. 1962, ApJ, 135, 195
- Östlin et al. (2009) Östlin, G., Hayes, M., Kunth, D., et al. 2009, AJ, 138, 923
- Östlin et al. (2014) Östlin, G., Hayes, M., Duval, F., et al. 2014, ApJ, 797, 11
- Otí-Floranes et al. (2012) Otí-Floranes, H., Mas-Hesse, J. M., Jiménez-Bailón, E., et al. 2012, A&A, 546, A65
- Ott et al. (2005) Ott, J., Walter, F., & Brinks, E. 2005, MNRAS, 358, 1453
- Ott et al. (2012) Ott, J., Stilp, A. M., Warren, S. R., et al. 2012, AJ, 144, 123
- Pardy et al. (2014) Pardy, S. A., Cannon, J. M., Östlin, G., et al. 2014, ApJ, 794, 101
- Partridge & Peebles (1967) Partridge, R. B., & Peebles, P. J. E. 1967, ApJ, 147, 868
- Peña-Guerrero & Leitherer (2013) Peña-Guerrero, M. A., & Leitherer, C. 2013, AJ, 146, 158
- Pellegrini et al. (2012) Pellegrini, E. W., Oey, M. S., Winkler, P. F., et al. 2012, ApJ, 755, 40
- Pentericci et al. (2014) Pentericci, L., Vanzella, E., Fontana, A., et al. 2014, ApJ, 793, 113
- Pettini et al. (2002) Pettini, M., Rix, S. A., Steidel, C. C., et al. 2002, ApJ, 569, 742
- Pritchet (1994) Pritchet, C. J. 1994, PASP, 106, 1052
- Prochaska et al. (2011) Prochaska, J. X., Kasen, D., & Rubin, K. 2011, ApJ, 734, 24
- Raiter et al. (2010) Raiter, A., Schaerer, D., & Fosbury, R. A. E. 2010, A&A, 523, A64
- Rauch et al. (2008) Rauch, M., Haehnelt, M., Bunker, A., et al. 2008, ApJ, 681, 856
- Rivera-Thorsen et al. (2015) Rivera-Thorsen, T. E., Hayes, M., Östlin, G., et al. 2015, ApJ, 805, 14
- Rubin et al. (2011) Rubin, K. H. R., Prochaska, J. X., Ménard, B., et al. 2011, ApJ, 728, 55
- Savage & Sembach (1996) Savage, B. D., & Sembach, K. R. 1996, ARA&A, 34, 279
- Scarlata & Panagia (2015) Scarlata, C., & Panagia, N. 2015, ApJ, 801, 43
- Scarlata et al. (2009) Scarlata, C., Colbert, J., Teplitz, H. I., et al. 2009, ApJ, 704, L98
- Schaerer (2003) Schaerer, D. 2003, A&A, 397, 527
- Schaerer et al. (2011) Schaerer, D., Hayes, M., Verhamme, A., & Teyssier, R. 2011, A&A, 531, A12
- Schechter (1976) Schechter, P. 1976, ApJ, 203, 297
- Shapley et al. (2003) Shapley, A. E., Steidel, C. C., Pettini, M., & Adelberger, K. L. 2003, ApJ, 588, 65
- Stark et al. (2010) Stark, D. P., Ellis, R. S., Chiu, K., Ouchi, M., & Bunker, A. 2010, MNRAS, 408, 1628
- Steidel et al. (2011) Steidel, C. C., Bogosavljević, M., Shapley, A. E., et al. 2011, ApJ, 736, 160
- Strickland et al. (2004) Strickland, D. K., Heckman, T. M., Colbert, E. J. M., Hoopes, C. G., & Weaver, K. A. 2004, ApJ, 606, 829
- Takada (2010) Takada, M. 2010, in American Institute of Physics Conference Series, Vol. 1279, American Institute of Physics Conference Series, ed. N. Kawai & S. Nagataki, 120–127
- Tenorio-Tagle et al. (1999) Tenorio-Tagle, G., Silich, S. A., Kunth, D., Terlevich, E., & Terlevich, R. 1999, MNRAS, 309, 332
- Terlevich et al. (1993) Terlevich, E., Diaz, A. I., Terlevich, R., & Vargas, M. L. G. 1993, MNRAS, 260, 3
- Thuan & Izotov (1997) Thuan, T. X., & Izotov, Y. I. 1997, ApJ, 489, 623
- Thuan et al. (1999) Thuan, T. X., Lipovetsky, V. A., Martin, J.-M., & Pustilnik, S. A. 1999, A&AS, 139, 1
- Tremonti et al. (2004) Tremonti, C. A., Heckman, T. M., Kauffmann, G., et al. 2004, ApJ, 613, 898
- Tresse & Maddox (1998) Tresse, L., & Maddox, S. J. 1998, ApJ, 495, 691
- Tumlinson et al. (2013) Tumlinson, J., Thom, C., Werk, J. K., et al. 2013, ApJ, 777, 59
- Vader et al. (1993) Vader, J. P., Frogel, J. A., Terndrup, D. M., & Heisler, C. A. 1993, AJ, 106, 1743
- Valls-Gabaud (1993) Valls-Gabaud, D. 1993, ApJ, 419, 7
- van Zee et al. (1998) van Zee, L., Westpfahl, D., Haynes, M. P., & Salzer, J. J. 1998, AJ, 115, 1000
- Veilleux & Rupke (2002) Veilleux, S., & Rupke, D. S. 2002, ApJ, 565, L63
- Verhamme et al. (2012) Verhamme, A., Dubois, Y., Blaizot, J., et al. 2012, A&A, 546, A111
- Verhamme et al. (2008) Verhamme, A., Schaerer, D., Atek, H., & Tapken, C. 2008, A&A, 491, 89
- Verhamme et al. (2006) Verhamme, A., Schaerer, D., & Maselli, A. 2006, A&A, 460, 397
- Walter et al. (2008) Walter, F., Brinks, E., de Blok, W. J. G., et al. 2008, AJ, 136, 2563
- Wofford et al. (2013) Wofford, A., Leitherer, C., & Salzer, J. 2013, ApJ, 765, 118
- Wold et al. (2014) Wold, I. G. B., Barger, A. J., & Cowie, L. L. 2014, ApJ, 783, 119
- Wu et al. (1980) Wu, C.-C., Boggess, A., & Gull, T. R. 1980, ApJ, 242, 14
- Yajima et al. (2014) Yajima, H., Li, Y., Zhu, Q., et al. 2014, MNRAS, 440, 776
- Zastrow et al. (2013) Zastrow, J., Oey, M. S., Veilleux, S., & McDonald, M. 2013, ApJ, 779, 76
- Zastrow et al. (2011) Zastrow, J., Oey, M. S., Veilleux, S., McDonald, M., & Martin, C. L. 2011, ApJ, 741, L17