The Transitional Disk around IRAS 04125+2902
Abstract
Resolved submillimeter imaging of transitional disks is increasingly revealing the complexity of disk structure. Here we present the first high-resolution submillimeter image of a recently identified transitional disk around IRAS 04125+2902 in the Taurus star-forming region. We measure an inner disk hole of 20 AU around IRAS 04125+2902 by simultaneously modeling new 880 m Submillimeter Array (SMA) data along with an existing spectral energy distribution supplemented by new Discovery Channel Telescope (DCT) photometry. We also constrain the outer radius of the dust disk in IRAS 04125+2902 to 50–60 AU. Such a small dust disk could be attributed to initial formation conditions, outward truncation by an unseen companion, or dust evolution in the disk. Notably, the dust distribution of IRAS 04125+2902 resembles a narrow ring (35 AU) composed of large dust grains at the location of the disk wall. Such narrow dust rings are also seen in other transitional disks and may be evidence of dust trapping in pressure bumps, possibly produced by planetary companions. More sensitive submillimeter observations of the gas are necessary to further probe the physical mechanisms at work in shaping the spatial distribution of large dust in this disk. Interestingly, the IRAS 04125+2902 disk is significantly fainter than other transitional disks that have been resolved at submillimeter wavelengths, hinting that more objects with large disk holes may exist at the faint end of the submillimeter luminosity distribution that await detection with more sensitive imaging telescopes.
Subject headings:
planets and satellites: formation — protoplanetary disks — planet-disk interactions — stars: pre-main sequence — infrared: planetary systems — submillimeter: planetary systems1. Introduction
Transitional disks have been singled out for their possible connection to planet formation. These disks have significant depletions of dust in their inner regions and many researchers have proposed that such clearing is due to planet-disk interactions (see review by Espaillat et al., 2014). Potential protoplanets have also been identified in these disks (e.g., Kraus et al., 2011; Huélamo et al., 2011; Reggiani et al., 2014; Biller et al., 2014), lending further support to the idea that planets are leading to the observed disk clearings. However, alternative mechanisms such as photoevaporation (Hollenbach et al., 1994; Clarke et al., 2001) can explain a subset of transitional disks (Alexander & Armitage, 2009; Owen et al., 2011). A more detailed look at these objects is warranted to understand the links to planet formation.
The detail in which we can study transitional disk structure has greatly improved over time. The holes in transitional disks were first inferred based on “dips” seen in the ground-based infrared (IR) spectral energy distributions (SEDs; Strom et al., 1989; Skrutskie et al., 1990). Spitzer later greatly expanded the known number of transitional disks (e.g., Muzerolle et al., 2010; Kim et al., 2013) and provided much more detailed SEDs. Spitzer IRS allowed for detailed modeling (e.g., D’Alessio et al., 2005), as well as the detection of gaps in disks (as opposed to holes) later dubbed “pre-transitional” (Espaillat et al., 2007). Such modeling inferred that the gaps and holes in these pre-transitional disks and transitional disks were very large, of the order of 10s of AU (Calvet et al., 2005; Brown et al., 2007; Espaillat et al., 2007). Submillimeter images confirmed these predictions by revealing large cavities in the distribution of large grains in the disk (e.g., Hughes et al., 2007; Brown et al., 2008; Hughes et al., 2009; Brown et al., 2009; Andrews et al., 2009; Isella et al., 2010b; Andrews et al., 2011b).
Resolved submillimeter interferometric imaging of disks is greatly expanding our understanding of the spatial distributions of dust and gas. Submillimeter images have revealed that the large dust grains in the disk do not extend as far out as the gas in some objects (e.g., Isella et al., 2007; Panić et al., 2009; Andrews et al., 2012; Rosenfeld et al., 2013; de Gregorio-Monsalvo et al., 2013; Pineda et al., 2014; Piétu et al., 2014). The small dust disks seen in these observations have been interpreted as evidence of dust evolution, in particular dust radial drift (e.g., Weidenschilling, 1977; Barrière-Fouchet et al., 2005; Laibe et al., 2008). Birnstiel & Andrews (2014) showed that dust radial drift will lead to the concentration of larger grains at smaller radii, as well as a sharp outward truncation of the disk, as is observed (e.g., Andrews et al., 2012). This differentiates the signatures of dust radial drift from those of dust grain growth, which should also lead to the concentration of larger grains towards the inner radii the disk, but not a sharp outward truncation of the disk (Birnstiel & Andrews, 2014). In the case of transitional disks, dust radial drift can lead to concentrations of dust at the outer wall as the dust gets trapped due to pressure bumps in the gas produced by planetary companions (e.g., Zhu et al., 2012; Pinilla et al., 2012) and recent observations point to the detection of such “dust traps” in disks (e.g., Rosenfeld et al., 2013; Casassus et al., 2013; Fukagawa et al., 2013; van der Marel et al., 2013; Isella et al., 2013; Pérez et al., 2014; Pineda et al., 2014).
Note that most of the above studies have focused on the brightest submillimeter disks. Submillimeter observations to date have found that there is a high frequency of large cavities amongst the more luminous half of the disk population. Andrews et al. (2011b) estimated that at least 1 in 5 of the disks in the bright half of the Taurus and Ophiuchus submillimeter luminosity distribution have cavities with radii 15 AU. This suggests holes and gaps tend to be found in more massive disks, which was also found in a demographic study of Taurus by Najita et al. (2007). However, this may be due to a selection effect given that few faint disks have been resolved.
Here we add observations of a faint (20 mJy at 1.3 mm; Andrews et al., 2013) transitional disk in Taurus to the growing literature on (pre-)transitional disks. We present an SMA high-resolution 880 m image of IRAS 04125+2902 as well as new UVBRI photometry from the DCT. IRAS 04125+2902 was first identified as a candidate member of Taurus by Kenyon et al. (1994) and later confirmed as a member by Luhman et al. (2009) who identified it as an M-type star. A transitional disk was inferred using Spitzer IRAC and MIPS photometry (Luhman et al., 2009) and later Spitzer IRS spectra (Furlan et al., 2011). IRAS 04125+2902 joins the previously imaged Taurus (pre-)transitional disks around GM Aur, DM Tau, UX Tau A, LkCa 15, and RY Tau (Piétu et al., 2006; Hughes et al., 2009; Isella et al., 2010a; Andrews et al., 2011b, a; Isella et al., 2012, 2014).
This paper is organized into the following sections. In Section 2, we present the SMA and DCT observations of IRAS 04125+2902. In Section 3, we constrain the stellar properties and derive an accretion rate for IRAS 04125+2902. We also report the results of simultaneous broad-band SED and submillimeter visibility modeling. In Section 4, we discuss our results in light of previous transitional disk studies. Finally, in Section 5, we summarize the key results of this work.
2. Observations and Data Reduction
2.1. Submillimeter Data
IRAS 04125+2902 was observed with the 8-element SMA interferometer on Mauna Kea, Hawaii using the 345 GHz dual-sideband receivers in the compact (10–70 m baselines; 2011 Oct 26), extended (30–230 m baselines; 2011 Aug 19), and very extended (70–500 m baselines; 2011 Sep 8) configurations. The SMA correlator was configured to process 4 GHz of bandwidth per sideband, centered 6 GHz from the local oscillator frequency of 340.8 GHz (880 m), divided into 48 spectral chunks containing 32 coarse resolution (3.4 MHz) channels each.
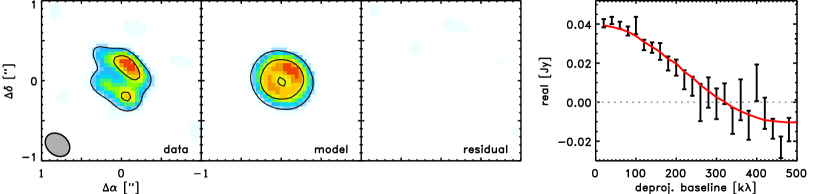
One chunk centered on the CO =32 transition at 345.796 GHz had slightly higher resolution (corresponding to a velocity resolution of 0.7 km s-1). Note that we did not detect CO emission from our target. We do not derive an upper limit since the line is not detected and there is substantial molecular cloud contamination in the CO line. The observations cycled between IRAS 04125+2902 and the nearby quasars 3C 111 (1.8 Jy) and J0510+180 (0.9 Jy) over 10–15 minute intervals. Bright quasars (3C 84, 3C 279) and primary flux calibration sources (Uranus, Callisto) were observed when the target had low elevation. Observing conditions were generally good, with precipitable water vapor levels under 2 mm. The raw visibilities were calibrated using the MIR111http://www.cfa.harvard.edu/ cqi/mircook.html software package. The passband response was corrected based on observations of bright quasars, and the amplitude scale was referenced to Uranus and Callisto. Complex gain calibration was performed using the repeated observations of the nearby quasars. The visibilities were spectrally binned into wideband continuum channels; the data from all three configurations were then combined. The calibrated visibilities were Fourier inverted (using a Briggs weighting with robust parameter of -1, chosen by experimentation to represent the best combination of angular resolution and SN for these data.), deconvolved, and then restored with a synthesized CLEAN beam using standard tasks in the MIRIAD package. The resulting image, shown in Figure 1, has a synthesized beam size of , and an RMS noise level of 1.3 mJy beam-1. We measure a flux density of 0.0270.001 Jy for IRAS 04125+2902. The flux density was estimated from the shortest visibility spacings, but one finds the same values (within the uncertainties) from integrating the synthesized images within the 1 contours or a reasonable aperture (10 in radius).
| Target | U | B | V | R | I |
|---|---|---|---|---|---|
| IRAS 04125+2902 |
2.2. Optical Data
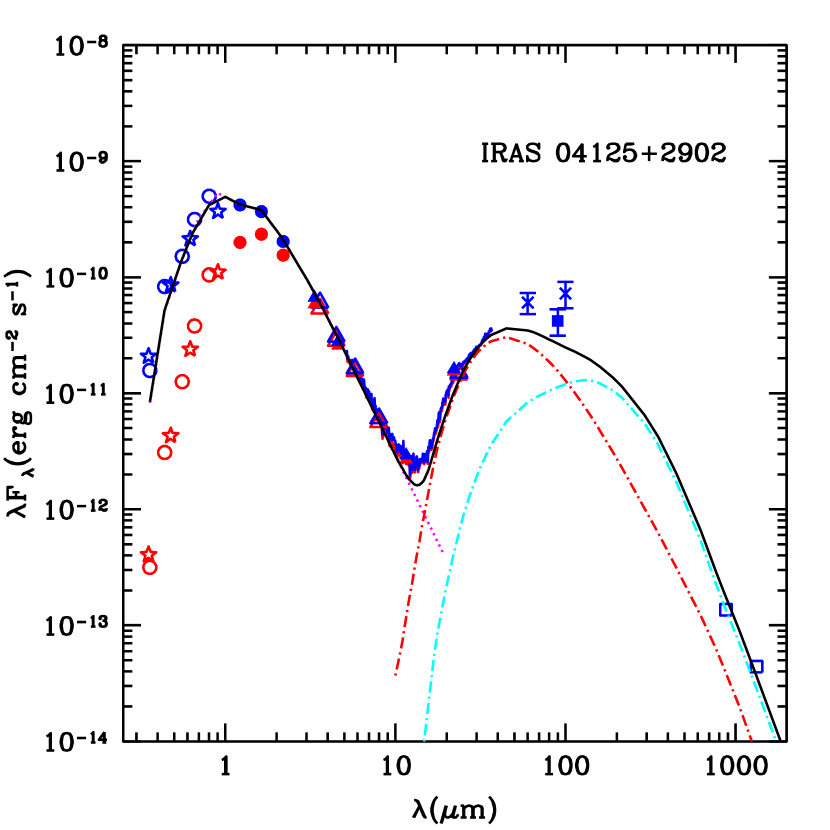
On 2013 Nov 29 we used the Large Monolithic Imager222http://www.lowell.edu/techSpecs/LMI/LMI.html (LMI) on the 4.3 m DCT to obtain UBVRI photometry of IRAS 04125+2902. The FOV of the LMI is ( per unbinned pixel). We used 2 2 pixel binning for these observations ( per pixel). The bias, flat-field, and overscan calibration of the CCD images were performed using the ccdred package in IRAF. The photometric calibration of all images was carried out interactively using the daophot and photcal packages in IRAF, with standard stars selected from Landolt (1992) and following the procedure outlined in Massey & Davis (1992). Photometry is presented in Table 1 and Figure 2. Note that our data of IRAS 04125+2902 are consistent with previous - (17.83, 17.44), - (14.39, 14.34), and -band (12.81) measurements from the US Naval Observatory catalog (Zacharias et al., 2009) given the observational and calibration uncertainties. For clarity, we do not show these additional data in Figure 2. Our IRAS 04125+2902 data are also consistent with previous SDSS data (Figure 2; Adelman-McCarthy et al., 2011) within the uncertainties.
3. Analysis & Results
In this section, we first review the disk model used in this work. We then discuss the adopted and derived stellar properties and accretion rate, which are used as inputs in the model. Finally, we present the first detailed modeling of IRAS 04125+2902. In short, we generated synthetic images for a grid of disk models with the best chi-squared values from SED fitting and compared them to the observed submm images to arrive at our best fit. Individually, SED modeling and submm image modeling have their limitations, but below we discuss how modeling SEDs and submm images together can help break some model degeneracies.
3.1. Disk Model
Here we use the disk models of D’Alessio et al. (1998, 1999, 2001, 2005, 2006). The application of these models to the particular case of fitting transitional disks has been discussed in detail before by Espaillat et al. (2010). In short, the D’Alessio et al. models are of irradiated, accretion disks around pre-main-sequence stars. The temperature and density structure of the disk is calculated iteratively and the surface density of the disk is tied to the accretion rate. A transitional disk model has a hole relative to a full disk model (D’Alessio et al., 2006). There is a frontally illuminated “wall” at the edge of the hole (i.e., at the inner edge of the disk). This wall dominates the mid-infrared (MIR) emission (from 20–30 m) and the disk dominates the emission beyond 40 m.
The composition of dust used in the disk model impacts the resulting emission and derived disk properties (see Espaillat et al., 2010). Here we include silicates and graphite with fractional abundances of 0.004 and 0.0025, respectively, following the Draine & Lee (1984) model for the diffuse ISM. We calculate the silicate (olivine) and graphite opacities using Mie theory and optical constants from Dorschner et al. (1995) and Draine & Lee (1984), respectively. The models assume spherical grains with a size distribution that scales like between grain radii of and and is 3.5 (Mathis et al., 1977). In the wall and the disk atmosphere, is held fixed at 0.005 m while is varied to achieve the best fit to the SED, particularly the 10 m and 20 m silicate emission features. Near the disk midplane, the maximum grain size is held fixed at 1 mm (D’Alessio et al., 2006).
In fitting the outer wall of the disk, Twall, the temperature at the surface of the optically thin wall atmosphere, is adjusted to fit the SED. The height of the wall (zwall) is equal to the disk scale height (H) at the the radius in the disk at which the wall is located (). is derived using the best fitting following
| (1) |
where is the Stefan-Boltzmann constant, is the total mean optical depth in the disk, and and are the mean opacities to the incident and local radiation, respectively. is the stellar luminosity and () is the luminosity of the stellar accretion shock.
The parameters of the disk which are varied to fit the data are the viscosity parameter () and the settling parameter (). One can interpret varying for disks with the same inner and outer radii as fitting for the disk mass since M (see Equation 38 in D’Alessio et al., 1998). We note that the mass accretion rate onto the star does not necessarily reflect the mass transport across the disk nor do we expect that the mass accretion rate is constant throughout the disk. However, for simplicity, here we assume that the mass accretion rate measured onto the star is representative of the disk’s accretion rate. We parameterize settling as a depletion of dust in the upper layers using (i.e., the dust-to-gas mass ratio of the disk atmosphere divided by the standard value), with a corresponding increment of the dust-to-gas mass ratio near the midplane. One can also vary the disk inclination and outer radius (), which can be constrained with high-resolution submillimeter images (e.g., Andrews et al., 2011b). Details of our fitting procedure in the particular case of IRAS 04125+2902 can be found in Section 3.4.
3.2. Stellar Properties
The star is a significant source of heating for the disk and so the stellar properties are important input parameters for the code. The stellar parameters used here are listed in Table 2. We use the same spectral type for IRAS 04125+2902 adopted in Furlan et al. (2011) and Andrews et al. (2013), which originally comes from Luhman et al. (2009) using IR spectra and with reported uncertainties of 0.25 subclasses. We measured a visual extinction by comparing observed colors to photospheric colors from Kenyon & Hartmann (1995). We adopted an RV of 3.1 (AVAJ=3.55) and dereddened our data using the extinction curve from McClure (2009) for IRAS 04125+2902 (AV 3). Note that our derived extinction value for IRAS 04125+2902 (AV=2.70.5) agrees with that found by Furlan et al. (2011) and Andrews et al. (2013). The stellar temperature (T∗) is taken from Kenyon & Hartmann (1995), based upon the adopted spectral type. The luminosity is calculated with dereddened -band photometry from 2MASS (Skrutskie et al., 2006) following Kenyon & Hartmann (1995) assuming a distance of 14020 pc for Taurus (Bertout et al., 1999). R∗ is calculated using the derived luminosity and adopted temperature. M∗ was derived with the Siess et al. (2000) pre-main sequence evolutionary tracks using T∗ and L∗. The uncertainties in L∗ and R∗ are dominated by the uncertainty of the extinction measurement. We note that our values for the luminosity and mass are in good agreement with those found by Andrews et al. (2013) with a Bayesian inference approach.
| Stellar Properties | |
|---|---|
| M∗ (M☉)1 | 0.50.1 |
| R∗ (R☉)1 | 1.50.1 |
| T∗ (K)2 | 372070 |
| L∗ ()1 | 0.400.06 |
| AV1 | 2.70.5 |
| Spectral Type2 | M1.250.25 |
| Inclination (∘)3 | 30 |
| (M☉ yr-1)1 | 310-10 |
| Outer Wall & Disk | |
| amax (m)3 | 10–100 |
| Twall (K)3 | 85–95 |
| zwall (AU)4 | 1.8–2.5 |
| Rwall (AU)4 | 18–24 |
| Rdisk (AU)3 | 50–60 |
| 3 | 0.01–1.0 |
| 3 | 0.0001–0.0003 |
| Mdisk (M☉)4 | 0.005–0.007 |
3.3. Accretion Rate
In the current paradigm of TTS accretion, material from the disk is channeled onto the stellar surface via the stellar magnetospheric field lines (e.g., Uchida & Shibata, 1984), forming a hot accretion shock (5,000-10,000 K Calvet & Gullbring, 1998). Accretion rates can be derived by measuring the accretion luminosity due to the accretion shock on the stellar surface, which emits excess emission above the stellar photosphere, that peaks in the ultraviolet (Calvet & Gullbring, 1998). -band excesses have been found to correlate with the total accretion shock excess (Calvet & Gullbring, 1998) and so -band data can measure the ultraviolet excess above the stellar photosphere (e.g., Gullbring et al., 1998; White & Ghez, 2001; Rigliaco et al., 2012; Espaillat et al., 2012).
Here we measure an accretion rate for IRAS 04125+2902 of 310-10 M☉ yr-1 using the DCT -band data presented in this work and the relation in Gullbring et al. (1998). This method has a typical uncertainty of a factor of 3 (Calvet et al., 2004). This low accretion rate is consistent with IRAS 04125+2902’s previously reported H equivalent width of 2.30.3 (Luhman et al., 2009), which is expected from a non-accreting, weak-TTS (White & Basri, 2003). Note that at such low , -band emission may be dominated by chromospheric emission (Houdebine et al., 1996; Franchini et al., 1998), which can contaminate mass accretion rate measurements (Ingleby et al., 2011). Future high-resolution ultraviolet spectra are needed to reliably constrain the accretion rate of this object further.
3.4. SED and Submillimeter Image Modeling
Using the stellar properties in Table 2, we ran a grid of 2,300 models where we varied amax (5 m, 10 m, 100 m), Twall (75 K, 85 K, 95 K, 105 K), (0.01, 0.1, 0.5, 1.0), (0.01, 0.001, 0.0001, 0.0003), Rdisk (40 AU, 50 AU, 60 AU, 100 AU), and the inclination (20∘, 40∘, 60∘). The parameters explored for amax, Twall, and Rdisk were constrained based on inspection of the SED and submm image. The lack of strong silicate emission features in the IRS spectrum points to large (5 m) grains in the disk atmosphere. The steep slope of the IRS spectrum longwards of 10 m suggests cooler temperatures for the wall atmosphere (100 K). The submm image points to a relatively small (100 AU) disk. The parameters explored for , , and the inclination were chosen to cover a broad range of values with reasonable sampling while avoiding creating a computationally prohibitive grid. We note that the above grid is not meant to be exhaustive or lead to a unique fit. We aim to identify the best fits to our data from a reasonable parameter space meant to guide future observations.
For the models with the best chi-squared fits to the SED, high resolution model images at 880 m were generated, and their Fourier transforms were sampled at the same spatial frequencies as the SMA observations. These model visibilities were then compared with the data in the form of an azimuthally-averaged deprojected visibilities (see Andrews et al., 2009), as shown in the right-hand panel of Figure 1. Synthesis images were generated from the model and residual visibilities in the same way as for the data (middle panel of Figures 1).
A representative best fitting model to the submillimeter image and SED is shown in Figures 1 – 2, respectively. The particular model shown has Rwall=20 AU, Rdisk=50 AU, = 0.5, = 0.0003, =20∘, and amax=100 m. We do not show each of our best-fitting models since the fits are very similar. Instead, in Table 2 we list the parameter ranges for the best fitting models. The best fits to both the SED and submillimeter visibilities of IRAS 04125+2902 were achieved with disk models with wall radii of 18–24 AU and disk radii of 50–60 AU. We can also constrain the inclination of the disk of IRAS 04125+2902 to 30∘. (We note that we arrived at this constraint by running additional models with inclinations between 0∘ and 40∘ in increments of 5∘ for the best fitting model shown in the figures.) The wall and disk radii derived here as well as the inclinations were driven by the fit to the submillimeter visibilities since submm/mm imaging is sensitive to the spatial distribution of large dust in the disk midplane while the SED is not as sensitive to the spatial distribution of dust. The wall radius is determined from the null position in the visibilities. A11 showed that the submm/mm visibilities are sensitive to changes in the wall radius of about 10 given typical noise levels. See A11 for a more in depth description regarding the implications of disk ring morphologies and nulls in submm visibilities.
The derived maximum grain size in the wall and disk atmosphere is largely based on fitting the IR SED since it is more sensitive to smaller dust grains in the upper layers of the disk. In general, the dust grain size in the disk atmosphere can be constrained by the silicate emission features in the Spitzer IRS spectrum. Here we can get reasonable fits to the SED with amax between 10 to 100 m. The and parameters were constrained by fitting the IR and submm/mm SED data. Espaillat et al. (2012) found that disk models with the same -to- ratio will produce very similar emission in the IR but substantially different emission in the submmmm. Hence, submmmm data are necessary in conjunction with IR data to break the degeneracy between dust settling and disk mass. Since in this work we have both IR and submmmm data, we can break this degeneracy. Here we find models with between 0.01 to 1 and between 0.0001 and 0.0003 reproduce the SED and submm image best. Note that none of our models reproduce the IRAS/AKARI data and we exclude this data from our chi-squared fitting. It is unclear with the available data if the relatively high the IRAS/AKARI fluxes can be attributed to variability, as has been seen in other (pre-)transitional disks (e.g., Muzerolle et al., 2010; Espaillat et al., 2011; Flaherty et al., 2012). We leave further exploration of this to future work.
We conclude that there is a relatively narrow 35 AU ring of large dust grains around IRAS 04125+2902. Our submillimeter images are not of high enough sensitivity to confirm or exclude disk asymmetries or to test the extent of its dust disk relative to the gas disk. We leave this and more detailed studies of the dust properties to future multi-wavelength work, which would be ideally suited to probe this.
4. Discussion
IRAS 04125+2902 is one of the faintest transitional disks imaged to date. Andrews et al. (2011b) found that at least 1 in 5 submillimeter-bright, and therefore massive, disks are (pre-)transitional disks. However, here we find a hole in a relatively low submillimeter luminosity disk. Given that the lower luminosity end of the disk submillimeter brightness distribution has yet to be probed, this suggests that many such disks may contain holes and gaps.
The dust in the disk around IRAS 04125+2902 only extends from about 20 AU to 50–60 AU. This is reminiscent of a ring-like large dust grain distribution. We stress that our SMA observations only trace the submillimeter dust continuum and so this derived disk radius applies only to the large dust grains in the disk and not necessarily the disk overall. Due to the faintness of this object, we do not have high quality submillimeter data of the gas in the disk and cannot distinguish between a disk where both the gas and dust extend over small spatial scales or a disk where the dust is truncated to significantly smaller radii than the gas. With this in mind, below we speculate on the physical mechanisms that may underlie the observed spatial distribution of dust in the disk of IRAS 04125+2902. Higher sensitivity observations of the gas, preferably targeting dense gas tracers (e.g., CO isotopologues) given cloud contamination, are needed to explore the below scenarios further.
4.1. Small disk radii
Future submillimeter observations of the gas in the disk of IRAS 04125+2902 may reveal that the gas traces the dust distribution. In this case, such small gas and dust disks could be attributed to a wide range of initial conditions at the time of disk formation. Andrews et al. (2010) found an Mdisk-Rdisk correlation for disks in Ophiuchus in which fainter disks are smaller and less massive. Even though this work uses a different disk model to derive disk masses and outer radii, our results are roughly consistent with those of Andrews et al. (2010). Those authors propose that this mass-radius correlation could be the result of a wide range of initial conditions and viscous properties at time of disk formation.
Alternatively, smaller disks could be the result of outward truncation by an unseen companion. IRAS 04125+2902 is a 40 binary, which corresponds to a separation of 560 AU at 140 pc (A. Kraus, 2014, private communication). This companion is unlikely to be responsible for truncating the disk down to 50–60 AU according to the models of Artymowicz & Lubow (1994) which show that the disk should be truncated to 0.2–0.5 , where is the binary semi-major axis. However, a caveat is that we do not know the eccentricity of the companion’s orbit and disk truncation due to a highly eccentric companion (0.75) is not well constrained. There are no equal brightness companions outside of 10 AU and no companions near the substellar boundary outside 30 AU (A. Kraus, 2014, private communication). Therefore, if the disk of IRAS 04125+2902 is being outwardly truncated by a companion, this companion would have to be 50 MJupiter.
If the gas around IRAS 04125+2902 is found to extend to much larger radii than the dust in the disk or multi-wavelength resolved data show a size-wavelength anti-correlation, then the small dust disk observed here may be evidence of dust evolution. Resolved submillimeter observations are increasingly revealing that large dust grains in disks are distributed on more compact spatial scales than the smaller grains and gas in the disk. For example, the mm-sized dust in the transitional disk of TW Hya is truncated at 60 AU while CO gas emission is detected much further out in the disk to about 215 AU (Andrews et al., 2012). Evidence for compact dust emission is also seen in full disks. The full disk around AS 209 was observed at four wavelengths between 0.88 mm and 9.8 mm; at longer wavelengths, the dust disk is more compact, a signature that larger grains are more concentrated towards the center of the disk (Pérez et al., 2012).
Observations revealing concentrations of larger dust grains towards the center of the disk have been interpreted as evidence of dust evolution. Larger dust grains are not tied to the gas and are expected to drift radially inward (Weidenschilling, 1977). This is due to the difference in velocities between gas and dust of different sizes. Dust travels at the Keplerian velocity while the gas is partially pressure supported. In general, the gas pressure decreases with radius so the gas pressure gradient is negative and the gas travels at sub-Keplerian velocities. Smaller dust grains with slower radial velocities are coupled to the gas. Larger dust grains experience a headwind from the gas; the larger dust slows down and loses angular momentum, spiraling in towards the star. More recent work by Birnstiel & Andrews (2014) has shown that this process will not only lead to more compact distributions for larger dust grains, but that there should also be a distinct, sharp outer edge in the dust distribution, as is observed (e.g., Andrews et al., 2012). Grain growth, in contrast, would lead to a more tapered edge (Birnstiel & Andrews, 2014).
4.2. Narrow dust rings
The distribution of the large dust grains in IRAS 04125+2902 is narrow (from about 20 AU to 50–60 AU) and ring-like. As stated earlier, more sensitive observations of the gas are needed to more firmly characterize the disk’s spatial properties. However, if it is revealed that the dust in IRAS 04125+2902 is more compact than the gas, IRAS 04125+2902 would be very similar to other transitional disks where concentrations of large grains have been detected at the outer wall (e.g., Rosenfeld et al., 2013). This has been interpreted as evidence of dust trapping due to pressure bumps in the gas, possibly induced by a planet (Zhu et al., 2012; Pinilla et al., 2012). In particular, simulations by Pinilla et al. (2012) show that this effect can lead to narrow rings of 20 AU in width at the location of the outer wall. In the transitional disk of V4046 Sgr, Rosenfeld et al. (2013) measure a ring of 16 AU in width at 37 AU. This is five times more compact than the gas in this disk, suggesting an accumulation of solids at the local gas maximum. In the pre-transitional disk of HD 100546, the CO (3-2) gas extends out to 350 AU, while a 20 AU ring of large dust grains is located at 50 AU (Pineda et al., 2014). Similarly, narrow rings of large dust grains are found in the (pre-)transitional disks SAO 206462, SR 21 (Pérez et al., 2014), and [PZ99] J160421.7-213028 (Zhang et al., 2014).
The above scenario of a dust trap formed by planets is compatible with the interpretation that the holes in disks are being carved out by planets (e.g., Paardekooper & Mellema, 2004; Zhu et al., 2011; Dodson-Robinson & Salyk, 2011). However, the accretion rate we measure here for IRAS 04125+2902 is very low (310-10 M☉ yr-1), making the hole in this disk a possible candidate for clearing due to photoevaporation (e.g., Hollenbach et al., 1994; Clarke et al., 2001; Alexander et al., 2006; Alexander & Armitage, 2007; Alexander et al., 2013). Owen et al. (2011) found that they could explain disk holes with radii 20 AU and accretion rates 10-8 M☉ yr-1 with photoevaporative clearing. However, a low accretion rate is also compatible with clearing due to a companion. Besides CoKu Tau, IRAS 04125+2902 has the lowest measured accretion rate of the (pre-)transitional disks in Taurus (Ingleby et al., 2013, Espaillat et al. 2014). The low accretion rate of CoKu Tau4 (10-10 M☉ yr-1; Cohen & Kuhi, 1979) and hole size (14 AU; Nagel et al., 2010) are consistent with clearing due to the stellar mass companion detected within the disk hole (Ireland & Kraus, 2008; Artymowicz & Lubow, 1994; Lubow et al., 1999). More work is needed to exclude or detect companions within the disk hole of IRAS 04125+2902.
Based on the above, IRAS 04125+2902’s accretion rate may indicate its hole is due to disk dispersal by photoevaporation or there is a massive companion in the inner disk. The first interpretation would be consistent with the proposal of Owen & Clarke (2012) that there are two distinct populations of transitional disks - those with low mm fluxes, small 10 AU holes, and low (10-9 M☉ yr-1) accretion rates and those with high mm fluxes, larger holes, and higher accretion rates. The former population is consistent with models of photoevaporation while the latter are not (Owen et al., 2011; Owen & Clarke, 2012). The former are also consistent with holes in disks developing later in the lifetime of the disk. Interestingly, Taurus has both populations. The second interpretation of dynamical clearing by a stellar or planetary mass companion would need gas observations to confirm that indeed a narrow ring of dust and gas exists at larger radii since, to the best of our knowledge, photoevaporation models do not predict such a feature.
Note that along with narrow rings in (pre-)transitional disks, asymmetries have also been detected, which have been interpreted as evidence of planet-induced vortices (Pérez et al., 2014; Casassus et al., 2013; Fukagawa et al., 2013; van der Marel et al., 2013; Isella et al., 2013; Pineda et al., 2014). Our observations are not of high enough signal-to-noise to confirm or exclude the presence of asymmetries in IRAS 04125+2902.
5. Summary
We performed the first detailed characterization of the recently identified transitional disk around IRAS 04125+2902 in Taurus. We presented a new SMA high-resolution 880 m image and DCT photometry. Using simultaneous SED and submillimeter visibilities modeling, we find the following:
1. IRAS 04125+2902 is the faintest transitional disk imaged in detail to date, suggesting that there are more faint, less massive disks with inner holes that have not yet been detected.
2. IRAS 04125+2902 has a dust disk radius of 50–60 AU. Gas observations of IRAS 04125+2902 are necessary to explore the spatial distribution of the dust relative to the gas. If the dust and gas are both truncated to similarly small outer radii, this could point to a wide range of initial conditions in disks or an unseen companion. If the dust is significantly more compact than the gas in the disk, this could be evidence of dust radial drift in disks.
3. IRAS 04125+2902’s dust is distributed as a narrow ring (35 AU) of large grains at the location of the disk wall (20 AU). Such narrow dust rings are also seen in other transitional disks and may be evidence of dust trapping in pressure bumps, possibly produced by planetary companions. However, here we also measure a very low accretion rate for IRAS 04125+2902 of 310-10 M☉ yr-1, making this object a potential candidate for clearing due to photoevaporation. More sensitive submillimeter observations of the gas in this disk should be able to distinguish between clearing due to planets or photoevaporation in the disk.
ALMA will play an important role in probing the lower luminosity end of the transitional disk population and revealing the true frequency of small dust disks and narrow rings in transitional disks.
References
- Adelman-McCarthy et al. (2011) Adelman-McCarthy, J. K., & et al. 2011, VizieR Online Data Catalog, 2306, 0
- Alexander et al. (2013) Alexander, R., Pascucci, I., Andrews, S., Armitage, P., & Cieza, L. 2013, ArXiv e-prints
- Alexander & Armitage (2007) Alexander, R. D., & Armitage, P. J. 2007, MNRAS, 375, 500
- Alexander & Armitage (2009) —. 2009, ApJ, 704, 989
- Alexander et al. (2006) Alexander, R. D., Clarke, C. J., & Pringle, J. E. 2006, MNRAS, 369, 229
- Andrews et al. (2013) Andrews, S. M., Rosenfeld, K. A., Kraus, A. L., & Wilner, D. J. 2013, ApJ, 771, 129
- Andrews et al. (2011a) Andrews, S. M., Rosenfeld, K. A., Wilner, D. J., & Bremer, M. 2011a, ApJ, 742, L5
- Andrews et al. (2011b) Andrews, S. M., Wilner, D. J., Espaillat, C., Hughes, A. M., Dullemond, C. P., McClure, M. K., Qi, C., & Brown, J. M. 2011b, ApJ, 732, 42
- Andrews et al. (2009) Andrews, S. M., Wilner, D. J., Hughes, A. M., Qi, C., & Dullemond, C. P. 2009, ApJ, 700, 1502
- Andrews et al. (2010) —. 2010, ApJ, 723, 1241
- Andrews et al. (2012) Andrews, S. M., et al. 2012, ApJ, 744, 162
- Artymowicz & Lubow (1994) Artymowicz, P., & Lubow, S. H. 1994, ApJ, 421, 651
- Barrière-Fouchet et al. (2005) Barrière-Fouchet, L., Gonzalez, J.-F., Murray, J. R., Humble, R. J., & Maddison, S. T. 2005, A&A, 443, 185
- Beichman et al. (1988) Beichman, C. A., Neugebauer, G., Habing, H. J., Clegg, P. E., & Chester, T. J., eds. 1988, Infrared astronomical satellite (IRAS) catalogs and atlases. Volume 1: Explanatory supplement, Vol. 1
- Bertout et al. (1999) Bertout, C., Robichon, N., & Arenou, F. 1999, A&A, 352, 574
- Biller et al. (2014) Biller, B. A., et al. 2014, ApJ, 792, L22
- Birnstiel & Andrews (2014) Birnstiel, T., & Andrews, S. M. 2014, ApJ, 780, 153
- Brown et al. (2008) Brown, J. M., Blake, G. A., Qi, C., Dullemond, C. P., & Wilner, D. J. 2008, ApJ, 675, L109
- Brown et al. (2009) Brown, J. M., Blake, G. A., Qi, C., Dullemond, C. P., Wilner, D. J., & Williams, J. P. 2009, ApJ, 704, 496
- Brown et al. (2007) Brown, J. M., et al. 2007, ApJ, 664, L107
- Calvet & Gullbring (1998) Calvet, N., & Gullbring, E. 1998, ApJ, 509, 802
- Calvet et al. (2004) Calvet, N., Muzerolle, J., Briceño, C., Hernández, J., Hartmann, L., Saucedo, J. L., & Gordon, K. D. 2004, AJ, 128, 1294
- Calvet et al. (2005) Calvet, N., et al. 2005, ApJ, 630, L185
- Casassus et al. (2013) Casassus, S., et al. 2013, Nature, 493, 191
- Clarke et al. (2001) Clarke, C. J., Gendrin, A., & Sotomayor, M. 2001, MNRAS, 328, 485
- Cohen & Kuhi (1979) Cohen, M., & Kuhi, L. V. 1979, ApJS, 41, 743
- D’Alessio et al. (2001) D’Alessio, P., Calvet, N., & Hartmann, L. 2001, ApJ, 553, 321
- D’Alessio et al. (2006) D’Alessio, P., Calvet, N., Hartmann, L., Franco-Hernández, R., & Servín, H. 2006, ApJ, 638, 314
- D’Alessio et al. (1999) D’Alessio, P., Calvet, N., Hartmann, L., Lizano, S., & Cantó, J. 1999, ApJ, 527, 893
- D’Alessio et al. (1998) D’Alessio, P., Canto, J., Calvet, N., & Lizano, S. 1998, ApJ, 500, 411
- D’Alessio et al. (2005) D’Alessio, P., et al. 2005, ApJ, 621, 461
- de Gregorio-Monsalvo et al. (2013) de Gregorio-Monsalvo, I., et al. 2013, A&A, 557, A133
- Dodson-Robinson & Salyk (2011) Dodson-Robinson, S. E., & Salyk, C. 2011, ApJ, 738, 131
- Dorschner et al. (1995) Dorschner, J., Begemann, B., Henning, T., Jaeger, C., & Mutschke, H. 1995, A&A, 300, 503
- Draine & Lee (1984) Draine, B. T., & Lee, H. M. 1984, ApJ, 285, 89
- Espaillat et al. (2007) Espaillat, C., Calvet, N., D’Alessio, P., Hernández, J., Qi, C., Hartmann, L., Furlan, E., & Watson, D. M. 2007, ApJ, 670, L135
- Espaillat et al. (2011) Espaillat, C., Furlan, E., D’Alessio, P., Sargent, B., Nagel, E., Calvet, N., Watson, D. M., & Muzerolle, J. 2011, ApJ, 728, 49
- Espaillat et al. (2010) Espaillat, C., et al. 2010, ApJ, 717, 441
- Espaillat et al. (2012) —. 2012, ApJ, 747, 103
- Espaillat et al. (2014) —. 2014, ArXiv e-prints
- Flaherty et al. (2012) Flaherty, K. M., Muzerolle, J., Rieke, G., Gutermuth, R., Balog, Z., Herbst, W., Megeath, S. T., & Kun, M. 2012, ApJ, 748, 71
- Franchini et al. (1998) Franchini, M., Morossi, C., & Malagnini, M. L. 1998, ApJ, 508, 370
- Fukagawa et al. (2013) Fukagawa, M., et al. 2013, PASJ, 65, L14
- Furlan et al. (2011) Furlan, E., et al. 2011, ApJS, 195, 3
- Gullbring et al. (1998) Gullbring, E., Hartmann, L., Briceno, C., & Calvet, N. 1998, ApJ, 492, 323
- Hollenbach et al. (1994) Hollenbach, D., Johnstone, D., Lizano, S., & Shu, F. 1994, ApJ, 428, 654
- Houdebine et al. (1996) Houdebine, E. R., Mathioudakis, M., Doyle, J. G., & Foing, B. H. 1996, A&A, 305, 209
- Huélamo et al. (2011) Huélamo, N., Lacour, S., Tuthill, P., Ireland, M., Kraus, A., & Chauvin, G. 2011, A&A, 528, L7
- Hughes et al. (2007) Hughes, A. M., Wilner, D. J., Calvet, N., D’Alessio, P., Claussen, M. J., & Hogerheijde, M. R. 2007, ApJ, 664, 536
- Hughes et al. (2009) Hughes, A. M., et al. 2009, ApJ, 698, 131
- Ingleby et al. (2011) Ingleby, L., et al. 2011, ApJ, 743, 105
- Ingleby et al. (2013) —. 2013, ApJ, 767, 112
- Ireland & Kraus (2008) Ireland, M. J., & Kraus, A. L. 2008, ApJ, 678, L59
- Isella et al. (2010a) Isella, A., Carpenter, J. M., & Sargent, A. I. 2010a, ApJ, 714, 1746
- Isella et al. (2014) Isella, A., Chandler, C. J., Carpenter, J. M., Pérez, L. M., & Ricci, L. 2014, ApJ, 788, 129
- Isella et al. (2010b) Isella, A., Natta, A., Wilner, D., Carpenter, J. M., & Testi, L. 2010b, ApJ, 725, 1735
- Isella et al. (2012) Isella, A., Pérez, L. M., & Carpenter, J. M. 2012, ApJ, 747, 136
- Isella et al. (2013) Isella, A., Pérez, L. M., Carpenter, J. M., Ricci, L., Andrews, S., & Rosenfeld, K. 2013, ApJ, 775, 30
- Isella et al. (2007) Isella, A., Testi, L., Natta, A., Neri, R., Wilner, D., & Qi, C. 2007, A&A, 469, 213
- Ishihara et al. (2010) Ishihara, D., et al. 2010, A&A, 514, A1
- Kenyon et al. (1994) Kenyon, S. J., Dobrzycka, D., & Hartmann, L. 1994, AJ, 108, 1872
- Kenyon & Hartmann (1995) Kenyon, S. J., & Hartmann, L. 1995, ApJS, 101, 117
- Kim et al. (2013) Kim, K. H., et al. 2013, ApJ, 769, 149
- Kraus et al. (2011) Kraus, A. L., Ireland, M. J., Martinache, F., & Hillenbrand, L. A. 2011, ApJ, 731, 8
- Laibe et al. (2008) Laibe, G., Gonzalez, J.-F., Fouchet, L., & Maddison, S. T. 2008, A&A, 487, 265
- Landolt (1992) Landolt, A. U. 1992, AJ, 104, 340
- Lubow et al. (1999) Lubow, S. H., Seibert, M., & Artymowicz, P. 1999, ApJ, 526, 1001
- Luhman et al. (2010) Luhman, K. L., Allen, P. R., Espaillat, C., Hartmann, L., & Calvet, N. 2010, ApJS, 186, 111
- Luhman et al. (2009) Luhman, K. L., Mamajek, E. E., Allen, P. R., & Cruz, K. L. 2009, ApJ, 703, 399
- Massey & Davis (1992) Massey, P., & Davis, L. E. 1992, A User s Guide to Stellar CCD Photometry with IRAF, http://iraf.noao.edu/iraf/ftp/iraf/docs/daophot2.ps.Z
- Mathis et al. (1977) Mathis, J. S., Rumpl, W., & Nordsieck, K. H. 1977, ApJ, 217, 425
- McClure (2009) McClure, M. 2009, ApJ, 693, L81
- Muzerolle et al. (2010) Muzerolle, J., Allen, L. E., Megeath, S. T., Hernández, J., & Gutermuth, R. A. 2010, ApJ, 708, 1107
- Nagel et al. (2010) Nagel, E., D’Alessio, P., Calvet, N., Espaillat, C., Sargent, B., Hernández, J., & Forrest, W. J. 2010, ApJ, 708, 38
- Najita et al. (2007) Najita, J. R., Strom, S. E., & Muzerolle, J. 2007, MNRAS, 378, 369
- Owen & Clarke (2012) Owen, J. E., & Clarke, C. J. 2012, MNRAS, 426, L96
- Owen et al. (2011) Owen, J. E., Ercolano, B., & Clarke, C. J. 2011, MNRAS, 412, 13
- Paardekooper & Mellema (2004) Paardekooper, S.-J., & Mellema, G. 2004, A&A, 425, L9
- Panić et al. (2009) Panić, O., Hogerheijde, M. R., Wilner, D., & Qi, C. 2009, A&A, 501, 269
- Pérez et al. (2014) Pérez, L. M., Isella, A., Carpenter, J. M., & Chandler, C. J. 2014, ApJ, 783, L13
- Pérez et al. (2012) Pérez, L. M., et al. 2012, ApJ, 760, L17
- Piétu et al. (2006) Piétu, V., Dutrey, A., Guilloteau, S., Chapillon, E., & Pety, J. 2006, A&A, 460, L43
- Piétu et al. (2014) Piétu, V., Guilloteau, S., Di Folco, E., Dutrey, A., & Boehler, Y. 2014, A&A, 564, A95
- Pineda et al. (2014) Pineda, J. E., Quanz, S. P., Meru, F., Mulders, G. D., Meyer, M. R., Panić, O., & Avenhaus, H. 2014, ApJ, 788, L34
- Pinilla et al. (2012) Pinilla, P., Birnstiel, T., Ricci, L., Dullemond, C. P., Uribe, A. L., Testi, L., & Natta, A. 2012, A&A, 538, A114
- Rebull et al. (2010) Rebull, L. M., et al. 2010, ApJS, 186, 259
- Reggiani et al. (2014) Reggiani, M., et al. 2014, ApJ, 792, L23
- Rigliaco et al. (2012) Rigliaco, E., Natta, A., Testi, L., Randich, S., Alcalà, J. M., Covino, E., & Stelzer, B. 2012, A&A, 548, A56
- Rosenfeld et al. (2013) Rosenfeld, K. A., Andrews, S. M., Wilner, D. J., Kastner, J. H., & McClure, M. K. 2013, ApJ, 775, 136
- Siess et al. (2000) Siess, L., Dufour, E., & Forestini, M. 2000, A&A, 358, 593
- Skrutskie et al. (1990) Skrutskie, M. F., Dutkevitch, D., Strom, S. E., Edwards, S., Strom, K. M., & Shure, M. A. 1990, AJ, 99, 1187
- Skrutskie et al. (2006) Skrutskie, M. F., et al. 2006, AJ, 131, 1163
- Strom et al. (1989) Strom, K. M., Strom, S. E., Edwards, S., Cabrit, S., & Skrutskie, M. F. 1989, AJ, 97, 1451
- Uchida & Shibata (1984) Uchida, Y., & Shibata, K. 1984, PASJ, 36, 105
- van der Marel et al. (2013) van der Marel, N., et al. 2013, Science, 340, 1199
- Weidenschilling (1977) Weidenschilling, S. J. 1977, MNRAS, 180, 57
- White & Basri (2003) White, R. J., & Basri, G. 2003, ApJ, 582, 1109
- White & Ghez (2001) White, R. J., & Ghez, A. M. 2001, ApJ, 556, 265
- Wright et al. (2010) Wright, E. L., et al. 2010, AJ, 140, 1868
- Zacharias et al. (2009) Zacharias, N., et al. 2009, VizieR Online Data Catalog, 1315, 0
- Zhang et al. (2014) Zhang, K., Isella, A., Carpenter, J. M., & Blake, G. A. 2014, ApJ, 791, 42
- Zhu et al. (2012) Zhu, Z., Nelson, R. P., Dong, R., Espaillat, C., & Hartmann, L. 2012, ApJ, 755, 6
- Zhu et al. (2011) Zhu, Z., Nelson, R. P., Hartmann, L., Espaillat, C., & Calvet, N. 2011, ApJ, 729, 47