Spectroscopically resolving the Algol triple system
Abstract
Algol ( Persei) is the prototypical semi-detached eclipsing binary and a hierarchical triple system. From 2006 to 2010 we obtained 121 high-resolution and high-S/N échelle spectra of this object. Spectral disentangling yields the individual spectra of all three stars, and greatly improved elements both the inner and outer orbits. We find masses of , and . The disentangled spectra also give the light ratios between the components in the and bands. Atmospheric parameters for the three stars are determined, including detailed elemental abundances for Algol A and Algol C. We find the following effective temperatures: K, K and K. The projected rotational velocities are km s-1, km s-1 and km s-1. This is the first measurement of the rotational velocity for Algol B, and confirms that it is synchronous with the orbital motion. The abundance patterns of components A and C are identical to within the measurement errors, and are basically solar. They can be summarised as mean metal abundances: [M/H] and [M/H]. A carbon deficiency is confirmed for Algol A, with tentative indications for a slight overabundance of nitrogen. The ratio of their abundances is (C/N), half of the solar value of (C/N). The new results derived in this study, including detailed abundances and metallicities, will enable tight constraints on theoretical evolutionary models for this complex system.
keywords:
stars: fundamental parameters — stars: binaries: eclipsing — stars: binaries: spectroscopic — stars: individual: Algol1 Introduction
In his opening speach to IAU Colloquium 107 (‘Algols’), Batten (1989) was tempted to define an Algol system simply as “a binary in which the less massive component fills its Roche lobe and the other, which does not, is not degenerate”. The resulting evolutionary paradox can be solved by postulating an episode of mass transfer from what was initially the more massive component to its then less massive, and consequently less evolved, companion (Crawford 1955). This first, rapid, phase of mass exchange between the components eventually leads to an Algol-type system. Numerical calculations of the evolution of stars in binary systems have proved this hypothesis to be very plausible (cf. Paczyński 1971).
Direct comparison of the observed properties of Algol systems to evolutionary model calculations are sparse, because only a few Algols have reliable measurements of their physical properties (Maxted & Hilditch 1996), and because models are unavailable for the relevant parameters. The main observational obstacle in the determination of the accurate stellar quantities for Algols arises due to the intrinsic faintness of the Roche-lobe filling mass-losing component, the reason they were detected only due to technological advances in light detectors (c.f. Tomkin 1989). Model calculations for Algol with both conservative and non-conservative binary evolution have only been calculated by Sarna (1993).
Changes in the chemical composition of the surface layers of stars which have experienced mass transfer are a feature of theoretical predictions. Layers that were once deep inside the star become exposed after mass transfer. This makes it possible to observationally probe CNO nucleosynthetic processes in stellar cores, and the efficiency of different mixing processes in stellar interiors. In that sense CNO abundances can serve as a sensitive probe of stellar structure and evolution.
Carbon depletions have been detected in Algol and in Algol-type systems (Parthasarathy, Lambert & Tomkin 1979, 1983; Cugier & Hardorp 1988; Cugier 1989; Tomkin et al. 1993, Ibanoğlu et al. 2012). However, comparisons to theoretical models were rather scarce since detailed evolutionary calculations were performed for only a few Algol-type systems, and were limited to tracing the evolution of carbon (De Greve & Cugier 1989; Sarna 1992, 1993; De Greve 1993). On the observational side, Algol systems can be rather difficult. The secondary stars are Roche-lobe filling subgiants which are usually intrinsically faint, but still bright enough to contaminate the spectra of the primary stars. Many contain third components, as is the case for Algol itself, which further complicates spectroscopic analyses. Therefore, we initiated a new observational project to obtain high-resolution échelle spectroscopy of Algol systems to which we could apply the powerful technique of spectral disentangling (hereafter spd) and thus obtain the individual spectra of the component stars. This makes detailed spectroscopic analyses much more straightforward, and allows the study of the spectral characteristics of all components over wide wavelength ranges. To aid the comparison with theoretical evolutionary models of semi-detached binary systems, we have also considered other diagnostic species. The primary target is nitrogen abundance, which is very sensitive to CNO nucleosynthetic processes. Theoretical models of binary star evolution have also been calculated for non-conservative mass transfer. A detailed description of our methodology was given in a study of the hot Algol u Her (Kolbas et al. 2014). a large sample of mass transferring binaries of Algol type can reveal all the different evolutionary paths which these complex binary systems encounter.
The chemical composition was determined from spectra covering the full optical range for only a few Algol-type binaries. Beside u Her (Kolbas et al. 2014), abundance patterns have been derived for RZ Cas (Narusawa et al. 2006, Tkachenko et al. 2009), TW Dra (Tkachenko et al. 2010), TX UMa (Glazunova et al. 2011), and AS Eri (Narusawa 2013). All these objects except u Her have a pulsating primary component.
In this work we present new high-quality optical spectroscopy of Algol with two main goals Firstly, improved measurement of the masses of all three components through spectral disentangling, with a special emphasis in studying the spectrum of a faint Roche-lobe-filling component over a broad spectral range. Secondly, spectroscopic determination of the effective temperature, abundance patterns and bulk metallicities from disentangled spectra of the individual components. Our aim is to assemble useful observational constraints for comparison to evolutionary model calculations; in particular, the first measurement of the bulk metallicity of the components of Algol.
We first summarise the rich observational history of Algol, and highlight some recent observational results. In Sect. 3 we present new échelle spectra of Algol. Sect. 4 covers the spd of the spectra and the determination of new orbital elements for both inner and outer orbits. The analysis of the disentangled spectra for all three components is presented in Sect. 5, including detailed calculations of abundances for Algol A and metallicity for Algol C. The results are discussed in the context of mass transfer between Algol A and B in Sect. 6. Finally, Sect. 7 summarises our results and discusses future work.
2 Algol in a nutshell
Algol ( Persei, HD 19356) is a hierarchical triple star system (Frieboes-Conde et al. 1970; Söderhjelm 1980). It is extremely bright () and its periodic variability is the subject of a long observational history. There is evidence that Algol’s periodicity was recorded by the ancient Egyptians three millennia ago, in the Cairo Calendar (Jetsu et al. 2013). The first well-documented discovery of the 2.867 day periodicity, and an explanation in terms of stellar eclipses, was given by Goodricke (1783) based on naked-eye observations. Thanks to its brightness, Algol also has a long history of observations with many techniques and at many wavelengths. An outstanding and exhaustive account of these studies was given by Wecht (2006).
The inner pair consists of a late-B-type star in orbit with an early-K-type subgiant which fills its Roche lobe. This close system exhibits partial eclipses, and is the prototype of the Algol class of eclipsing binaries. A tertiary component pursues a 680 d orbit around the inner pair; its spectral classification has been variously given as late-A, early-F, and Am. This description of Algol emerged from decades of primarily spectroscopic and photometric studies (cf. Friebos-Conde et al. 1970; Hill et al. 1971; Söderhjelm 1980; Richards et al. 1988). The main difficulty of these early studies was the intrinsic faintness of the cool subgiant, which is exacerbated by dilution due to the light of component C. Algol C is brighter than Algol B, but its contribution has previously been very difficult to quantify (Richards et al. 1988). A breakthrough came with its eventual spectroscopic detection in the infrared (Glusheva & Esipov 1967), and then radial velocity (RV) measurements which led to the determination of the dynamical masses for the components (Tomkin & Lambert 1978).
Other observational techniques have been helpful in constraining the orbital and physical characteristics of Algol. Rudy & Kemp (1978) found phase-locked polarization and independently determined the inclination of the eclipsing binary. Subsequently Kemp et al. (1983) discovered eclipse polarization, or the Chandrasekhar effect, further evaluated by Wilson & Liou (1993). The problem of the determination of the mutual orientations of the orbits in the Algol system has remainined open (Kemp et al. 1981).
Since the successful detection of Algol C with speckle interferometry (Labeyrie et al. 1974), Algol has often been a target for interferometric measurements, which have recently settled the issue of the true orientation of both orbits. Csizmadia et al. (2009) spatially resolved the inner pair with long baseline interferometry in combination with very long baseline interferometry (VLBI) radio observations. They found the inner orbit to be prograde, in disagreement with the retrograde movement found by Lestrade et al. (1993) from radio observations. This long-term controversy was solved by Zavala et al. (2010), who simultaneously resolved all three stellar components in the optical, achieving the then highest precision in angular measurements. The outer orbit was shown to be prograde and the inner orbit retrograde. VLBA radio (Peterson et al. 2010, 2011) and CHARA -band measurements (Baron et al. 2012) subsequently confirmed these orientations for both orbits. The most recent highlight of the interferometric studies is an unambiguous spatial resolution of the three stars in the Algol system with angular resolution 0.5 mas (Baron et al. 2012). This made possible the determination of the orbital and physical characteristics of the components (angular sizes and mass ratios) independently from previous studies. Baron et al. (2012) also determined the mutual inclination of the orbits to be much closer to perpendicularity than previously established. The distortion of the Roche-lobe-filling component B is clearly seen in the reconstructed image.
Another highlight of recent work on Algol is the first three-dimensional reconstruction of this system (Richards et al. 2012). These three-dimensional tomograms revealed previously undetected evidence of the mass transfer process, such as loop prominences and coronal mass ejections. Early predictions of the superhump phenomenon in Algol, i.e. the gas between the stars in close pair being threaded with a magnetic field even though the hot mass-gaining star is not know to have a magnetic field (Retter et al. 2005) have been supported by this new technique. Algol B is a late-type magnetically active subgiant found to be a strong radio and X-ray source (Wade & Hjellming 1972; White et al. 1986; Stern et al. 1992, 1995), and dominates in the spectrum of Algol at these wavelengths. In particular, X-ray studies have made possible a determination of the chemical abundances in the corona of Algol B (Drake 2003) as well both the X-ray-bright star Algol B and the X-ray-faint star Algol A (Yang et al. 2011).
3 High-resolution spectroscopy
Our observational programme of high-resolution and high signal-to-noise (S/N) spectroscopy of Algol was initiated with two observing runs in 2006 and 2007 at the 2.5-m Nordic Optical Telescope (NOT) at La Palma, Spain. We obtained 85 spectra of Algol using the Fibre-fed Echelle Spectrograph (FIES; Telting et al. 2014). FIES is housed in a dedicated climate-controlled building and has a high thermal and mechanical stability. The wavelength scale was established from thorium-argon exposures taken regularly throughout the observing nights. We used fibre 4 in bundle B, giving complete spectral coverage in the interval 3640–7360 Å at a reciprocal dispersion ranging from 0.023 Å px-1 in the blue to 0.045 Å px-1 in the red. The resolution of the instrument is roughly 3.5 px, giving a resolving power of 48 000. An exposure time of 15 s was used for all spectra, resulting in continuum S/N ratios in the region of 200–500 in the and bands.
In order to cover the long-period outer orbit of Algol, spectroscopic observations were taken from 2009 to 2010 at the Bohyunsan Optical Astronomy Observatory (BOAO), South Korea. A set of 36 spectra were secured with Bohyunsan Optical Échelle Spectrograph (BOES) mounted on the 1.8-m telescope (Kim et al. 2007). BOES has multiple spectral resolving powers up to 80 000, and covers thee wavelength range 3600 to 10 200 Å. A thorium-argon lamp was used for wavelength calibration and S/N ratios of 300–550 were achieved.
The spectra were bias-subtracted, flat-fielded and extracted with the iraf111iraf is distributed by the National Optical Astronomy Observatory, which are operated by the Association of the Universities for Research in Astronomy, Inc., under cooperative agreement with the NSF. échelle package routines. Normalisation and merging of the orders was performed with great care, using custom programs, to ensure that these steps did not cause any systematic errors in the resulting spectra (see Appendix).


4 Orbits and masses through spectral disentangling
The method of spd enables determination of the orbital elements of binary and multiple systems, along with the simultaneous separation of the individual spectra of the components, in a self-consistent way (Simon & Sturm 1994). In that sense it is a generalisation of the Doppler tomography method of Bagnuolo & Gies (1991) which was the first successful reconstruction of individual spectra for binary stars but which relies on predetermined RVs for the components for each spectrum. In spd only a time series of observed spectra are needed, with roughly uniform coverage of the RV motion of the stars (cf. Hensberge et al. 2008). Optimisation of the RVs is bypassed in favour of directly fitting for the orbital elements, as first implemented by Simon & Sturm (1994).
With no need for input template spectra, spd does not suffer from biases due to template mismatch (cf. Hensberge & Pavlovski 2007 and references therein). However, no comprehensive study of the error propagation in spd and comparison to cross-correlation has yet been undertaken. Some initial studies have indicated the method is ‘well-behaved’ (Hynes & Maxted 1998; Ilijić et al. 2001; Hensberge & Pavlovski 2007; Southworth & Clausen 2007).
The spd of Algol is challenging for the following reasons: (i) the system is triple; (ii) the secondary component is barely discernable in the optical spectra; (iii) the period of the outer orbit is long (680 d); and (iv) eclipse spectra could not be used due to significant distortion of the line profiles due to the Rossiter-McLaughlin effect (Rossiter 1924; McLaughlin 1924).
Spectra of several multiple systems have previously been successfully separated using different variants of the spd method (cf. Frémat et al. 2005; Gonzáles et al. 2006; Lee et al. 2008; Tamajo et al. 2012). Faint components with a fractional light contribution of only 5% have previously been detected using spd (e.g. Pavlovski et al. 2009; Lehmann et al. 2013; Tkachenko et al. 2014; Borkovits et al. 2014), including cases with only 2.5% (Torres et al. 2014), and 1.5–2% (Holmgren et al. 1999; Mayer et al. 2013) in the spectral region. As was shown in our preliminary reports on spd of Algol (Pavlovski et al. 2010; Kolbas et al. 2012) we are pushing the limit of the method because of the extreme faintness of Algol B (see Sect. 5.1).
The rotational distortion of the spectral lines during eclipse (the Rossiter-McLaughlin effect) violates the principal assumption of spectral disentangling that spectral line profiles are not intrinsically variable, so spectra obtained during eclipse cannot be used. Without such spectra there is insufficient variation in the light contributions of the components during the orbit, so the zeroth mode in the Fourier expansion is undetermined. This has the consequence that spectra can be only separated, and remain in the common continuum of the system. Renormalisation of the separated spectra of the individual components is discussed further in Sect. 5.1.
To perform spd we used the code fdbinary222hhtp://sail.zpf.fer.hr/fdbinary (Ilijić et al. 2004). fdbinary implements disentangling in the Fourier domain (Hadrava 1995) using fast fourier transforms, making it computationally efficient. It can also account for two orbits and three individual spectra, as is required for Algol. Five spectral segments were selected, paying particular attention to including enough spectral lines of Algol B to allow its velocity semiamplitude to be precisely determined. For the blue spectral region this is challenging since the fractional light contribution is less than 1% (see Sect. 5.1 and Fig. 2). The following spectral segments were used: 4176.9–4277.0, 4400.2–4614.7, 4929.1–5118.9, 5140.6–5305.1 and 5311.0–5520.0 Å. Only spectra taken outside eclipse were used, giving a total of 112 input spectra. To limit the computational demand we also stacked spectra taken in close succession, resulting in a total of 49 input spectra. Such spectra typically covered a time interval of 3 min, for which the RV of Algol B changes by a maximum of 0.5 km s-1, so velocity smearing is not a problem. The FIES and BOES datasets were also analysed first separately with the outer orbit fixed according to recent interferometric results (Czismadia et al. 2009; Zavala et al. 2010; Baron et al. 2012). The solution for the inner orbit was then used as an initial set of the orbital elements for solving both orbits simultaneously using the 49 spectra.
Hill et al. (1971) found that the inner orbit is slightly eccentric, . In our spd calculations the eccentricity of the inner orbit always converged to with a high confidence. Therefore, in the final set of the calculations, the eccentricity of the inner orbit was fixed to zero.
| Quantity | Notation | Unit | Value | Error |
|---|---|---|---|---|
| Inner orbit | ||||
| Period | d | 2.871362 | fixed | |
| Eccentricity | 0. | fixed | ||
| Periastron longitude | deg | 90. | fixed | |
| RV semiamplitude | km s-1 | 44.1 | 0.2 | |
| RV semiamplitude | km s-1 | 194.2 | 1.2 | |
| Mass ratio | 0.227 | 0.005 | ||
| Outer orbit | ||||
| Period | d | 680.168 | fixed | |
| Time of periastron | d | 2454433.2 | 1.1 | |
| Eccentricity | 0.227 | fixed | ||
| Periastron longitude | deg | 138.1 | 0.6 | |
| RV semiamplitude | km s-1 | 11.9 | 0.4 | |
| RV semiamplitude | km s-1 | 32.9 | 0.8 | |
| Mass ratio | 0.364 | 0.009 |
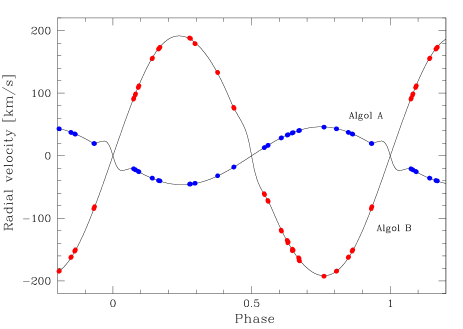
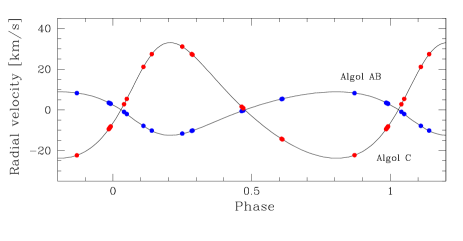
Whilst the coverage of the orbital cycle for the inner orbit is good (Fig. 1), the phase distribution of the observations for the outer orbit is not sufficient to determine all parameters simultaneously, so we fixed the eccentricity of this orbit. Recent independent interferometric studies give a very consistent result on its value of (Baron et al. 2012). Since the simplex algorithm is used for minimisation in fdbinary, care must be taken to avoid becoming trapped in local minima. We used 50 runs with 1000 iterations each. Fixing made the convergence stable and consistent. Our final solution for the two orbits is given in Table 1. It represents the mean values from the solutions of spd in the five selected spectral segments specified above. The errors quoted in Table 1 are standard deviations of the mean calculated from the solutions obtained for the five segments. More sophisticated error calculations for spd, such as the jackknife method (Pavlovski et al. 2011, 2014), were beyond our computational resources.
The comparison between the results presented in Table 1 and those from previous studies is interesting. First, we did not confirm the eccentricity for the inner orbit () which was reported in some previous studies, but rejected in others. In an extensive spectroscopic study Hill et al. (1971) examined a series of medium-resolution photographic spectra obtained at the Dominion Astrophysical Observatory. They found but were not able to detect the spectrum of the secondary star. It is not clear if and how this might affect the determination of RVs for the primary. Also, it should be noted that Hill et al. (1971) attributed a 32 year periodicity to apsidal motion in the inner orbit. The possibility of orbital eccentricity for the eclipsing pair has not been supported by past photometry of Algol (Wilson et al. 1972; Guinan et al. 1976; Söderhjelm 1980; Kim 1989).
The velocity semi-amplitude for Algol A found by Hill et al. (1971), km s-1, agrees within the uncertainties with the value derived in our work, km s-1. Also, it is encouraging that their velocity semi-amplitudes of the outer orbit, km s-1 and km s-1, are in agreement with our values, km s-1 and km s-1. Hill et al. (1971) were also able to determine the eccentricity of the outer orbit, , which was corroborated and improved by interferometric measurements (Zavala et al. 2010; Baron et al. 2012).
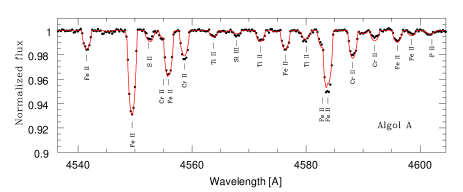
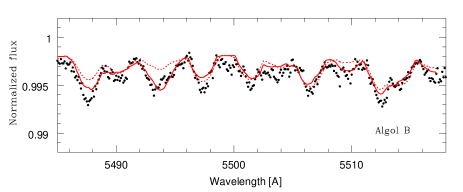
Two portions of disentangled spectra of the three components are presented in Fig. 2. The secondary spectrum is clearly isolated in the whole optical range, even though it contributes only 1% of the light around 4500 Å and somewhat less than 2% around 5500 Å (Sect. 5.1). The RV semi-amplitude for Algol B, , has two almost equally deep local minima around 194 and 211 km s-1. It is difficult to trace the reasons for this ambiguity but, besides the small light contribution, these might include imperfect phase distribution of the observations for the inner orbit, gaps in the phase distribution for the outer orbit, and possible systematics due to the use of two spectrographs and varying observing conditions. The for the lower solution is slightly better, so we adopted this as our final solution, km s-1. This value agrees with the only previous measurement, km s-1 (Tomkin & Lambert 1978).
Tomkin & Lambert (1978) calculated the spectroscopic mass ratio using the determined by Hill et al. (1971) and their own measurement, finding . This mass ratio was subsequently used in many studies on Algol, as it was the first mass ratio found via dynamical effects. Our value is slightly higher, . The mass ratio can be estimated from light curve for semi-detached eclipsing binaries, and there have been attempts to derive it this way. Kim (1989) used the ‘-search method’ to obtain exactly to the same value from light curves, . Determination of the astrometric orbit from the interferometric measurements also can yield the mass ratio. Baron et al. (2012) solved the orbital elements for both orbits and the mass ratio of the inner orbit from the relative positions of the components derived from the visibility functions. In addition, they derived the mass ratio of the outer orbit independently from parallax assumptions. They found and . This agrees with our value to within its relatively large uncertainties.
The mass ratio for the outer orbit derived from these different techniques is highly discrepant and needs clarification. However, it is encouraging that spectroscopic analyses are consistent, as Hill et al. (1971) found , compared to our value of .
5 Atmospheric diagnostics
5.1 Renormalisation of disentangled spectra
Without eclipse spectra or significant variations in the fractional light contribution between the components, spd can only be performed in the separation mode. The renormalisation of the individual spectra of the components can then be done using external information on the individual components’ fractional contribution to the total light of the system.
A simple way is to use the light ratio between the components from the light curve solution for eclipsing binaries (cf. Hensberge et al. 2000). However, the light curve solution of Algol is rather uncertain because the eclipses are partial and there is ‘third light’ from component C. On top of these obstacles, it is extremely difficult to acquire photometry of Algol due to its brightness and lack of suitable comparison stars within 10∘.
It is therefore not surprising that only a few complete light curves for Algol have been published. The most recent photometry (Kim 1989) was a series of photoelectric measurements in the and filters, obtained from 1982 to 1984 at Yonsei Observatory, Korea. The other light curves of Algol from the era of photoelectric photometry are those of Guinan et al. (1989) and Wilson et al. (1972). In addition, Stebbins secured an incomplete light curve in multiple passbands from 1949 to 1951 (Stebbins & Gordon 1975), Al-Naimiy et al. (1985) obtained unpublished observations in 1981, and light curves in the ultraviolet (Eaton 1975), and near-infrared (Chen & Reuning 1966) exist.
| Method | Source | ||
|---|---|---|---|
| Photometry | 0.940 0.010 0.050 | 0.893 0.029 0.078 | (1) |
| Photometry | 0.909 0.041 0.050 | 0.857 0.065 0.078 | (2) |
| Photometry | 0.929 0.012 0.059 | 0.894 0.035 0.071 | (3) |
| Photometry | 0.854 0.040 0.106 | 0.814 0.067 0.119 | (4) |
| Interferometry | 0.863 0.063 0.065 | (5) | |
| Spectroscopy | 0.943 0.008 0.049 | 0.915 0.018 0.067 | (6) |
Previous light curve analyses have not yet given a unique solution for Algol, primarily because of its complexity. Solutions of partially eclipsing binary stars inevitably suffer from degeneracy, which should be lifted using additional information (Garcia et al. 2014; Southworth et al. 2007). This is illustrated in Table 2 in which fractional light contributions (light dilution factors) for Algol are listed from several works. Wilson et al. (1972) used an estimate of the third light contribution derived spectroscopically by Fletcher (1964). The same approach was followed by Demircan (1978) who analysed the photometry published in Wilson et al. (1972). Since the secondary component had not yet been detected in the spectrum of Algol, the mass ratio between the components of the inner eclipsing pair had to be assumed from other considerations. But it is evident from the solutions derived in Richards et al. (1988) and Kim (1989) that the dynamical mass ratio measured by Tomkin & Lambert (1978) did not help to provide a consistent description of the Algol system. Richards et al. (1988) calculated a grid of models with different assumptions for the radiative properties of the third star, whilst Kim (1989) attempted to derive its contribution directly from his light curves. In this context we also list estimates of the light ratios measured in the interferometric observations by Zavala et al. (2010). Their estimates suffered from large uncertainties, and the fractional light contribution of 6% for Algol B is certainly too large.
Facing all these uncertainties in the determination of the fractional light contributions of the components, we rely on the extraction of these quantities from the disentangled spectra themselves. The information on the light dilution factor is contained in the spectral line depths in the disentangled (separated) spectra of an individual component. But caution is needed at this point since other effects could change the line depth in stellar spectrum and mimic light dilution effects in binary or multiple systems, such as metal abundance or chemical peculiarity of the component(s). Algol C is often characterised as an Am star, beginning with the spectroscopic analysis by Fletcher (1964).
In the optical spectrum of Algol the most prominent lines are H i and He i originating in the photosphere of the primary component (cf. Struve & Sahade 1957). Since He i lines are present in only the primary star’s spectrum, we used them for the determination of its effective temperature, , and fractional light contribution, . We used the program starfit (Kolbas et al. 2014) which compares disentangled component spectra to a grid of calculated theoretical spectra. starfit can handle the following parameters: effective temperature , surface gravity , fractional light contribution , projected rotational velocity , relative velocity shift between disentangled spectrum and rest-frame laboratory wavelengths, , and continuum corrections, . Optimisation is performed by a genetic algorithm (Charbonneau 1995), and can be done in constrained mode with disentangled spectra of the components for which the sum of the fractional light contributions should be (Tamajo et al. 2011). Grids of theoretical spectra were calculated in LTE (local thermodynamic equilibrium) using the uclsyn code (Smith 1992, Smalley et al. 2001)
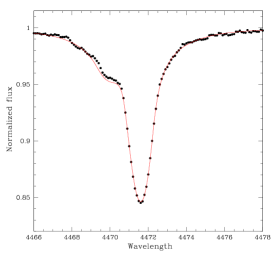
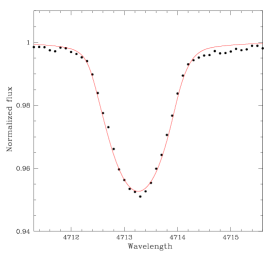
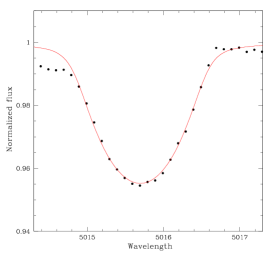
is constrained to be in the range 12 000 to 13 000 K (Richards et al. 1988; Kim 1989). Our disentangled spectra contain three He i lines suitable for the optimisation, at 4471, 4713 and 5015 Å. Unfortunately, the He i lines at 4388, 4920, 5047, and 5788 Å are either on the wings of Balmer lines, or are contaminated by metal or telluric lines, so are not suitable. To facilitate optimisation we first determined by optimal fitting of unblended metal lines in the primary’s disentangled spectrum ( or fwhm does not depend on the light dilution). In hot stars, a degeneracy exists between and for H i and He i lines, so we fixed in our calculations to (Richards et al. 1988). Also, it should be noted that model atmospheres are calculated assuming the ‘standard’ (solar) helium abundance with the fraction of helium atoms .
We found that the three He i line profiles are not well and consistently reproduced in the LTE approximation. This is not a surprise because discrepancies in the He i line profiles are the most severe at the low and high end of the temperature sequence (Auer & Mihalas 1970, 1973). Thus we decided to calculate He i line profiles in non-LTE. Our grid of theoretical spectra (Kolbas et al. 2014) was extended down to K. This is below the usual borderline used for NLTE spectrum synthesis of K. Almost perfect fits were achieved with He i line profiles in NLTE (Fig. 3, solid lines). Optimisation was performed separately for each line to find the wavelength-dependent fractional light contribution. An excellent convergence was found for almost same effective temperature, K, , and . Uncertanties in and were calculated with a Markov chain Monte Carlo technique (Ivezić et al. 2014). A refined measurement for Algol A is discussed below (Sect. 5.2).
As described in Sect. 4, spd enabled us to reconstruct almost the entire optical spectrum of Algol B, the first time this has been achieved (Figs. 2 and 4). A first attempt to match it to theoretical spectra with K indicated a low fractional light contribution, notably less than indicated by light curve solutions (Table 2). Again, the program starfit was used with only surface gravity as a fixed parameter, (Richards et al. 1988). The projected rotational velocity converged to km s-1, in good agreement with the expected synchronous rotational velocity for this star ( km s-1. The optimal fractional light contributions of Algol B are: and , with K. This is the most unexpected result of our study but quite secure since the spectral lines for the late G or early K subgiant are intrinsically deep and, for the expected , the light dilution is certainly no more than 2% in and less than 1% in .
5.2 Effective temperatures for the components
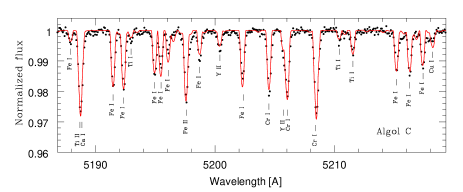
Detailed spectral analysis is possible for Algol A and Algol C, making it possible to fine-tune their measurements. The values determined in Sect. 5.1 served as starting points. A spectral analysis of the entire disentangled spectral range (– Å) was performed, using uclsyn. The equivalent widths (EWs) were measured for suitable lines in the renormalised disentangled spectra. Model atmospheres were calculated in LTE with the program atlas9 (Kurucz 1979), and abundances calculated for the measured EWs. Since Fe lines are the most numerous in the spectra of both stars, they served for the determination of and microturbulent velocity, . The spectrum of Algol A contains many Fe ii lines, but those of Fe i are few and weak. That of Algol C contains many Fe i lines but also a substantial number of Fe ii lines, which means fine-tuning of is possible using the Fe ionisation balance (see Fig. 4).
We determined and in a few iteration steps. was tuned so there was no correlation between Fe ii abundance and the excitation potential, EP, whilst the microturbulence, was found by requiring the Fe ii abundance to be independent of EW. We found K and km s-1. The uncertainties were calculated from the uncertainties in the determination of the slopes of (Fe ii) versus EP for and (Fe ii) versus EW for .
The atmospheric parameters for Algol C were determined in the same manner. Moreover, the Fe ionisation balance could be used for fine-tuning . Our final results are K, and km s-1. The uncertainties were derived in the same way as for Algol A, except that Fe i was used. The ionisation balance of Fe is well satisfied with a difference in abundance derived from Fe i and Fe ii lines of only .
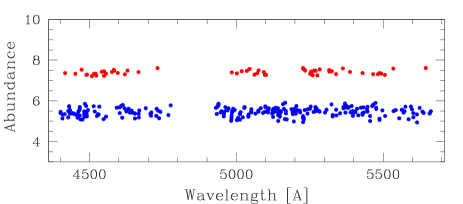
Since we have renormalised the disentangled spectra of the components with the light dilution factors determined from these spectra themselves, the wavelength dependence of the Fe abundance could be an important check of the correctness of the procedure. Fe ii and Fe i lines are well distributed in the optical spectra of Algol A and Algol C, respectively. This test is more sensitive for Algol C as the multiplication factor needed to normalise its spectrum to unit continuum is much higher than in the case of Algol A, 16.5 versus 1.1. As is illustrated in Fig. 5 no wavelength dependence of iron abundance is present for either of the components. This provides encouraging support for the reliability of our estimates for the luminosity contribution of the components to the total light of the system. The for Algol A is also in agreement with that generally found for late B-type stars (Fossati et al. 2009), which is usually considerably less than 1 km s-1.
5.3 The elemental composition and metallicity
| El. | [X/H] | |||
|---|---|---|---|---|
| C | 8.640.02 | 3 | 0.210.05 | |
| N | 7.920.04 | 4 | 0.090.06 | |
| O | 8.930.02 | 11 | 0.240.05 | |
| Mg | 7.490.03 | 7 | -0.100.05 | |
| Si | 7.460.04 | 14 | -0.050.05 | |
| P | 5.380.05 | 3 | -0.030.05 | |
| S | 7.020.02 | 21 | -0.100.06 | |
| Ca | 6.370.02 | 3 | 0.050.04 | |
| Ti | 4.910.03 | 11 | -0.020.09 | |
| Cr | 5.620.04 | 9 | 0.000.07 | |
| Mn | 5.480.05 | 5 | 0.060.06 | |
| Fe | 7.390.02 | 70 | -0.080.05 | |
| Ni | 6.180.02 | 17 | -0.020.05 |
| El. | [X/H] | |||
|---|---|---|---|---|
| C | 8.530.04 | 21 | 0.100.06 | |
| O | 8.720.06 | 6 | 0.030.08 | |
| Na | 6.310.08 | 7 | 0.100.09 | |
| Mg | 7.500.09 | 7 | -0.090.10 | |
| Si | 7.580.06 | 23 | 0.070.07 | |
| S | 7.160.04 | 10 | 0.040.05 | |
| Ca | 6.370.09 | 21 | 0.020.09 | |
| Sc | 3.030.07 | 12 | -0.130.08 | |
| Ti | 5.010.07 | 106 | 0.080.08 | |
| V | 4.100.10 | 17 | 0.210.13 | |
| Cr | 5.690.07 | 97 | 0.070.08 | |
| Mn | 5.330.08 | 23 | -0.090.09 | |
| Fe | 7.450.08 | 296 | -0.020.09 | |
| Co | 5.030.07 | 21 | 0.100.09 | |
| Ni | 6.250.07 | 161 | 0.050.08 | |
| Cu | 4.190.13 | 3 | 0.010.14 | |
| Y | 2.320.06 | 14 | 0.110.08 | |
| Zr | 2.590.06 | 11 | 0.090.07 | |
| Ba | 2.380.34 | 3 | 0.290.18 | |
| La | 1.350.07 | 6 | 0.230.08 | |
| Ce | 1.690.06 | 16 | 0.110.07 | |
| Nd | 1.570.08 | 8 | 0.150.09 |
 |
 |
The number of spectral lines available for the determination of the photospheric chemical composition of Algol A are rather limited. This does have the advantage that line blending and smearing do not prevent detailed analysis despite the relatively high of 50 km s-1. Beside the strong hydrogen (not disentangled) and helium lines, the most prominent lines are of Fe ii. For the of Algol A, spectral lines of C, N and O are rather weak: the EWs of C lines are all 4.5 mÅ except for the C ii 4267 Å line, 3 mÅ for N, and 15 mÅ for O. Therefore, abundance estimates for these elements should be considered with caution, except for C ii 4267 Å whose EW of 44.8 mÅ gives a carbon abundance of . This is dex less than solar (Asplund et al. 2009). A deficiency of carbon is also indicated from the comparison of the EW for the C ii 4267 Å line to EWs of standards from Tomkin et al. (1993) and İbanoǧlu et al. (2012).
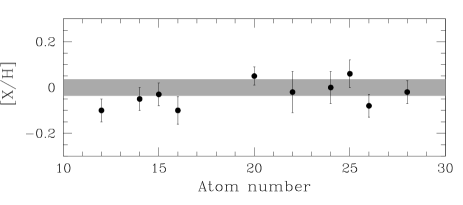
The mean photospheric metal abundance of Algol A has been calculated for all elements listed in Table 3 except CNO. The abundances of these elements were not used because of the possibility of changes caused by mass transfer, and the small EWs of the lines on which they are based. The remaining ten elements give an average abundance of . This is less than 1 away from the value derived from the most numerous lines. We calculated the bulk metallicity using the approximate equation, , finding it to be solar to within its uncertainty: (using the present day solar metallicity from Asplund et al. 2009). The measured elemental abundances in the photosphere of Algol A are displayed in Fig. 6 relative to standard solar values (Asplund et al. 2009).
The rich and relatively unbroadened ( km s-1) spectrum of Algol C made it possible to determine the photospheric abundances for 20 elements. Seven appear in two ionisation stages (neutral and singly-ionised). In the spectral range studied (4500–5700 Å) the most numerous lines are of Fe i, Ni i, Cr i and Ti ii. The measured abundances are listed in Table 4, along with the number of spectral lines used, and abundances relative to standard solar (Asplund et al. 2009). The slightly larger uncertainties compared to Algol A, despite having more lines available, are due to the smaller S/N of the renormalised disentangled spectrum after multiplication by 16 to put the continuum level to unity. In Fig. 7 we compare the photospheric composition of Algol C with the abundance pattern derived in Gebran et al. (2010) for a sample of ‘normal’ A-type stars (upper panel) and Am stars (lower panel). The abundances in Algol C do not show the principal characteristics of the Am phenomenon, i.e. strong Sc underabundance, often a Ca underabundance, and a moderate to strong overabundance of iron-group elements. The mean metallicity for Algol C is consistent with solar, at . The corresponding bulk metallicity is .
The photospheric elemental compositions of Algol A and Algol C are the same to within the 1 uncertainties, with a formal difference of . Both correspond to the standard solar composition (Asplund et al. 2009).
| Quantity | Notation | Unit | Algol A | Algol B | Algol C |
|---|---|---|---|---|---|
| Mass | |||||
| Radius | |||||
| Surface gravity | [cgs] | ||||
| Effective temperature | K | ||||
| Projected rotational velocity | km s-1 | ||||
| Synchronous velocity | km s-1 | ||||
| Microturbulence velocity | km s-1 | ||||
| Mean metal abundance | [M/H] | ||||
| Bulk metallicity |
6 Discussion
6.1 Fundamental properties of the components of Algol
With the velocity semiamplitudes determined for all the components of the Algol system, we are able to derive their dynamical masses. The orbital inclinations are taken from Richards et al. (1988) for the inner orbit, , and from Baron et al. (2012) for the outer orbit, . In the latter study was also derived, and was in agreement with Richards et al. (1988) but with lower accuracy. These inclinations are well constrained from several different studies and techniques. We also used the orbital periods from Baron et al. (2012): d and d. We find the masses , and . From the outer orbit we get the sum of the masses for Algol A and Algol B, , which is in accordance with the sum of the individual masses of Algol A and Algol B from the inner orbit, . Table 5 contains the physical properties of all three stars in the Algol system derived in the current work.
The component masses we find are about 8% smaller than the most commonly quoted values (Richards et al. 1988). This corroborates the findings of Baron et al. (2012), although these authors found masses about 15% small than those from Richards et al. (1988). Besides improving the mass values we were able to improve the measurement precision to 1.8% for Algol A and 1.2% for Algol B. That for Algol C is less improved, at 5%.
Published determinations of the radii of the stars suffer from degeneracy due to the third light and partial eclipses (see Sect. 5.1). Richards et al. (1988) found , and (no error given). Baron et al. (2012) achieved better than 0.5 mas spatial resolution in the -band with the CHARA interferometer, and unambiguously resolved the three stars. They found angular diameters of mas, mas and mas. With the parallax of Algol determined by Zavala et al. (2010), mas, they found linear radii of , and . The interferometric measurements agree with our results to within their large uncertainties.
The dimensions of the Roche-lobe filling component B are constrained by the mass ratio. This gives another way of determining its linear radius and synchronous rotational velocity. With our mass ratio for the semidetached pair, we have a relative radius of Algol B of (radius at the sides of the secondary star perpendicular to the line connecting the centres of the two stars). The semi-major axis of the inner orbit is . The linear radius is . This is consistent with the Baron et al. (2012) value. The synchronous rotational velocity for this is km s-1. We measured km s-1 from the spectral line broadening, which also supports our estimate of the radius of Algol B.
If we use the condition of synchronous rotation for Algol A, which does not have to be fulfilled, then for the measured km s-1 we get . If Algol A has been spun up by mass transfer (cf. Packet 1981; Dechamps et al. 2013) then this would be an upper limit for its radius. An improvement in direct interferometric measurements of its angular diameter, and/or revising the light curve analysis with new constraints from the spectroscopy presented in this work, might allow the radius of this component to be measured to high precision.
6.2 Chemical composition and evolution of the components
Predictions of carbon depletion in the atmospheres of mass-transferring systems prompted several observational studies. Carbon underabundances relative to solar were found by Cugier & Hardorp (1988) in an analysis of far-UV spectra secured from the IUE satellite. The carbon abundance they reported for Algol A, relative to the modern standard solar value, is [C/H] dex. Tomkin et al. (1993) studied a sample of Algol-type binaries, including Algol itself, and confirmed carbon deficiencies in the whole sample. For Algol A they found [C/H] dex using high-resolution observations of the C ii 4267 Å line. The reported value is relative to the average abundance, , they determined for the standard stars. Our result reported in Sect. 5.3, [C/H], confirms a small carbon depletion for Algol A, both in terms of the abundance determined from the strongest carbon line in its spectrum (C ii 4267 Å) and the deviation of its EW from a calibration derived from standard late-B type stars. Nitrogen lines show a slight overabundance with , but with the caution that the N ii lines used are very weak (EW 1.0–2.7 mÅ). Referring to the standard solar nitrogen abundance (Asplund et al. 2009), the abundance deviation for Algol A is [N/H].
The ratio between C and N abundances is a sensitive indicator of CNO nucleosynthesis and the efficiency of mass-transfer and mixing processes in stellar interiors. For Algol A we get (C/N) which, compared to the solar value, (C/N), indicates that a change in the C/N ratio in Algol A has been detected. CNO-processed layers from Algol B, formerly the more massive of the two inner components, are evidently now exposed on the surface of Algol A, the mass-gaining and currently more massive star. In our previous study on the hot Algol-type binary system u Her (Kolbas et al. 2014) we determined C/N 0.89 for the mass-gaining component. u Her contains components with masses of 7.8 and 2.8, substantially larger than the masses of the inner pair in Algol. As predicted by detailed chemical evolution models, Kolbas et al. (2014) found a stronger carbon depletion in the mass-losing component than in the mass-gaining companion. The progenitor mass of what is now the less massive component in u Her was estimated from evolutionary model calculations to be , whilst an estimate for the initial mass of Algol B is (Sarna 1993).
Whilst we succeeded in separating and reconstructing the spectrum of Algol B, detailed analysis is premature. The disentangled spectrum still suffers from a low S/N, and the spectral lines have high rotational broadening. However, this object dominates the X-ray spectrum of the system. Drake (2003) used Chandra Low Energy Transmission Spectrograph observations to determine the abundances of C and N in the corona of Algol B. The analysis was performed relative to the ‘standard’ star HR 1099. These two stars have shown many similarities in their X-ray spectra, except for the strengths of C and N lines. For N an enhancement by a factor of three compared to the standard star is found, whilst no C lines are detected in the Algol B spectrum, indicating a C depletion relative to ‘standard’ by a factor of ten or more. Moreover, Drake (2003) found a standard (solar) Fe abundance for Algol B, in fine agreement with our findings for Algol A and Algol B.
7 Conclusion
The first systematic échelle spectroscopic survey of Algol, a hierarchical triple system, has been conducted from 2006 to 2010 and covers the entire optical spectral range. The technique of spectral disentangling makes it possible, for the first time, to reveal the individual spectra of all three components in Algol. In our spd analysis the orbital elements for both orbits were optimised, leading to improved measurements of the masses of all three component stars. The uncertainties for the masses of the inner (eclipsing) system are now below 2%.
A detailed spectroscopic analysis of the disentangled spectra of the individual components was undertaken, and yielded an accurate determination of the effective temperatures and projected rotational velocities for all three stars, and the photospheric elemental abundances and bulk metallicity for Algol A and Algol C. Equally importantly, tight constraints on the fractional light cotribution of all three components have been derived. The spectroscopic light ratio for the inner partially-eclipsing binary could be used to lift the degeneracy in the determination of the radii from light curves of the system. This would make the system an excellent test case for theoretical work on modelling the evolution of mass-transferring binaries, resulting in an improved comprehension of Algol systems.
Acknowledgments
We thank the anonymous referee for the constructive comments that have helped to improve the paper. KP acknowledges funding from the Croatian Ministery of Science and Education through research grant (2007-2013), which also enabled a PhD scholarship to VK, and a Zagreb University Research Grant. JS acknowledges financial support from STFC in the form of an Advanced Fellowship. AT is Postdoctoral Fellow of the Fund for Scientific Research (FWO), Flanders, Belgium. Based on observations made with the Nordic Optical Telescope, operated by the Nordic Optical Telescope Scientific Association at the Observatorio del Roque de los Muchachos, La Palma, Spain, of the Instituto de Astrofisica de Canarias. Bohyunsan Optical Astronomy Observatory (BOAO) is an observing facility of the Korea Astronomy and Space Science Institute (KASI), Daejeon, Republic of Korea.
References
- [] Al-Naimiy, H. M. K., Mutter, A. A. A., Flaith, H. A., 1985, Ap&SS, 108, 227
- [] Asplund, M., Grevesse, N., Sauval, A. J., Scott, P., 2009, ARA&A, 47, 481
- [] Auer, L. H., Mihalas, D., 1970, ApJ, 160, 1161
- [] Auer, L. H., Mihalas, D., 1973, ApJS, 24, 193
- [] Barker, P. K., 1984, AJ, 89, 899
- [] Bagnuolo, W. G. Jr., Gies, D. R., 1991, ApJ, 376, 266
- [] Baron, F., Monnier, J. D., Pedretti, E., et al., 2012, 752, 20
- [] Batten, A. H., 1989, SSRv, 50, 1
- [] Borkovits, T., Derekas, A., Fuller, J., et al., 2014, MNRAS, 443, 3068
- [] Charbonneau P., 1995, ApJS, 101, 309
- [] Chen, K. Y., Reuning, E. G., 1966, AJ, 71, 283
- [] Crawford, J. A., 1955, ApJ, 121, 71
- [] Csizmadia, Sz., Borkovits, T., Paragi, Zs., et al., 2009, ApJ, 705, 436
- [] Cugier, H., 1989, A&A, 214, 168
- [] Cugier, H., Hardorp, J., 1988, A&A, 202, 101
- [] De Greve, J.-P., 1993, A&AS, 97, 527
- [] De Greve, J.-P., Cugier, H., 1989, A&A, 211, 356
- [] Demircan, O., 1977, Ap&SS, 47, 459
- [] Deschamps, R., Siess, L., Davis, P. J., Jorissen, A., 2013, A&A, 557, A40
- [] Drake, J. J., 2003, ApJ, 594, 496
- [] Eaton, J. A., 1975, PASP, 87, 745
- [] Erspamer, D., North, P., 2008, A&A, 383, 227
- [] Fletcher, E. S., 1964, AJ, 69, 357
- [] Fossati, L., Ryabchikova, T., Bagnulo, S., et al., 2009, A&A, 503, 945
- [] Frémat, Y., Lampens, P., Hensberge, H., 2005, MNRAS, 356, 545
- [] Frieboes-Conde, H., Herczeg, T., Høg, E., 1970, A&A, 4, 78
- [] Garcia, E. V., Stassun, K. G., Pavlovski, K., Hensberge, H., Gómez Maqueo Chew, Y., Claret, A., 2014, AJ, 39
- [] Gebran, M., Vick, M., Monier, R., Fossati, L., 2010, A&A, 523, A71
- [] Glazunova, L. V., Mkrtichian, D. E., Rostopchin, S. I., 2011, MNRAS, 415, 2238
- [] Glushneva, I. N., Esipov, V. F., 1967, Soviet Astronomy, 11, 828
- [] González, J. F., Hubrig, S., Nesvacil, N., North, P., 2006, A&A, 449, 327
- [] Goodricke, J., 1783, Philosophical Transactions of the Royal Society, 73, 474
- [] Guinan, E. F., McCook, G. P., Bachmann, P. J., Bistline, W. G., 1976, AJ, 81, 57
- [] Hadrava, P., 1995, A&AS, 114, 393
- [] Hensberge, H., Pavlovski, K., 2007, IAU Symposium, 240, 136
- [] Hensberge, H., Ilijić, S., Torres, K. B. V., 2008, A&A, 482, 1031
- [] Hensberge, H., Pavlovski, K., Verschueren, W., 2000, A&A, 358, 553
- [] Hill, G., Barnes, J. V., Hutchings, J. B., Pearce, J. A., 1971, ApJ, 168, 443
- [] Holmgren, D. E., Hadrava, P., Harmanec, P., et al., 1999, A&A, 345, 855
- [] Hynes, R. I., Maxted, P. F. L., 1998, A&A, 331, 167
- [] İbanoǧlu, C., Dervişoğlu, A., Çakırlı, Ö., Sipahi, E., Yüce, K., 2012, MNRAS, 419, 1472
- [] Ilijić, S., Hensberge, H., Pavlovski, K., 2001, Lecture Notes in Physics, 573, 269
- [] Ilijić, S., Hensberge, H., Pavlovski, K., Freyhammer, L. S., 2004, ASP Conf. Ser., 318, 111
- [] Ivezić, Ž., Connolly, A. J., VanderPlas, J. T., Gray, A., 2014, Statistics, Data Mining, and Machine Learning in Astronomy: A Practical Python Guide for the Analysis of Survey Data, Princeton University Press
- [] Jetsu, L., Porceddu, S., Lyytinen, J., et al., 2013, ApJ, 773, 1
- [] Kemp, J. C., Barbour, M. S., McBirney, R. E., Rudy, R. J., 1981, ApJ, 243, 557
- [] Kemp, J. C., Henson, G. D., Barbour, M. S., Kraus, D. J., Collins, G. W., II, 1983, ApJ, 273, L85
- [] Kim, H.-I., 1989, ApJ, 342, 1061
- [] Kim, K.-M. Han, I., Valyavin, G. G., et al., 2007, PASP, 119, 1052
- [] Kolbas, V., Dervişoğlu, A., Pavlovski, K., Southworth, J., 2014, MNRAS, 444, 3118
- [] Kolbas, V., Pavlovski, K., Southworth, J., Lee, C.-U., Lee, J. W., Kim, S.-L., Kim, H.-I., 2012, IAU Symp., 282, 303
- [] Kreiner, J. M., 2004, Acta Astronomica, 54, 207
- [] Kurucz, R. L., 1979, ApJS, 40, 1
- [] Labeyrie, A., Bonneau, D., Stachnik, R. V., Gezari, D. Y., 1974, ApJ, 194, L147
- [] Lee, C.-U., Kim, S.-L., Lee, J. W., et al., 2008, MNRAS, 389, 1630
- [] Lehmann, H., Southworth, J., Tkachenko, A., Pavlovski, K., 2013, A&A, 557, A79
- [] Lestrade, J. F., Phillips, R. B., Hodges, M. W., Preston, R. A., 1993, ApJ, 410, 808
- [] Maxted, P. F. M. L., Hilditch, R. W., 1996, A&A, 311, 567
- [] Mayer, P., Harmanec, P., Pavlovski, K., 2013, A&A, 550, A2
- [] McLaughlin, D. B., 1924, ApJ, 60, 22
- [] Narusawa, S., 2013, PASJ, 65, 105
- [] Narusawa, S., Ozaki, S., Kambe, E., Sadakane, K., 2006, PASJ, 58, 617
- [] Packet, W., 1981, A&A, 102, 17
- [] Paczyński, B., 1971, ARA&A, 9, 183
- [] Parthasarathy, M., Lambert, D. L., Tomkin, J., 1979, MNRAS, 186, 391
- [] Parthasarathy, M., Lambert, D. L., Tomkin, J., 1983, MNRAS, 203, 1063
- [] Pavlovski, K., Kolbas, V., Southworth, J., 2010, ASP Conf. Ser., 435, 247
- [] Pavlovski, K., Southworth, J., Kolbas, V., 2011, ApJ, 734, L29
- [] Pavlovski, K., Southworth, J., Kolbas, V., Smalley, B., 2014, MNRAS, 438, 590
- [] Pavlovski, K., Tamajo, E., Koubský, P., Southworth, J., Yang, S., Kolbas, V., 2009, MNRAS, 400, 791
- [] Peterson, W. M., Mutel, R. L., Güdel, M., Goss, W. M., 2010, Nature, 463, 207
- [] Peterson, W. M., Mutel, R. L., Lestrade, J. F., Güdel, M., Goss, W. M., 2011, ApJ, 737, 104
- [] Retter, A., Richards, M. T., Wu, K., 2005, ApJ, 621, 417
- [] Richards, M. T., Agafonov, M. I., Sharova, O. I., 2012, ApJ, 760, 8
- [] Richards, M. T., Mochnacki, S. W., Bolton, C. T., 1988, AJ, 96, 326
- [] Rossiter, R. A., 1924, ApJ, 60, 15
- [] Rudy, R. J., Kemp, J. C., 1978, ApJ, 221, 200
- [] Sarna, M. J., 1992, MNRAS, 259, 17
- [] Sarna, M. J., 1993, MNRAS, 262, 534
- [] Simon, K. P., Sturm, E., 1994, A&A, 281, 286
- [] Smalley, B., Smith K. C., Dworetsky M. M., 2001, uclsyn Userguide, available at: http://www.astro.keele.ac.uk/bs/publs/uclsyn.pdf
- [] Smith, K. C., 1992, PhD Thesis, University College of London
- [] Söderhjelm S., 1980, A&A, 89, 100
- [] Southworth, J., Bruntt, H., Buzasi, D. L., 2007, A&A, 467, 1215
- [] Southworth, J., Clausen, J. V., 2007, A&A, 461, 1077
- [] Škoda, P., Šurlan, B., Tomić, S., 2008, Proc. SPIE, 7014, 70145X1
- [] Stebbins, J., Gordon, K. C., 1975, Ap&SS, 33, 481
- [] Stern, R. A., Lemen, J. R., Schmitt, J. H. M. M., Pye, J. P., 1995, ApJ, 444, L45
- [] Stern, R. A., Uchida, Y., Tsuneta, S., Nagase, F., 1992, ApJ, 400, 321
- [] Struve, O., Sahade J., 1957, PASP, 69, 265
- [] Tamajo, E., Munari, U., Siviero, A., Tomasella, L., Dallporta, S., 2012, A&A, 539, A139
- [] Tamajo, E., Pavlovski, K., Southworth, J., 2011, A&A, 526, A76
- [] Telting, J. H., Avila, G., Buchhave, L., et al., 2014, AN, 335, 41
- [] Tkachenko, A., Degroote, P., Aerts, C., et al., 2014, MNRAS, 438, 3093
- [] Tkachenko, A., Lehmann, H., Mkrtichian, D., 2009, A&A, 504, 991
- [] Tkachenko, A., Lehmann, H., Mkrtichian, D., 2010, AJ, 139, 1327
- [] Tomkin, J., 1989, SSRv, 50, 245
- [] Tomkin, J., Lambert, D. L., 1978, ApJ, 222, L119
- [] Tomkin, J., Lambert, D. L., Lemke, M., 1993, MNRAS, 265, 581
- [] Torres, G., Lacy, C. H. S., Pavlovski, K., et al., 2014, ApJ, 797, 31
- [] Wade, C. M., Hjellming, R. M., 1972, Nature, 235, 270
- [] Wecht, K., 2006, PhD Thesis, Lehigh University (arXiv:astro-ph/0611855)
- [] White, N. E., Culhane, J. L., Parmar, A. N., Kellett, B. J., Kahn, S., 1986, ApJ, 301, 262
- [] Wilson, R. E., Liou, J.-C., 1993, ApJ, 413, 670
- [] Wilson, R. E., De Luccia, M. R., Johnston, K., Mango, S. A., 1972, ApJ, 177, 191
- [] Yang, X.-J., Lu, F.-J., Aschenbach, B., Chen, L., 2011, Res. Astron. Astrophys., 11, 457
- [] Zavala, R. T., Hummel, C. A., Boboltz, D. A., et al., 2010, ApJ, 715, L44
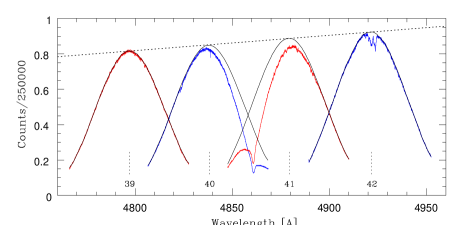
Appendix A Blaze function correction
Extracted and wavelength-calibrated échelle spectra (Sect. 2) are split into orders, each of which has a response function determined by the blaze shape. In each order, the intensity of signal smoothly rises from the edges to the centre of frame. It is due to the optical setup and characteristics of échelle spectrograph, and has sine form (see Barker 1984). Blaze function removal from extracted spectral orders is a critical step in the reduction of échelle spectra. Any systematic errors in the blaze function correction produces periodic ripples in the shape of the continuum, which in turn affects the depth and thus equivalent widths of spectral lines. A major obstacle to removal of the blaze function is the presence of broad spectral lines, in particular Balmer lines in late-B and early-A stars. These can be wider than a single spectral order, so determining the blaze function using points on the spectral continuum is impossible.
The most widespread method to correct for the blaze function is to divide the spectrum with a blaze function obtained from flat-fields (c.f. Erspamer & North 2002; Škoda et al. 2008, and references therein). However, this often gives a wavy shape in the merged spectral orders, which then still have to be locally normalised. For unknown reasons blaze functions of stellar and flat-field spectra are not identical, and undesired ripples appear and degrade the quality of merged spectra.
One of the most important prerequisites for spectral disentangling is the quality of the normalised merged échelle spectra. To avoid systematic errors, we remove blaze functions in more thorough and interactive way. First, the spectral orders suitable for fitting of the blaze function are selected (in Fig. A1 these are orders #39, and 42). These are orders without broad spectral lines and with a substantial amount of continuum. High-degree polynomial functions are fitted by least-squares through selected continuum points. Wavelengths of maximum intensity of the blaze functions are also calculated, and used for the interpolation of the positions of blaze function head in the remaining orders. Blaze functions are now interpolated to these orders, as illustrated the upper panel of Fig. A1. The results of the correction using interpolated blaze functions are shown in the middle panel of Fig. A1. The bottom panel of Fig. A1 illustrates the quality of interpolation and merging between two sequential orders containing a Balmer line. It should be emphasized that overlapping parts fall on the edges of spectral orders, and suffer a lower S/N than central parts. Despite this, merging is good to much better than 1%.