First Detection of HCO+Absorption in the Magellanic System
Abstract
We present the first detection of HCO+ absorption in the Magellanic System. Using the Australia Telescope Compact Array (ATCA), we observed 9 extragalactic radio continuum sources behind the Magellanic System and detected HCO+ absorption towards one source located behind the leading edge of the Magellanic Bridge. The detection is located at LSR velocity of , with a full width at half maximum of and optical depth of . Although there is abundant neutral hydrogen (H i) surrounding the sightline in position-velocity space, at the exact location of the absorber the H i column density is low, , and there is little evidence for dust or CO emission from Planck observations. While the origin and survival of molecules in such a diffuse environment remains unclear, dynamical events such as H i flows and cloud collisions in this interacting system likely play an important role.
Subject headings:
Magellanic Clouds – ISM: molecules – ISM: structure1. Introduction
| Source | RA (J2000) | Dec (J2000) | Time | Typeb | ||||
|---|---|---|---|---|---|---|---|---|
| (hh:mm:ss) | (dd:mm:ss) | (∘) | (∘) | (Jy) | (hr) | (per )a | ||
| J0056-572 | 00:58:46.6 | -56:59:11.5 | 300.926 | -60.113 | 0.9 | 2.7 | 0.059 | |
| J0102-7546 | 01:02:18.8 | -75:46:53.0 | 302.043 | -41.328 | 0.6 | 1.7 | 0.090 | AT20G |
| J0208-512 | 02:10:46.2 | -51:01:01.9 | 276.102 | -61.778 | 2.1 | 2.3 | 0.051 | |
| J0311-7651 | 03:11:55.3 | -76:51:51.0 | 293.440 | -37.553 | 0.8 | 2.3 | 0.054 | AT20G |
| J0440-6952 | 04:40:47.8 | -69:52:18.1 | 281.836 | -36.399 | 0.6 | 4.0 | 0.046 | |
| J0454-810 | 04:50:05.4 | -81:01:02.2 | 293.851 | -31.371 | 1.5 | 3.3 | 0.026 | |
| J0506-6109 | 05:06:44.0 | -61:09:41.0 | 270.550 | -36.072 | 0.4 | 1.7 | 0.090 | AT20G |
| J0530-727 | 05:29:30.0 | -72:45:28.5 | 283.850 | -31.857 | 0.8 | 3.3 | 0.019 | |
| J0637-752 | 06:35:46.5 | -75:16:16.8 | 286.368 | -27.158 | 1.8 | 2.8 | 0.010 |
a: rms noise in per channel.
b: ATCA calibrators unless indicated as AT20G sources from Murphy et al. (2010)
To understand galaxy evolution, which is driven by the life cycles of stars, it is necessary to investigate the origin and properties of the clouds which host star formation in a wide range of interstellar environments. The Magellanic System, including the Small Magellanic Cloud (SMC), Large Magellanic Cloud (LMC), Magellanic Bridge, Leading Arm (LA) and Magellanic Stream offer a nearby example (–; Keller & Wood 2006) of an environment with interstellar conditions that sharply contrast what we find in the Milky Way (MW). In particular, the low metallicity of the Magellanic System (e.g., and Solar metallicity respectively in the SMC and LMC; Rolleston et al. 2002) imply that heating and cooling mechanisms, dust-to-gas ratios, and chemical abundances may be representative of less-evolved systems at high redshift.
The Magellanic System is a complex structure rich in neutral hydrogen (H i; e.g., Putman et al. 2003, Stanimirović et al. 2008, Nidever et al. 2010). The LA, stretching out in front of the LMC and SMC, and the extensive, 150∘-long Stream (Nidever et al. 2010) trailing behind them are understood as features of tidal (e.g. Murai & Fujimoto 1980, Yozin & Bekki 2014) and/or ram-pressure stripping (e.g., Moore & Davis 1994, Mastropietro et al. 2005) interactions between the SMC, LMC and MW. Recent UV absorption measurements support the scenario that the Stream originated from the SMC, and observed metallicity enhancements indicate some material has been stripped from LMC (Fox et al. 2013, 2014, Richter et al. 2013). There is a wealth of evidence for star formation within Magellanic structures outside the LMC and SMC, including diffuse H emission (e.g., Meaburn 1986), and massive, young stars in the LA (e.g., Casetti-Dinescu et al. 2014) and Bridge (e.g., Demers & Battinelli 1998), while the Stream remains starless. However, the presence and stability of cold atomic and molecular material in these extreme dynamical environments is still uncertain.
Unfortunately, molecular hydrogen (H2), the most abundant molecule in the interstellar medium (ISM), cannot be observed directly in cold, dense environments. Many studies trace H2 with carbon monoxide (CO), which is easily excited at low temperatures and has strong dipole-allowed rotational transitions. However, both theoretical and observational studies show that CO is less effective at self-shielding especially at low densities (e.g., van Dishoeck & Black 1988, Sheffer et al. 2008). Therefore, the important transition regions where H2 begins to form out of the atomic medium, are poorly traced by CO (e.g., Leroy et al. 2009). This “CO-dark” H2 is especially prominent in low-metallicity environments where the abundance of dust grains, which provides the primary shielding mechanism for CO, is low (e.g., Wolfire et al. 2010). Accordingly, searches for Magellanic CO emission outside of the LMC and SMC have proven difficult. Following a detection of cold H i in absorption (Kobulnicky & Dickey 1999), no CO was detected in the Bridge towards source J0311-7651 (Smoker et al. 2000). Several CO clouds were detected in the Bridge just outside of the SMC (Muller et al. 2003, Mizuno et al. 2006), but these studies targeted only regions of high far-infrared excess, and were very expensive in observation time.
In particular, absorption by HCO+ appears to trace H2 abundance in the MW (e.g., Liszt et al. 2010), and is therefore a promising tool for measuring molecular gas content and kinematics even in regions where H2 has recently formed (Lucas & Liszt 1996). Although the thermal pressure is low in such regions, and therefore rotational transitions of molecules are not well excited via collisions with H2 (Lucas & Liszt 1996), absorption lines depend on column density and are therefore strong even in low excitation. There are no measurements of HCO+ absorption in the Magellanic System, although there are two detections of H2 in the Stream (Sembach et al. 2001, Richter et al. 2001), and one detection of H2 in the Bridge (Lehner et al. 2002) from FUSE far ultra-violet (UV) absorption. In addition, two sensitive searches for HCO+ absorption in HVCs in the MW, including several Stream directions, returned only one tentative detection (Akeson & Blitz 1999, Combes & Charmandaris 2000).
In this paper, we present the results of a search for HCO+ absorption towards 9 radio continuum sources behind the Magellanic System with the Australia Telescope Compact Array (ATCA). Of the 9 lines of sight observed, we have one detection of HCO+ absorption at the leading edge of the Magellanic Bridge, and 8 non-detections. In Section 2 we describe the observations and data reduction, in Section 3 we analyze the data and present column density estimates, and in Section 4 we discuss the results.
2. Observations
We selected our targets to be radio continuum sources located behind the Magellanic System which are bright at . Of the 9 targets, 6 are ATCA calibrator sources with continuum flux densities , and 3 are compact sources from the Australia Telescope 20 GHz Survey (AT20G) with (Murphy et al. 2010).
The observations were conducted between 28 May and 01 June 2014, with additional observing time between 05 and 06 July 2014 granted due to poor initial observing conditions. We observed the HCO+(1-0) transition with the receivers on the ATCA in the EW configuration, which corresponds to a synthesized beam. We used the CFB 64M-32k correlator mode to cover the velocity111All velocities quoted in this paper are in the kinematic or standard LSR frame. range from within a single zoom-band. Given that all sources are compact and bright, the target sources performed as their own phase calibrators. The ATCA calibrators 0537-441 and 1921-293 were observed once every 30 minutes for bandpass calibration, Uranus was observed for 30 minutes at the end of each session for flux calibration, and pointing was corrected on each target every 20 minutes.
All data were reduced using standard packages in MIRIAD (Sault et al. 1995). Following flagging and calibration, spectral line cubes were constructed using the task INVERT with uniform weighting and velocity resolution. Final, cleaned image cubes were produced following 1000 minor iterations in CLEAN, and all sources were unresolved. The cubes were Hanning-smoothed to resolution within MIRIAD. We then extracted the HCO+ spectrum from the central pixel of each cube,222The results are consistent with extracting the spectra directly from the UV data. and calculated the absorption spectrum, , by dividing the line by the source continuum.
Table 1 includes position and flux information for the 9 observed sources. These include: (1) source name, (2-3) RA and Dec (J2000), (4-5) Galactic latitude and longitude (∘), (6) measured continuum flux density at (Jy), (7) total on-source integration time (hr), (8) rms noise in HCO+ optical depth, per channel, and (9) source type.
3. Analysis
3.1. Spectral Line Fitting
To search for absorption signatures in the observed HCO+ spectra, we used the Bayesian analysis technique developed, implemented and described by Allison et al. (2012). Given a likelihood function and prior distribution, this procedure searches all parameter space using the MULTINEST Monte Carlo sampling algorithm (Feroz & Hobson 2008) and calculates the resulting posterior probability distribution and evidence statistic. For this study, we tested for the presence of a single Gaussian function in each un-smoothed HCO+ absorption spectrum given the following priors: (1) the line width is not less than the channel spacing () or greater than the bandwidth (); (2) the spectral noise is equal to the standard deviation in off-line channels; (3) the spectral channels are independent. We considered an absorption line to be “detected” if the Bayesian evidence statistic of the Gaussian model is greater than the evidence statistic for a model containing no spectral lines.
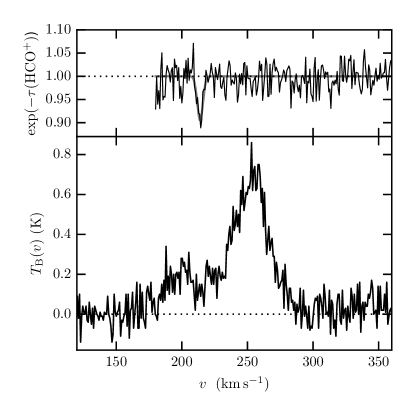
After analyzing all spectra, we detected one absorption line in the spectrum towards J0454-810. We display the J0454-810 spectrum with the Gaussian model in the top panel of Figure 1. The detection significance is described by , where is the natural logarithm of the Bayesian evidence statistic for the Gaussian model divided by evidence statistic for a model containing only noise. The line is located at has a full width at half maximum of and optical depth . The integrated optical depth of the line derived from the model is, , which indicates a detection significance, and is consistent with the quoted value.
| Source | (H i)Mag | (HCO+) | (H2)Mag |
|---|---|---|---|
| () | ()a | ()b | |
| J0056-572 | |||
| J0102-7546 | |||
| J0208-512 | |||
| J0311-7651 | |||
| J0440-6952 | |||
| J0454-810 | |||
| J0506-6109 | |||
| J0530-727 | |||
| J0637-752 |
a: Assuming line width.
b: Based on (HCO+) and (HCO+).
As a sanity check, we note that the detected HCO+ absorption line is present in the J0454-810 spectrum for: (1) each of the 4 individual days of observations, (2) both and velocity resolutions, (3) data reduced using different subsets of the available ATCA antennas, and (4) both linear polarizations. We are therefore confident that the feature is not spurious.
3.2. Column Densities
Assuming excitation in equilibrium with the cosmic microwave background (Lucas & Liszt 1996), we calculated the HCO+ column density, (HCO+), from the J=1-0 optical depth () for an HCO+ dipole moment of 3.92 Debye (Mount et al. 2012), so that,
| (1) |
where the line integral is expressed in .
For the J0454-810 detection, we integrated the Gaussian model to compute (HCO+) using Equation 1. For the non-detection sight lines, we computed a limit to (HCO+) using a upper limit to (with in Table 1) and assumed a line width of based on the J0454-810 detection.
From MW studies, there is a correlation between (HCO+) and (H2), given by (HCO+)=(HCO+)/(H2) (e.g. Liszt et al. 2010). Although the correlation may be different in the lower-metallicity Magellanic System, we applied this factor to (HCO+) to estimate the Magellanic H2 column density, (H2)Mag.
In addition, we extracted H i emission spectra from the stray radiation-corrected Galactic All Sky Survey (GASS; McClure-Griffiths et al. 2009, Kalberla et al. 2010) for each line of sight. From these data we computed (H i)Mag, assuming the H i is optically thin:
| (2) |
where and (K) is the H i brightness temperature integrated between radial velocities: . All column densities described above are included in Table 2.
3.3. Estimating dust, H2 and CO from Planck
Using available Planck maps (version 1.20) and H i emission from GASS, we can estimate limits to the Magellanic dust reddening, H2 column density and CO brightness along each line of sight.
To correct for the Galactic contribution, we computed the total Galactic H i column density, , by integrating the GASS profile in Equation 2 for all . We then converted this column density to an estimate of the reddening due to the MW, , using the results from Liszt (2014): , which holds for . To find the total reddening along the line of sight, , we used the Planck model of dust radiance, or total dust emission integrated over frequency, . The Planck collaboration showed that is a better tracer of the total column density than dust optical depth in diffuse, high-latitude regions, and exhibits the strong correlation: (Planck Collaboration et al. 2014). We used this correlation to compute , and then subtracted from to estimate the total Magellanic contribution, . For all lines of sight, we find .
We note that the above calculations require the assumption that the dust to gas ratio is constant across the sampled volume. Using results from FUSE observations of the SMC and LMC, we converted to another estimate of given (Welty et al. 2012). For all lines of sight, we find . Finally, we estimated the Magellanic CO brightness, , by assuming (from observations of the SMC): (e.g., Bolatto et al. 2013). For all lines of sight, we find .
4. Discussion
4.1. Comparisons with Previous Work
The HCO+ absorption detection towards J0454-810 is the first of its kind in the Magellanic System, and suggests the presence of molecular gas far outside of the SMC and LMC. Of the 8 non-detections, only 2 were more sensitive and 6 were up to three times less sensitive due to compromised weather conditions. Overall, our ATCA observations are more sensitive than previous searches for HCO+ absorption in diffuse, high-velocity clouds. These previous studies had typical limits to HCO+ optical depth of per channels and returned no detections (Akeson & Blitz 1999) and one tentative and non-confirmed detection (Combes & Charmandaris 2000) in clouds with (H i).
Our detected absorption line is wider () than individual HCO+ absorption lines detected in the MW (; Lucas & Liszt 1996), and the only previously reported high-velocity cloud detection (; Combes & Charmandaris 2000). Although our measured Magellanic column density, , is slightly smaller than the typical column densities observed in the MW (; Lucas & Liszt 1996), it is similar to those observed in diffuse regions. For example, for the only sightline with (H i), Liszt et al. (2010) measure .
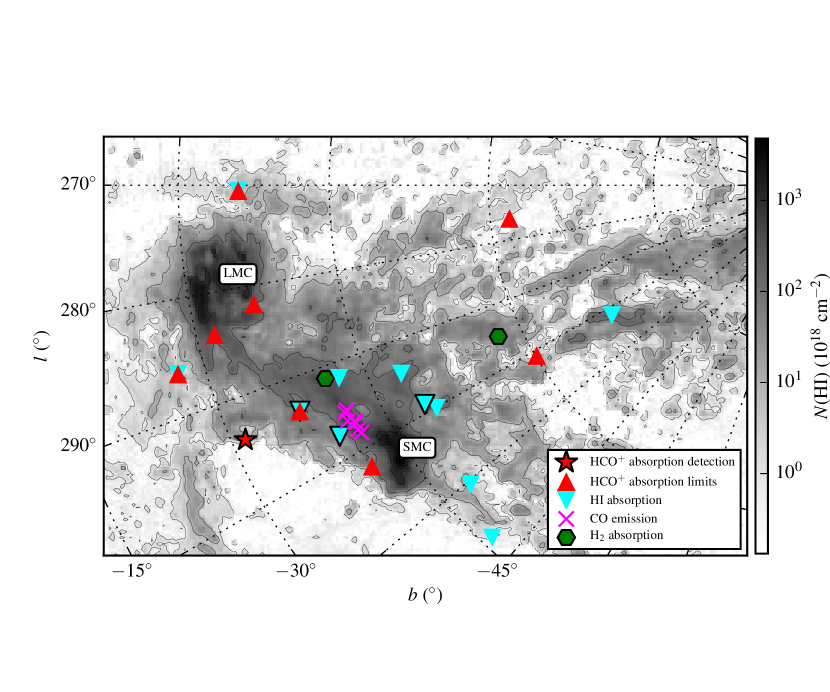
In Figure 2 we overlay the observed HCO+ absorption coordinates on an (H i) image of the Magellanic System from the Parkes radio telescope (Putman et al. 2003). The detection is located at the leading edge of the Magellanic Bridge. Nearby regions contain other evidence for cold atomic and molecular gas, including H i detected in absorption with temperatures (Kobulnicky & Dickey 1999, Matthews et al. 2009), and CO emission close to the SMC (Muller et al. 2003, Mizuno et al. 2006). However, the detected HCO+ absorption probes molecular gas farther away from the LMC and SMC (about 10 kpc from the SMC’s center) than any previous radio or mm-wave studies.
Our estimates of (H2)Mag in Table 2 () are orders of magnitude higher than both the Planck based estimates () and those from FUSE UV-absorption in the Stream and Bridge. Towards Fairall 9, located at the beginning of the Stream in a region of enhanced metallicity likely stripped from the LMC, Richter et al. (2013b) measured . Towards an early-type star in the Bridge, Lehner (2002) measured . The discrepancies between these values and our Table 2 estimates suggest that the that the MW-based conversion factor may not be applicable in the lower-metallicity Magellanic regime. Given that the factor is expected to be up to a factor of 100 higher in low-metallicity regimes (e.g., Bolatto et al. 2013), it is likely that will be similarly different in the Magellanic system. Additional measurements of HCO+ and H2 column densities are required to constrain this value further.
4.2. Origin of the Detected HCO+
The origin and survival of the detected HCO+ in the highly diffuse () region of the Bridge is puzzling. The material either formed within the Bridge, or it originated from a stripping interaction with the LMC or, more likely given its proximity, the SMC. The age of the Bridge is constrained to by the oldest detected stellar populations known to have formed in-situ (e.g., Harris 2007). Within the Bridge, low metallicities ( Solar; Lehner 2008) indicate reduced dust grain formation rates, and young stellar populations (e.g., Demers & Battinelli 1998) indicate potentially strong UV radiation fields ( MW value). These two properties, as discussed by Lehner 2002, imply that molecule formation and destruction equilibrium cannot be reached within the Bridge’s lifetime for reasonable hydrogen volume densities (e..g, ; Lehner 2002). Therefore, extremely high densities () are likely required in the Bridge for equilibrium molecule formation to occur. This was also discussed by Kobulnicky & Dickey (1999) in the context of cold atomic gas formation in the Bridge.
However, non-equilibrium molecule formation may be responsible. Simulations show that ram-pressure effects during the SMC-LMC interaction which created the Bridge (required to explain the Bridge’s observed in-situ star formation; e.g., Connors et al. 2006, Besla 2012) can produce high-density, star-formation-ready peaks within the diffuse medium (e.g., Mastropietro et al. 2009). Further simulations of ram pressure-stripping of the ISM from galaxies have shown that stars can form diffuse, gaseous tails when ablated gas cools and condenses in the turbulent wake of the stripping interaction (e.g., Tonnesen et al. 2012). In the bottom panel of Figure 1 we display the H i brightness temperature spectrum from GASS (McClure-Griffiths et al. 2009). There is an offset between the two peaks in H i and the location of HCO+ absorption, which may be indicative of a shock driven by dynamical interactions and support for molecule formation in the post-shock material.
In terms of molecule survival in this environment, dust is very important, as it provides shielding against the UV radiation field and acts as a catalyst for grain formation. Our Planck-based estimates indicate very little dust and CO along the lines of sight probed by this study. A lack of shielding by dust or sufficiently large (H i) means that the molecular material identified by the HCO+ detection must disperse quickly, and we may be observing the material in the process of being disrupted.
Alternatively, the detection presented here may not be tracing dense molecular gas. Comprehensive studies using the Plateau de Bure Interferometer (e.g., Lucas & Liszt 1996, Liszt et al. 2010) have shown that strong absorption by HCO+, 12CO, CN, HCN, HNC and C2H can be found in surprisingly diffuse MW regions () where fully-developed molecular chemistry is not expected to exist. Recent Herschel Space Observatory observations have detected similar molecular species to HCO+, including OH+, in extremely diffuse gas where the fraction of H2 is (Indriolo et al. 2015). These studies indicate that many diatomic and polyatomic molecules can form and reach significant abundances even when they are not well-shielded.
In support of this scenario, there is a growing supply of evidence for the existence of molecules and star formation in H i-diffuse, dust-poor structures. For example, low-(H i) intermediate-velocity clouds in the MW halo exhibit ubiquitous H2 absorption (Richter et al. 2003a,b). Widespread CO emission has been detected in the ram pressure-stripped tail of the Norma cluster galaxy ESO 137-001, away from the disk (Jáchym et al. 2014). In addition, young stellar associations in low-N(H i) regions () with high H i velocity dispersions () have been detected in stripped tails up to away from NGC 1533 (Werk et al. 2008).
Overall, additional observations of molecular gas tracers at high sensitivity and in a wide range of galactic environments are needed to understand the formation and evolution of molecular gas at these extremes. HCO+ absorption is a promising tracer of this material, and future observations with ALMA will be able to confirm the detection presented here, and extend the sample of available sources to probe the full extent of the Magellanic System and the outskirts of galaxies at higher redshifts.
5. Summary
Using the ATCA, we detected HCO+ absorption in the Magellanic System for the first time. We observed 9 background continuum sources, and detected one absorption line towards J0454-810, with an HCO+ column density of . The detection is located in a diffuse (H i column density of ) region at the leading edge of the Magellanic Bridge, where there is little current evidence for either dust or CO emission based on Planck and GASS H i observations. Despite the low , this molecular material may have formed as part of a dynamical interaction during the evolution of the Bridge. Ultimately, higher-sensitivity searches for HCO+ absorption and other molecular gas tracers across the Magellanic System are strongly needed to better understand the formation history and star formation potential of this complex, low-metallicity structure.
References
- Akeson & Blitz (1999) Akeson, R. L., & Blitz, L. 1999, ApJ, 523, 163
- Allison et al. (2012) Allison, J. R., Sadler, E. M., & Whiting, M. T. 2012, PASA, 29, 221
- Besla et al. (2012) Besla, G., Kallivayalil, N., Hernquist, L., et al. 2012, MNRAS, 421, 2109
- Bolatto et al. (2013) Bolatto, A. D., Wolfire, M., & Leroy, A. K. 2013, ARA&A, 51, 207
- Casetti-Dinescu et al. (2014) Casetti-Dinescu, D. I., Moni Bidin, C., Girard, T. M., et al. 2014, ApJ, 784, LL37
- Combes & Charmandaris (2000) Combes, F., & Charmandaris, V. 2000, A&A, 357, 75
- Connors et al. (2006) Connors, T. W., Kawata, D., & Gibson, B. K. 2006, MNRAS, 371, 108
- Demers & Battinelli (1998) Demers, S., & Battinelli, P. 1998, AJ, 115, 154
- Feroz & Hobson (2008) Feroz, F., & Hobson, M. P. 2008, MNRAS, 384, 449
- Fox et al. (2013) Fox, A. J., Richter, P., Wakker, B. P., et al. 2013, ApJ, 772, 110
- Fox et al. (2014) Fox, A. J., Wakker, B. P., Barger, K. A., et al. 2014, ApJ, 787, 147
- Harris (2007) Harris, J. 2007, ApJ, 658, 345
- Indriolo et al. (2015) Indriolo, N., Neufeld, D. A., Gerin, M., et al. 2015, ApJ, 800, 40
- Kalberla et al. (2010) Kalberla, P. M. W., McClure-Griffiths, N. M., Pisano, D. J., et al. 2010, A&A, 521, AA17
- Keller & Wood (2006) Keller, S. C., & Wood, P. R. 2006, ApJ, 642, 834
- Kobulnicky & Dickey (1999) Kobulnicky, H. A., & Dickey, J. M. 1999, AJ, 117, 908
- Lehner (2002) Lehner, N. 2002, ApJ, 578, 126
- Lehner et al. (2008) Lehner, N., Howk, J. C., Keenan, F. P., & Smoker, J. V. 2008, ApJ, 678, 219
- Leroy et al. (2009) Leroy, A. K., Bolatto, A., Bot, C., et al. 2009, ApJ, 702, 352
- Liszt et al. (2010) Liszt, H. S., Pety, J., & Lucas, R. 2010, A&A, 518, AA45
- Liszt (2014) Liszt, H. 2014a, ApJ, 780, 10
- Lucas & Liszt (1996) Lucas, R., & Liszt, H. 1996, A&A, 307, 237
- Matthews et al. (2009) Matthews, D., Staveley-Smith, L., Dyson, P., & Muller, E. 2009, ApJ, 691, L115
- Mastropietro et al. (2005) Mastropietro, C., Moore, B., Mayer, L., Wadsley, J., & Stadel, J. 2005, MNRAS, 363, 509
- Mastropietro et al. (2009) Mastropietro, C., Burkert, A., & Moore, B. 2009, MNRAS, 399, 2004
- McClure-Griffiths et al. (2009) McClure-Griffiths, N. M., Pisano, D. J., Calabretta, M. R., et al. 2009, ApJS, 181, 398
- Meaburn (1986) Meaburn, J. 1986, MNRAS, 223, 317
- Mizuno et al. (2006) Mizuno, N., Muller, E., Maeda, H., et al. 2006, ApJ, 643, L107
- Moore & Davis (1994) Moore, B., & Davis, M. 1994, MNRAS, 270, 209
- Mount et al. (2012) Mount, B. J., Redshaw, M., Myers, E. G. 2012, Phys. Rev. A, 85, 012519
- Muller et al. (2003) Muller, E., Staveley-Smith, L., & Zealey, W. J. 2003, MNRAS, 338, 609
- Murai & Fujimoto (1980) Murai, T., & Fujimoto, M. 1980, PASJ, 32, 581
- Murphy et al. (2010) Murphy, T., Sadler, E. M., Ekers, R. D., et al. 2010, MNRAS, 402, 2403
- Nidever et al. (2010) Nidever, D. L., Majewski, S. R., Butler Burton, W., & Nigra, L. 2010, ApJ, 723, 1618
- Planck Collaboration et al. (2014) Planck Collaboration, Abergel, A., Ade, P. A. R., et al. 2014, A&A, 571, AA11
- Putman et al. (2003) Putman, M. E., Staveley-Smith, L., Freeman, K. C., Gibson, B. K., & Barnes, D. G. 2003, ApJ, 586, 170
- Richter et al. (2001) Richter, P., Sembach, K. R., Wakker, B. P., & Savage, B. D. 2001, ApJ, 562, L181
- Richter et al. (2003a) Richter, P., Wakker, B. P., Savage, B. D., & Sembach, K. R. 2003, ApJ, 586, 230
- Richter et al. (2003b) Richter, P., Sembach, K. R., & Howk, J. C. 2003, A&A, 405, 1013
- Richter et al. (2013) Richter, P., Fox, A. J., Wakker, B. P., et al. 2013, ApJ, 772, 111
- Rolleston et al. (2002) Rolleston, W. R. J., Trundle, C., & Dufton, P. L. 2002, A&A, 396, 53
- Sault et al. (1995) Sault, R. J., Teuben, P. J., & Wright, M. C. H. 1995, Astronomical Data Analysis Software and Systems IV, 77, 433
- Sembach et al. (2001) Sembach, K. R., Howk, J. C., Savage, B. D., & Shull, J. M. 2001, AJ, 121, 992
- Sheffer et al. (2008) Sheffer, Y., Rogers, M., Federman, S. R., et al. 2008, ApJ, 687, 1075
- Smoker et al. (2000) Smoker, J. V., Keenan, F. P., Polatidis, A. G., et al. 2000, A&A, 363, 451
- Stanimirović et al. (2008) Stanimirović, S., Hoffman, S., Heiles, C., et al. 2008, ApJ, 680, 276
- Tonnesen & Bryan (2012) Tonnesen, S., & Bryan, G. L. 2012, MNRAS, 422, 1609
- van Dishoeck & Black (1988) van Dishoeck, E. F., & Black, J. H. 1988, ApJ, 334, 771
- Welty et al. (2012) Welty, D. E., Xue, R., & Wong, T. 2012, ApJ, 745, 173
- Werk et al. (2008) Werk, J. K., Putman, M. E., Meurer, G. R., et al. 2008, ApJ, 678, 888
- Wolfire et al. (2010) Wolfire, M. G., Hollenbach, D., & McKee, C. F. 2010, ApJ, 716, 1191
- Yozin & Bekki (2014) Yozin, C., & Bekki, K. 2014, MNRAS, 443, 522