Predicting catastrophic shifts
Abstract
Catastrophic transitions, where a system shifts abruptly between alternate steady states, are a generic feature of many nonlinear systems. Recently these regime shift were suggested as the mechanism underlies many ecological catastrophes, such as desertification and coral reef collapses, which are considered as a prominent threat to sustainability and to the well-being of millions. Still, the methods proposed so far for the prediction of an imminent transition are quite ineffective, and some empirical and theoretical studies suggest that actual transitions may occur smoothly, without an abrupt shift. Here we present a new diagnostic tool, based on monitoring the dynamics of clusters through time. Our technique discriminates between systems with local positive feedback, where the transition is abrupt, and systems with negative density dependence, where the transition is smooth. Analyzing the spatial dynamics of these two generic scenarios, we show that changes in the critical cluster size provide a reliable early warning indicator for both transitions. Our method may allow for the prediction, and thus hopefully the prevention of such transitions, avoiding their destructive outcomes.
pacs:
87.10.Mn,87.23.Cc,64.60.Ht,05.40.CaI Introduction
The stability of ecosystems, and in particular the response of populations and communities to external perturbations, is one of the main topics in contemporary science Müller et al. (2010). As the impact of anthropogenic changes (carbon emission, habitat fragmentation, introduction of non-indigenous species and pathogens) reaches the global scale, worries about their potential outcomes are growing Dawson et al. (2011). Recently, there is an increasing concern about the scenario known as catastrophic regime shift, where a relatively small change in the environmental conditions leads to a sudden jump of the system from one state to another Scheffer et al. (2001, 2012). This change is often irreversible and accompanied by hysteresis: once the system relaxes to its new state, it will not recover even when the environmental conditions are restored.
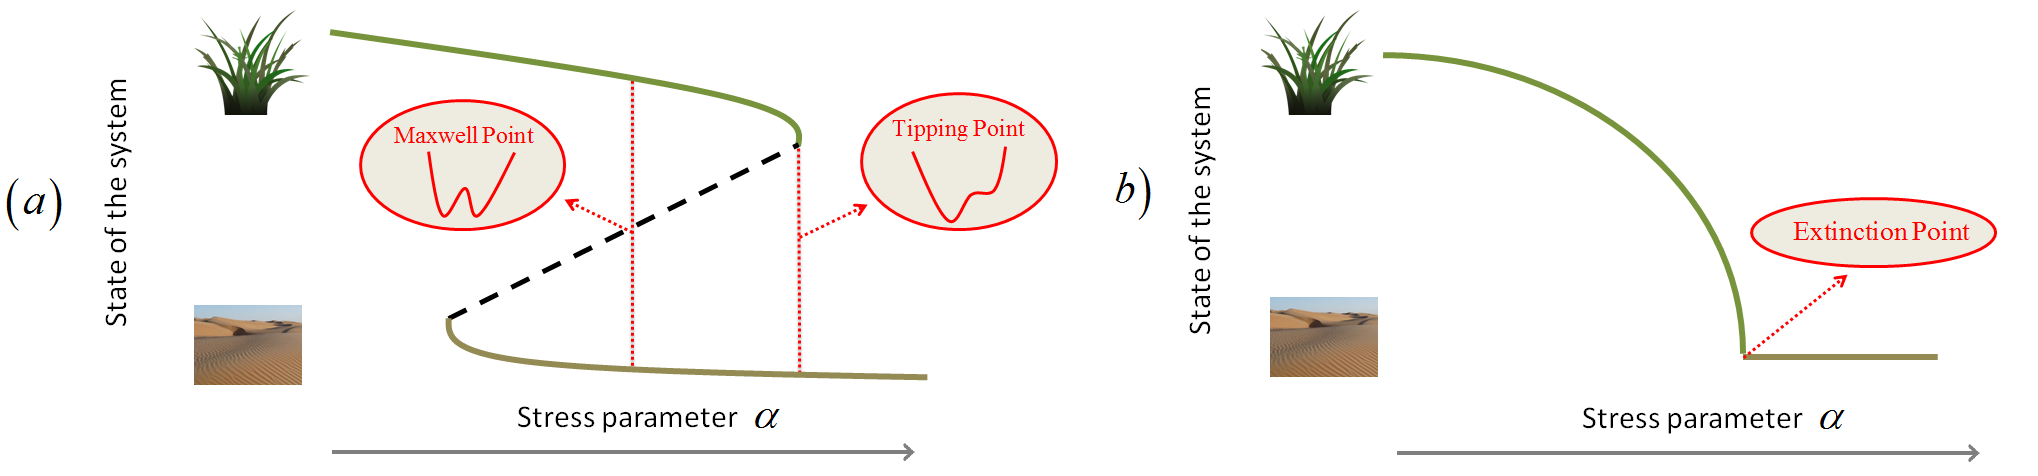
One of the main topics considered in the context of catastrophic shifts is the possibility of sudden extinction of populations as the environment varies Drake and Griffen (2010); Takimoto (2009); Peters et al. (2012). For example, changes in solar radiation owing to variations of the Earth’s orbit may have triggered the sudden mid-Holocene (5000 yrs ago) desertification of the Sahara Scheffer et al. (2001). The standard model used to describe this phenomenon involves nonlinear dynamics that supports two alternate steady states with a (backward) fold bifurcation Scheffer et al. (2001); Rietkerk and Van de Koppel (1997). This mechanism is illustrated in Figure 1a: if the parameter stands for environmental stress (e.g. grazing, or decreased precipitation) the system supports, for certain values of , two stable states, one corresponds to vegetation and the another to bare soil. This bistability is related to the nonlinearity of the system and reflects a positive feedback mechanism HilleRisLambers et al. (2001); Holmgren et al. (1997), such that vegetation grow above some critical density, while below this density the vegetation declines.
Following this insight, the search for early warning indicators that will allow one to predict an imminent transition has become a major research topic in the last decade. Most of these efforts have been focused on the phenomenon known as critical slowing down, meaning that one of the stable states (say, the vegetation state in Fig. 1a) looses its stability at the tipping point Eslami-Andergoli et al. (2014); Scheffer et al. (2009). Accordingly, the rates at which the system recovers from spatial or temporal perturbations become slower and slower as it approaches the catastrophe. This feature has, indeed, been demonstrated in recent experiments (e.g.Drake and Griffen (2010); Dai et al. (2013); Veraart et al. (2012); Carpenter et al. (2011)).
However, a few new studies cast a severe doubt regarding the relevance of these indicators to empirical ecological dynamics. First, critical slowing down and its consequences, like fat tailed or skewed patch statistics, does not necessarily indicate a tipping point or discontinuous transition. All these features are also characteristic of continuous transitions, where the system changes its state smoothly and reversibly without hysteresis Kéfi et al. (2013); Eslami-Andergoli et al. (2014). A schematic illustration for such a scenario is given in Fig. 1b, as an increase in stress leads to gradual extinction without bistability. Continuous transitions of this type characterize various ecological models that describe generic processes, including logistic growth without an Alley effect and the susceptible-infected-susceptible (SIS) model for epidemics. In both cases, and under many other dynamics, the transition to extinction as the birth/infection rate decreases is continuous with no sudden jumps, yet the response of the system to external perturbations becomes infinitely slow close to the transition point (see, e.g., Kessler and Shnerb (2007); Kessler et al. (2008)). A few recent studies, showing a recovery from desertification when the external pressure (grazing, in most cases) has been removed Fuhlendorf et al. (2001); Rasmussen et al. (2001); Valone et al. (2002); Zhang et al. (2005); Allington and Valone (2010), suggest also that the transition is, at least in some cases, continuous and reversible.
Another line of criticism has to do with spatial structure. When a system admits two stable states, local disturbances and fluctuations often generate patches of an alternate state, like regions of bare soil surrounded by vegetation and vice versa. As discussed in more detail below, the Maxwell point (MP, shown in Fig. 1a) marks the boundary between two regimes: to the right of the MP, large patches of bare soil invade vegetation, while to the left of the MP vegetation invades bare soil Durrett and Levin (1994) (MP is also known as the melting point in the theory of first order transitions, and it is the stall point for a front connecting two metastable states). Accordingly, for the generic case of spatial system with stochastic dynamics one should expect the transition to take place close to the Maxwell point, not at the tipping point Bel et al. (2012). However, at the Maxwell point both states are stable, as seen in Fig. 1a, and there is no critical slowing down. Accordingly, all the early warning criteria that are based on the slow recovery of the system at the vicinity of the tipping point will fail to predict the crossing of the Maxwell point, which is the relevant factor that drives the catastrophe in this typical scenario.
Here we would like to suggest a new method aimed at identifying the state of the system. Our method both distinguishes between continuous transitions and catastrophic shifts and provides a quantitative measure of the distance from the transition. This method is based on the monitoring of the cluster dynamics, and in particular the probability of a cluster to grow or shrink as a function of its size. It turns out that this technique reveals the nature of the transition: a catastrophic shift is characterized by a positive correlation between cluster size and its chance of growing, while for a continuous transition the opposite is true, as small clusters tend to grow where as large clusters shrink. The distance from the transition, in both cases, is related to the critical cluster size, and we will show that, as the system approaches the transition point, this size diverges for discontinuous transitions and goes to zero for continuous transitions.
This work, as we shall explain below, is based on simple insights gained from nucleation theory (for discontinuous transitions) and the theory of extinction dynamics. To demonstrate its power, we present a numerical study of two generic models - the Ginzburg-Landau model of irreversible transitions and the contact process model for gradual extinction. Both models are analyzed in the context of desertification, i.e., a transition from vegetation to bare-soil state. However the main lessons acquired are relevant, mutatis mutandis, to the analysis of catastrophic and non-catastrophic transitions in general.
II Results
Our cluster dynamics method is, of course, strongly related to the fact that our system is spatial Durrett and Levin (1994). The spatial dynamics of populations is usually modeled by some kind of ”diffusion” term, representing the random movement (or dispersal) of individuals among neighboring patches. More generally, the feature that lies behind the results presented here is that the spatial dynamics prefers ”smeared” spatial patterns, i.e., the system is trying to avoid strong spatial gradients of population density.
As mentioned above, the main characteristic of bistable systems that allow for catastrophic transitions is positive feedback: in a local patch, small populations go extinct and large populations are self-sustained. However, when the spatial dynamics is taken into account, small patches, for which the area of the surface region is large with respect to their ”volume”, are under stronger stress from their neighborhood, while the effect of surface stress is vanishingly small for large patches. This phenomenon is analogous to the opposing effects of surface tension and bulk free energy that governs the physics of nucleation in first order transitions Kelton (1991). As a result, one expects that, for the same value of the external parameter (say, ), large clusters are more stable, and their tendency to grow (or at least not to shrink) is enhanched with respect to small clusters.
When the system has no, or very weak, positive feedback, there is no bistability, and population density goes continuously to zero at some critical value of the external parameter. However, as discussed by many authors (e.g., Bonachela et al. (2012) and references therein), the spatial structure of the system is still very relevant. The fate of a population depends on the ratio between birth and death rates. In spatial systems the local negative feedback (meaning that individuals cannot reproduce in, or into, occupied sites), when superimposed on the emergent clustering (since death occurs everywhere but reproduction is local) leads to a decrease of the effective birth rate. As a result, the transition in spatial system takes place when the per capita birth rate is larger than the death rate. Accordingly, for these systems the effect is just the opposite: the smaller the cluster, and the larger its interface with empty (or low density) sites, the larger its chance to grow.
To demonstrate the applicability of these qualitative insights, we have analyzed two generic models. For the case of catastrophic shift, we used, as in Bel et al. (2012); Weissmann and Shnerb (2014) the Ginzburg-Landau model, which is the simplest nonlinear dynamics that provides both positive feedback and finite carrying capacity. To model a continuous extinction transition we have implemented the contact process, a canonical model of a birth-death process on spatial domains. As suggested by Grassberger and Jansen Janssen (1981); Grassberger (1982), continuous extinction transitions belong generically to the directed percolation equivalence class, for which the contact process is a standard example. In the context of population dynamics, the applicability of this conjecture was demonstrated recently by Bonachela et al. (2012)),
In Figure 2 the chance of a cluster to grow/shrink is plotted against its size for the Ginzburg-Landau model (see methods). Clearly, the larger the size of a cluster, the larger is its chance to grow. Just the opposite feature is demonstrated in Fig. 3 for the continuous transition: here the chance of a cluster to grow is negatively correlated with its size. This qualitative feature is quite prominent and may allow one to identify the nature of the system (bistable or not) and to guess the characteristics of an imminent transition (continuous or catastrophic) even with poor-quality data.
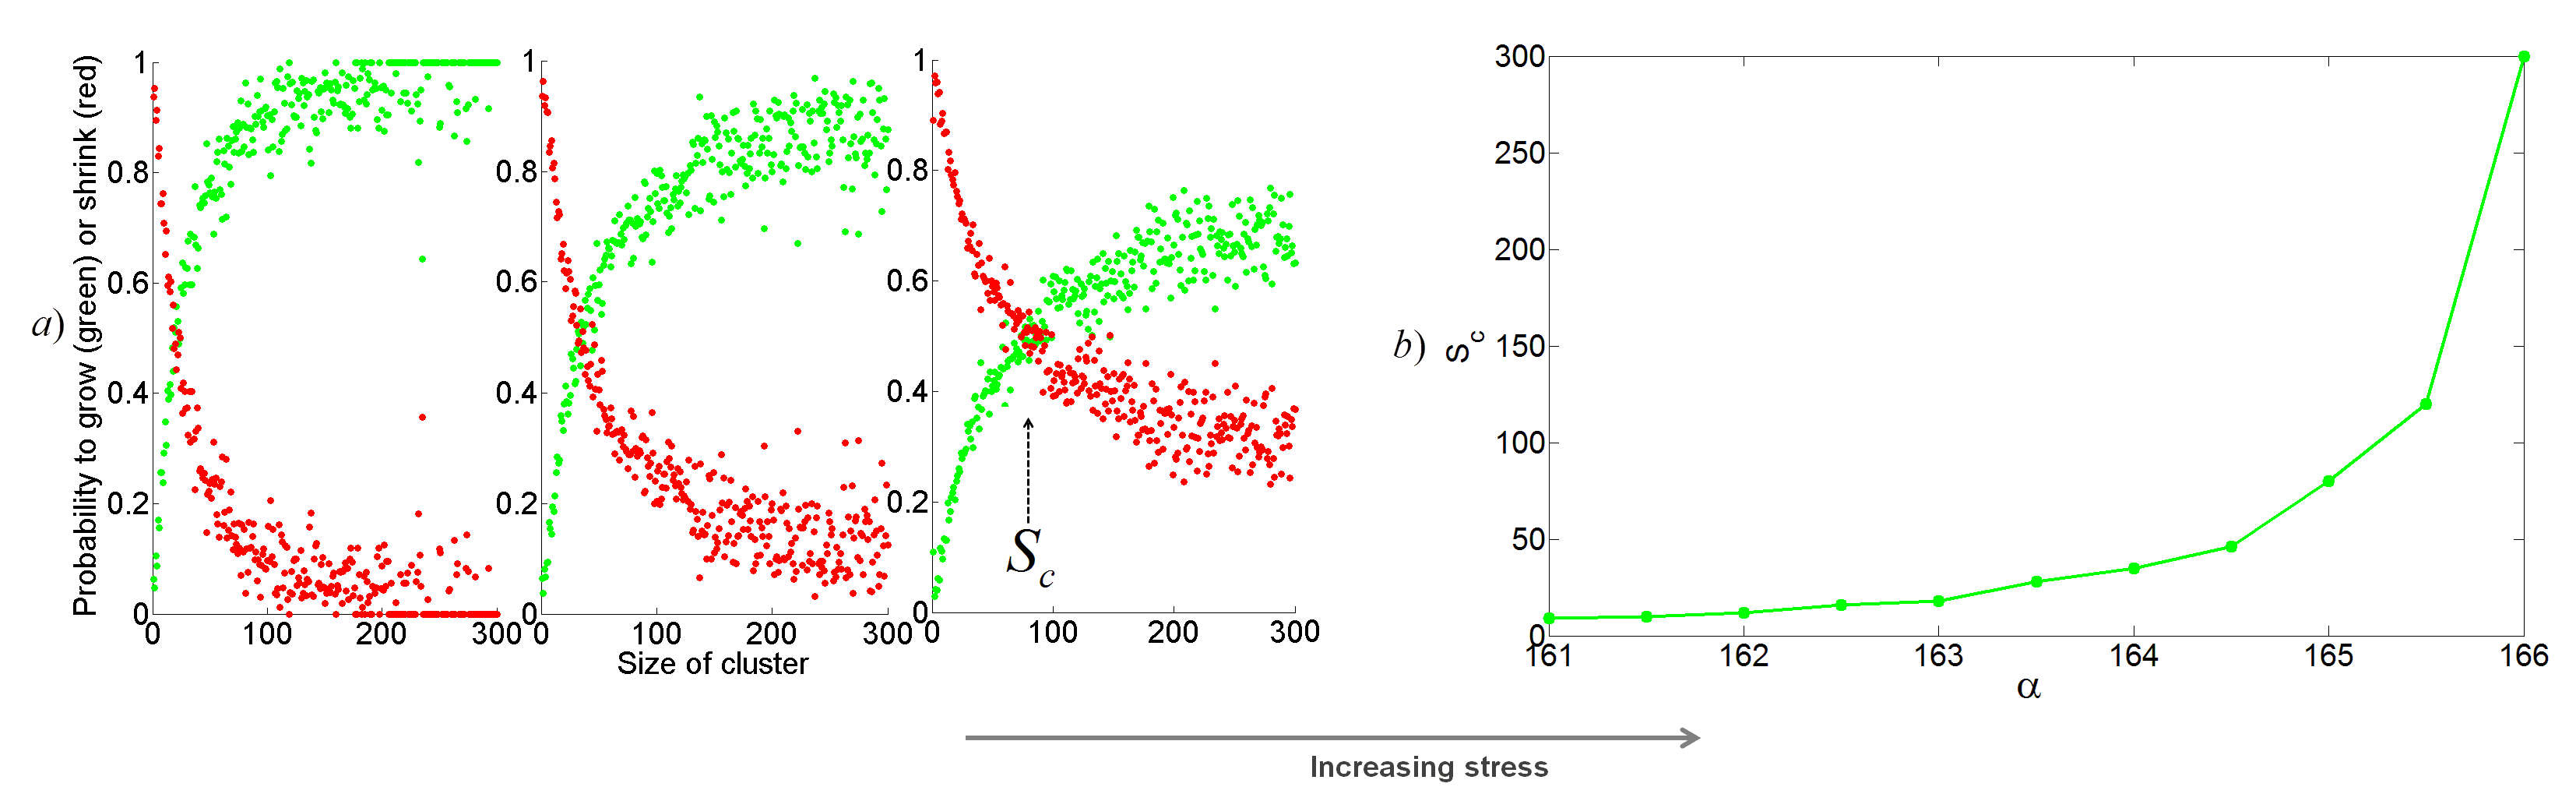
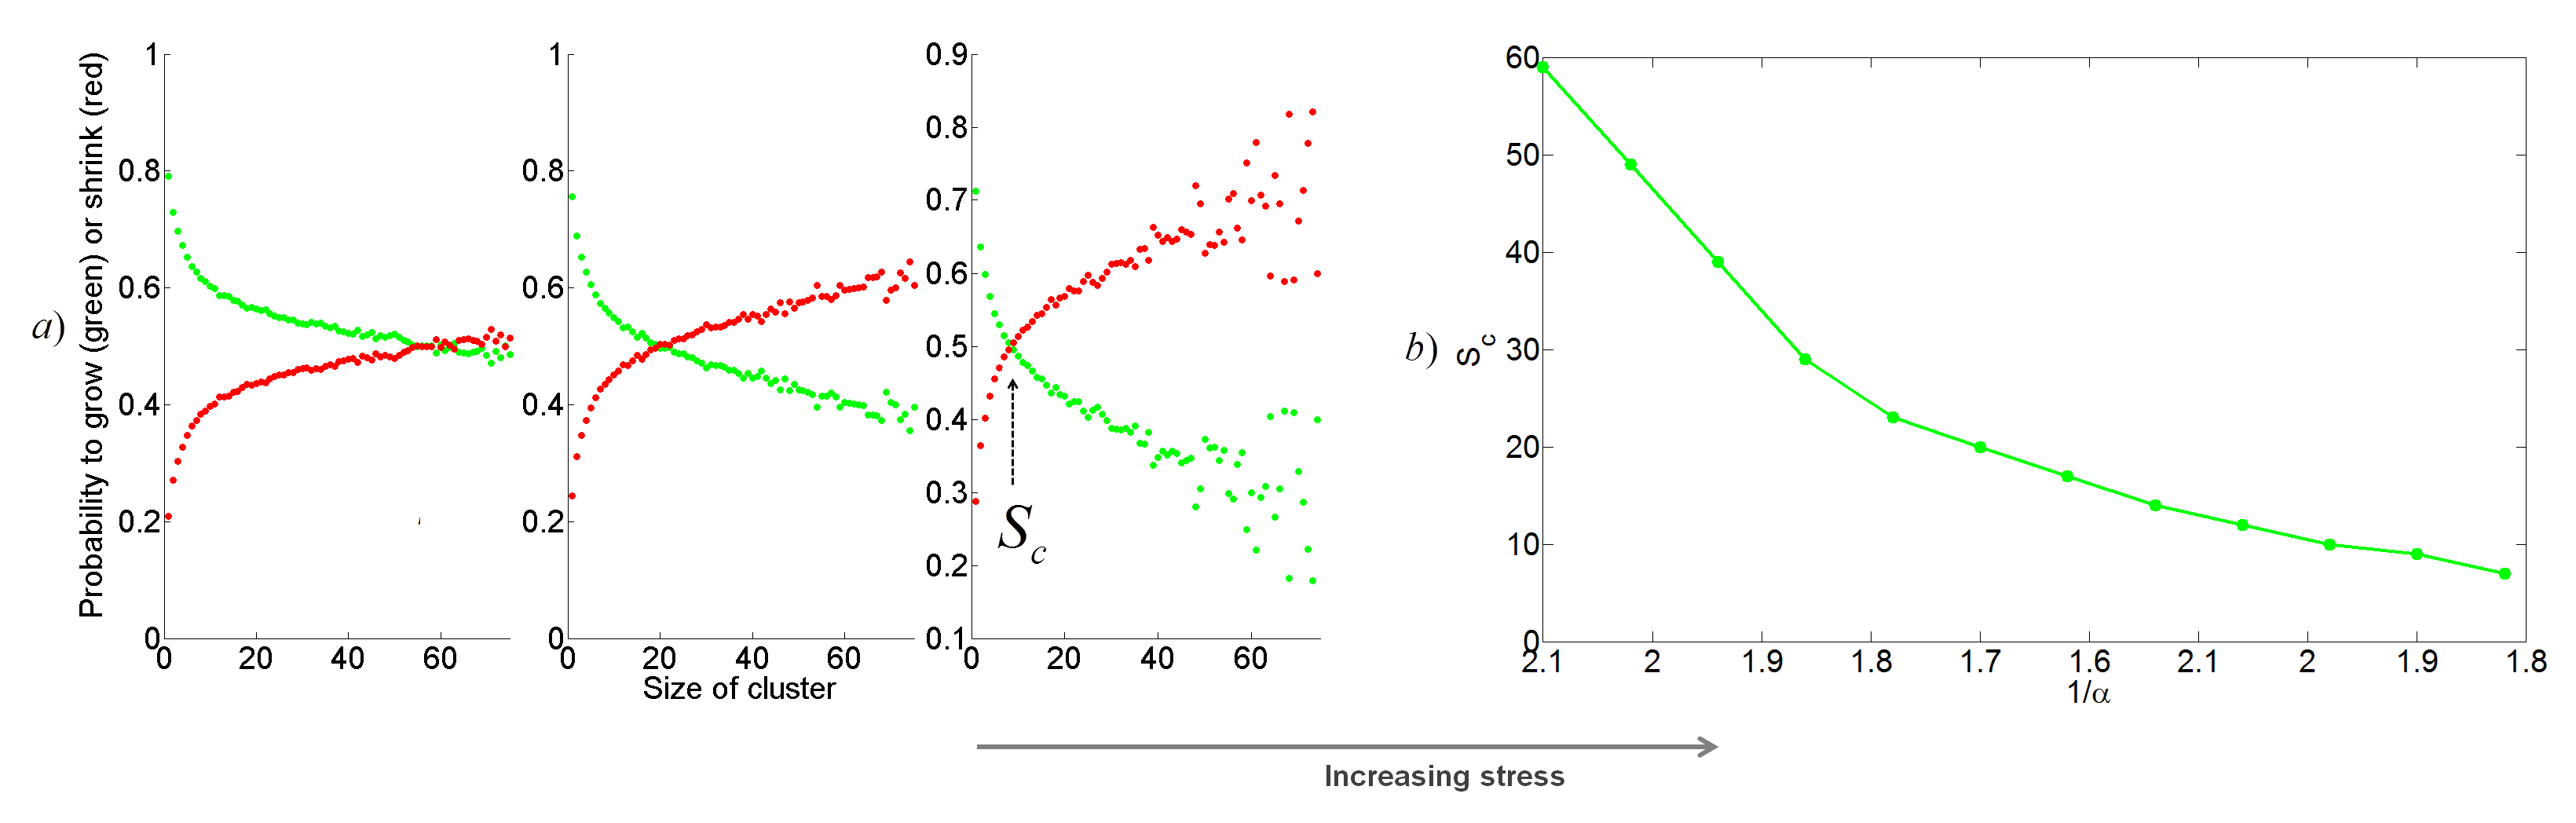
A second feature demonstrated in Figs. 2 and 3 is the appearance of a critical cluster size . Clusters of size neither shrink nor grow on average. In catastrophic (positive feedback) systems smaller clusters shrink and larger cluster grow, while the opposite is true when the transition is continuous. As the value of approaches the Maxwell point () for a bistable system, , meaning that no vegetation cluster grows on average above . On the other hand, in a continuous transition takes its minimal value at the extinction point, indicating that even small clusters cannot grow anymore.
Accordingly, our suggested diagnostic procedure has two stages. The first is based on (at least) two snapshots of the spatial system, allowing for a comparison of the chance of a patch to shrink or to grow, thus indicating the type (bistable/catastrophic or monostable/continuous) of the system. Comparing (at least) three snapshots and tracing the value of along time one obtains an early warning indication of an imminent transition if grows (in a catastrophic system) or shrinks (in a continuous system). This procedure is summarized in table 1.
![[Uncaptioned image]](/html/1506.03344/assets/table.png)
If a bistable system is in its extinction phase (i.e., ), where a large enough patch of bare soil will invade vegetation, but the disturbance that creates this void has not yet happened) the small patch dynamics still provides an indication as to the state of the system, as the lines representing the chance to grow/shrink (see Fig. 2) will level off and saturate, indicating that and that the system is living on borrowed time.
III Discussion
The main insight we have implemented in this paper is the distinction between systems with positive feedback, i.e, positive correlation between the fitness of individuals and the density, and systems with only negative feedback, where an increase of the local density is followed by a decrease of individual’s fitness. In the first case one expects an alternate steady state, hysteresis and catastrophic shift, while in the other case the extinction transition is continuous. As explained above, positive feedback leads to an access growth of large clusters, while in systems with negative feedback small clusters are favorable.
Accordingly, we have suggested two diagnostic tools, both are based on comparison between consecutive snapshots taken from the same spatial domain. First, by comparing (at least) two snapshots one may obtain a quantitative assessment of the importance of positive feedback by measuring the correlation between the size of a cluster and its chance to grow or shrink. Using (at least) three snapshots one may get an early indication of an immanent transition, as diverges (in the catastrophic shift scenario) or shrinks to low values (in the continuous transition case).
Of course, systems with pure positive feedback or pure negative feedback are just the two extremes of a continuum. In many systems positive and negative feedback interfere, and their relative weights determine the characteristics of the transition. In particular, Ginzburg-Landau systems with demographic stochasticity yield a continuous (negative feedback controlled) transition in one spatial dimension Weissmann and Shnerb (2014), and switch to a positive feedback bistable transition for weak demographic noise in two dimensions Martín et al. (2015). Still, when considered from the cluster dynamics perspective, the only factor that determines the nature of the transition is the feasibility of an invading cluster, and our analysis addresses precisely this point.
Another interesting scenario is the case of a neutral dynamics Hubbell (2001), when there are no deterministic forces and no attractive fixed point, and the evolution of the system is governed solely by demographic and environmental stochasticity. Under neutral dynamics the chance of a cluster to grow or shrink is independent of its size. Accordingly, when the figures that correspond to 2 and 3 show a straight line, one may deduce that the dynamics (at least up to the relevant length and time scales) is neutral. This feature was, indeed, demonstrated in Seri et al. (2012) (Fig. 3) for clusters of trees in the tropical forest.
In summary, we have suggested a general diagnostic tool that may serve any specific study of a potential transition on spatial domain. Tracking cluster dynamics along a certain period reveals the dominant mechanism (positive/negative feedback) that governs the dynamics, the expected character of a transition (smooth/abrupt) and its proximity. We hope that this technique will enhance the predictive ability of relevant studies, assisting the effort to avoid undesirable catastrophic transitions, together with their disastrous consequences.
IV Methods
Along this paper we consider and simulate two generic models, one that supports a catastrophic shift and irreversible transition, and another that give rise to a continuous transition without hysteresis. Here we describe the models and our simulation technique.
Catastrophic transition: We have implemented the Ginzburg-Landau model, which is the minimal model that describes a discontinuous (first order) transition. In the context of desertification we are looking at the biomass density, , which satisfies:
| (1) |
Here the term models the effect of positive feedback (an increase of the growth rate with density) and the term enforces a finite carrying capacity. The diffusion term reflects the spatial spread of the biomass, e.g., plant dispersal. For further details, see Weissmann and Shnerb (2014).
In this model, is the bare soil state and the alternative uniform solution is the state with vegetation. An increase in the control parameter corresponds to increased stress (less precipitation, more grazing etc.). Beyond the tipping point at the vegetation state no longer exists; as crosses , a catastrophic shift occurs and the system collapses to the bare soil state. To restore the vegetation state the strength of the environmental pressure has to be reduced until it passes through the other tipping point at .
Simulations of this model were preformed on a , lattice with periodic boundary conditions. The deterministic dynamics was simulated via Euler integration of (Eq. 1) with , implementing asynchronous update to avoid artifacts like fictitious bias of the dispersal. To add disturbances to the model, after every time interval the biomass at each site was multiplied by , where is a random number taken from a uniform distribution between and . The parameters used for the results presented in Fig. 2 are (hence and ),
Contact process extinction transition (Lattice SIS): In a contact process every site is either empty or occupied by one individual (active). An active site dies at a rate one, and is trying to reproduce at rate (again, is a stress parameter, an increase in leads to a decrease of the birth rate). When an individual tries to reproduce, it picks at random one of its neighboring sites, and if the chosen site is empty, it becomes active, otherwise, nothing happens. Accordingly, the productivity of a site is inversely proportional to the local density.
The process was simulated using the Gillespie algorithm on a , lattice. It is known Dickman and da Silva (1998); Hinrichsen (2000) that in this case the transition is continuous and extinction takes place at .
Cluster tracking Trying to emulate the results of consecutive censuses of an empirical system, we have ”sampled” our system every generations: a snapshot of the spatial pattern was taken and the dynamics of clusters is obtained by comparison with the previous snapshot. For the contact process, the definition of a spatial cluster is trivial: it is a collection of active sites in which every pair is connected by a path of nearest neighbor active sites. For the catastrophic shift model every site was classified as ”active” if is in the basin of attraction of the vegetation state and as ”inactive” if this point is attracted to the bare soil state. These clusters were identified and labeled using MATLAB’s bwlabel subroutine.
References
- Müller et al. (2010) F. Müller, B. Burkhard, and F. Kroll, in Landform-Structure, Evolution, Process Control (Springer, 2010), pp. 221–242.
- Dawson et al. (2011) T. P. Dawson, S. T. Jackson, J. I. House, I. C. Prentice, and G. M. Mace, science 332, 53 (2011).
- Scheffer et al. (2001) M. Scheffer, S. Carpenter, J. A. Foley, C. Folke, and B. Walker, Nature 413, 591 (2001).
- Scheffer et al. (2012) M. Scheffer, S. R. Carpenter, T. M. Lenton, J. Bascompte, W. Brock, V. Dakos, J. Van De Koppel, I. A. Van De Leemput, S. A. Levin, E. H. Van Nes, et al., science 338, 344 (2012).
- Bel et al. (2012) G. Bel, A. Hagberg, and E. Meron, Theoretical Ecology 5, 591 (2012).
- Hinrichsen (2000) H. Hinrichsen, Advances in physics 49, 815 (2000).
- Drake and Griffen (2010) J. M. Drake and B. D. Griffen, Nature 467, 456 (2010).
- Takimoto (2009) G. Takimoto, Population ecology 51, 419 (2009).
- Peters et al. (2012) D. P. Peters, J. Yao, O. E. Sala, and J. P. Anderson, Global Change Biology 18, 151 (2012).
- Rietkerk and Van de Koppel (1997) M. Rietkerk and J. Van de Koppel, Oikos pp. 69–76 (1997).
- HilleRisLambers et al. (2001) R. HilleRisLambers, M. Rietkerk, F. van den Bosch, H. H. Prins, and H. de Kroon, Ecology 82, 50 (2001).
- Holmgren et al. (1997) M. Holmgren, M. Scheffer, and M. A. Huston, Ecology 78, 1966 (1997).
- Eslami-Andergoli et al. (2014) L. Eslami-Andergoli, P. Dale, J. Knight, and H. McCallum, Wetlands Ecology and Management pp. 1–12 (2014).
- Scheffer et al. (2009) M. Scheffer, J. Bascompte, W. A. Brock, V. Brovkin, S. R. Carpenter, V. Dakos, H. Held, E. H. Van Nes, M. Rietkerk, and G. Sugihara, Nature 461, 53 (2009).
- Dai et al. (2013) L. Dai, K. S. Korolev, and J. Gore, Nature 496, 355 (2013).
- Veraart et al. (2012) A. J. Veraart, E. J. Faassen, V. Dakos, E. H. van Nes, M. Lürling, and M. Scheffer, Nature 481, 357 (2012).
- Carpenter et al. (2011) S. R. Carpenter, J. J. Cole, M. L. Pace, R. Batt, W. Brock, T. Cline, J. Coloso, J. R. Hodgson, J. F. Kitchell, D. A. Seekell, et al., Science 332, 1079 (2011).
- Kéfi et al. (2013) S. Kéfi, V. Dakos, M. Scheffer, E. H. Van Nes, and M. Rietkerk, Oikos 122, 641 (2013).
- Kessler and Shnerb (2007) D. A. Kessler and N. M. Shnerb, Physical Review E 76, 010901 (2007).
- Kessler et al. (2008) D. A. Kessler et al., Journal of Applied Probability 45, 757 (2008).
- Fuhlendorf et al. (2001) S. D. Fuhlendorf, D. D. Briske, and F. E. Smeins, Applied Vegetation Science 4, 177 (2001).
- Rasmussen et al. (2001) K. Rasmussen, B. Fog, and J. E. Madsen, Global Environmental Change 11, 271 (2001).
- Valone et al. (2002) T. J. Valone, M. Meyer, J. H. Brown, and R. M. Chew, Conservation Biology 16, 995 (2002).
- Zhang et al. (2005) J. Y. Zhang, Y. Wang, X. Zhao, G. Xie, and T. Zhang, New Zealand Journal of Agricultural Research 48, 277 (2005).
- Allington and Valone (2010) G. Allington and T. Valone, Journal of Arid Environments 74, 973 (2010), ISSN 0140-1963.
- Durrett and Levin (1994) R. Durrett and S. Levin, Theoretical population biology 46, 363 (1994).
- Kelton (1991) K. Kelton, Solid state physics 45, 75 (1991).
- Bonachela et al. (2012) J. A. Bonachela, M. A. Muñoz, and S. A. Levin, Journal of Statistical Physics 148, 724 (2012).
- Weissmann and Shnerb (2014) H. Weissmann and N. M. Shnerb, EPL (Europhysics Letters) 106, 28004 (2014).
- Janssen (1981) H.-K. Janssen, Zeitschrift für Physik B Condensed Matter 42, 151 (1981).
- Grassberger (1982) P. Grassberger, Zeitschrift für Physik B Condensed Matter 47, 365 (1982).
- Martín et al. (2015) P. V. Martín, J. A. Bonachela, S. A. Levin, and M. A. Muñoz, Proceedings of the National Academy of Sciences 112, E1828 (2015).
- Hubbell (2001) S. P. Hubbell, The unified neutral theory of biodiversity and biogeography (Princeton University Press, 2001).
- Seri et al. (2012) E. Seri, Y. E. Maruvka, and N. M. Shnerb, The American Naturalist 180, E161 (2012).
- Dickman and da Silva (1998) R. Dickman and J. K. L. da Silva, Physical Review E 58, 4266 (1998).
- Falkowski et al. (2006) T. Falkowski, J. Bartelheimer, and M. Spiliopoulou, in Proceedings of the 2006 IEEE/WIC/ACM International Conference on Web Intelligence (IEEE Computer Society, 2006), pp. 52–58.
- Hartmann et al. (2014) T. Hartmann, A. Kappes, and D. Wagner, arXiv preprint arXiv:1401.3516 (2014).