Spectroscopic Assessment of WISE-based Young Stellar Object Selection
Abstract
We have conducted a sensitive search down to the hydrogen burning limit for unextincted stars over 200 square degrees around Lambda Orionis and 20 square degrees around Sigma Orionis using the methodology of Koenig & Leisawitz (2014). From WISE and 2MASS data we identify 544 and 418 candidate YSOs in the vicinity of Lambda and Sigma respectively. Based on our followup spectroscopy for some candidates and the existing literature for others, we found that 80% of the K14-selected candidates are probable or likely members of the Orion star forming region. The yield from the photometric selection criteria shows that WISE sources with mag and between 10–12 mag are most likely to show spectroscopic signs of youth, while WISE sources with mag and were often AGNs when followed up spectroscopically. The population of candidate YSOs traces known areas of active star formation, with a few new ‘hot spots’ of activity near Lynds 1588 and 1589 and a more dispersed population of YSOs in the northern half of the H ii region bubble around and Ori. A minimal spanning tree analysis of the two regions to identify stellar groupings finds that roughly two-thirds of the YSO candidates in each region belong to groups of 5 or more members. The population of stars selected by WISE outside the MST groupings also contains spectroscopically verified YSOs, with a local stellar density as low as 0.5 stars per square degree.
1 Introduction
While the data return from the Spitzer Space Telescope vastly improved our picture of star formation and circumstellar disk evolution through study of a large number of molecular clouds at mid-infrared wavelengths, Spitzer was a pointed mission with a small field of view. The more recent WISE mission mapped the entire sky in 3.4, 4.6, 12, and 22 filters to a specified 5 point source sensitivity of 0.08, 0.11, 1, and 6 mJy (or 16.5, 15.5, 11.3, and 7.9 mag) at spatial resolution of 6–12. With sky coverage better than IRAS and spatial resolution within a factor 2–3 as good as Spitzer, a clear advantage of WISE is its coverage of many regions of interest that Spitzer simply missed. Sensitivity with WISE is comparable at all but the 22 / 24 bands to Spitzer’s shallow surveys, e.g. GLIMPSE in the Galactic plane.
Circumstellar disks surround young stars for the first several Myr of their lives. These disks create infrared through millimeter wavelength excesses due to thermal emission from dust that is distributed over distances from a few hundredths to several hundred AU from the star. Spitzer and WISE both probe the infrared excess emission that arises within a few AU.
As Spitzer mapped primarily the young constituents of known molecular clouds, our knowledge of disk evolution time scales based on Spitzer studies is still biased and somewhat limited. WISE, however allows us to fill in many gaps in studies of nearby star forming regions. Particularly noteworthy wide-field studies that were enabled by WISE include those by Rebull et al. (2011) on Taurus, Rizzuto et al. (2012) and Luhman & Mamajek (2012) on Upper Sco, and Koenig et al. (2012) and Koenig & Leisawitz (2014) on outer Galaxy regions.
The Orion molecular cloud and young star complex is a benchmark star forming region (see Bally 2010 for a review). Orion’s prominence is due to its proximity (400 pc) as well as its representation of both high and low mass star formation, of clustered and isolated star formation, and of future, ongoing, and recent star formation. The Ori cluster, just west of the Horsehead Nebula and below the easternmost “belt star” in the constellation Orion, is a 3–5 Myr old cluster associated with the central O9.5V star. Its stellar population has been studied by Wolk (1996), Sherry et al. (2008), Caballero et al. (2008), and Lodieu et al. (2009) and currently contains 350 confirmed members and another 300 photometric candidates. There is relatively little molecular gas in the region (e.g. Lang et al., 2000); it is located between the Orion A and Orion B giant molecular clouds. The Ori cluster, near the famed Betelguese in Orion, is a 4–8 Myr old cluster associated with the central O8 III star and contains ten additional B stars. Its low mass population has been studied by Dolan & Mathieu (1999, 2001, 2002), Barrado y Navascués et al. (2004), and Sacco et al. (2008) though membership is vastly incomplete and knowledge of spectral types limited. A surrounding ring includes dust and swept-up neutral and molecular gas (e.g. Lang et al., 2000) and potentially younger stars than those immediately surrounding Ori. There is also suggestion of a previous supernova explosion (Cunha & Smith, 1996). For reviews of these two regions, see Walter et al. (2008) and Briceno (2008) respectively, for the Ori cluster and the extended Orion OB1a/OB1b region included in the presentation below, and Mathieu (2008) for the Ori region.
Rich clusters in the age range of Ori and Ori are relatively rare. Complete surveys with WISE of these two clusters are thus important for census building, and for overall and uniform studies of circumstellar disk properties and for our understanding of disk evolution. Analysis of 2MASS data alone shows that these two clusters indeed have a lower fraction of near-infrared excess relative to many 1–3 Myr old clusters still assocatiated with molecular gas. A key question is whether the mid-infrared excess fraction is also proportionally lower or similar; the former would imply disk depletion at all radii relatively quickly whereas the latter would suggest inside-out depletion.
2 The WISE view of and Orionis
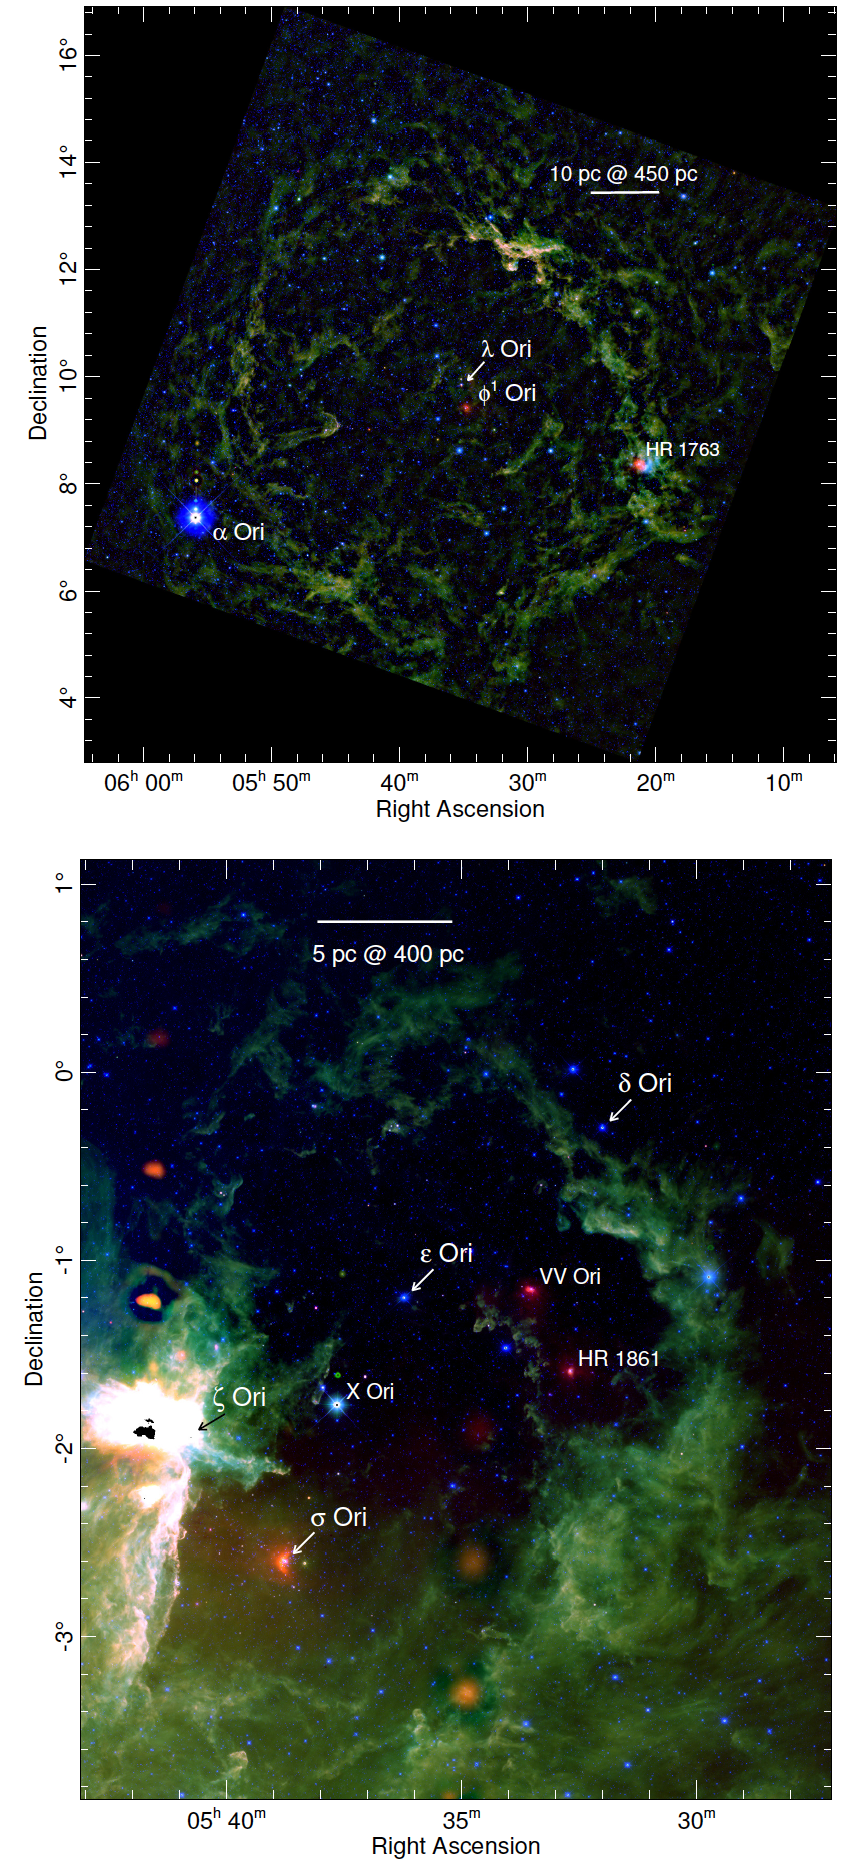
Figure 1 shows a 3-color composite of WISE image data in the 3.4, 12, and 22 () bands for the and Orionis fields. Emission at 12 (green in the figure) is dominated by bright PAH emission that traces cloud surfaces and reveals the well known Orionis ring, as well as the ring around the extended Orionis field. The 3.4 band (assigned to the blue channel in the figure) has some contribution from PAH emission lines, but mainly picks out stellar photospheric emission from foreground and background stars. The 22 band (in red) captures thermal emission from dust grains which highlights cloud surfaces in the same way as , but also heated dust close to OB stars. A SIMBAD search shows that in the Ori region this feature is seen around Orionis (B0.5III) and HR 1763 (B1V). In the Ori region a bow-wave feature around Orionis, (see Ochsendorf et al., 2014) and halos around VV Ori (B1V) and HR 1861 (B1IV) are picked out by bright, extended 22 emission. These stars are labeled in the figure, as well as the three main belt stars of the Orion constellation and X Ori, a Mira variable evolved star.
Note that the other red, evenly spaced, diffuse patches of emission aligned vertically with the bright emission in the eastern part of the Ori region and also appearing in the lower, central part of the panel are image artifacts in the 22 WISE images.
3 Initial YSO Selection Criteria
The combination of 1.2, 1.6, and 2.2 photometry from 2MASS with the 3.4, 4.6, 12, and 22 photometry from WISE is a sufficient lever arm on the stellar (e.g. from colors) to circumstellar (e.g. from and colors) regime that robust identification of evolving and dissipating young circumstellar disks can be made.
We initially extracted sources from the regions surrounding and Orionis from the WISE All Sky point source catalog. For the former we extracted a region bounded by 84.0RA85.5 degrees and Dec degrees (J2000.0), for the latter a polygon with vertices at (RA, Dec) = (77.1 11.6; 87.7 15.4; 90.8 6.5; 80.5 2.8) to encompass the full extent of the large ring of emission that surrounds the Orionis H ii region, as seen in the WISE band 3 atlas images at 12 .
The WISE All Sky catalog also provides photometry in the near-infrared , and bands from 2MASS. The WISE All Sky photometry pipeline uses a match radius of 3 to identify the 2MASS counterparts of WISE sources.
We then applied an early version of the WISE-2MASS YSO classification and galaxy filtration scheme of Koenig et al. (2012). As described by Koenig et al. the scheme first applies WISE color and magnitude cuts to remove background unresolved star-forming galaxies and active galactic nuclei (AGNs). These objects are typically redder and fainter than the majority of young stars in Galactic star-forming regions. A further round of cuts is made to remove objects likely to be shocked blobs of gas in young star outflows (bright at WISE band 2) and spurious detections of bright nebular emission (objects with very red color). The remaining sample is then classified into young star ‘classes’ using WISE colors, matching the categories laid out by Greene et al. (1994) as best as possible. This scheme does not attempt to find either Class III or Flat SED objects, however, only Class II and Class I. Additional young stars are selected based on combined WISE and 2MASS colors, aiming to retrieve those objects missed due to their WISE band 3 detection being obscured by bright nebular background emission. The final steps of the scheme look for candidate transition disk objects (Strom et al., 1989) with red colors and test whether the previously classified Class I objects have red enough colors, or are more likely to be the more evolved Class II.
In the initial selection process for this study, we differed from the Koenig et al. (2012) scheme just described in the follow ways. We did not set an upper limit to the magnitude error in a given band, but simply required that if photometry was needed for a given classification criterion, that the photometric uncertainty should have a non-null value. We also used a more lenient magnitude cut for star-forming/PAH galaxies of and we did not apply the very last cut of the scheme that removes objects at the blue end of the WISE T Tauri star locus. The region of WISE color-color space roughly defined by and is occupied by older, more evolved Classical Be stars (as subsequently shown by Koenig & Leisawitz, 2014, hereafter, K14), but it can also contain young ‘transition disk’ objects (see Cieza et al., 2012). Contamination of WISE band 4 at 22 by fake detections due to nebulosity produced a large number of candidate transition disks in this initial YSO candidate list. We thus required a signal to noise at band 4 of at least 4.5, and set an upper limit to the of 6 to suppress falsely classified objects.
Having produced a list of candidate YSOs for both Ori and Ori, we additionally constrained the source lists before each spectroscopic run at the telescope, as described below.
4 Spectroscopic Target Selection and Observations
In total, 230 sources were observed spectroscopically at the Palomar Observatory 200” telescope. All data were collected with the Double Spectrograph (originally comissioned by Oke & Gunn 1982 but with many upgrades since that time) using a dichroic at 4800 A and a 1200 l/mm red and a 300 l/mm blue grating. Exposures of FeAr and HeNeAr lamps were obtained for the blue and red side wavelength calibration.
The spectra were collected over several years, with evolving selection criteria.
4.1 2009 Spectra
As part of an unrelated program studying low mass stars in Ori (Cody & Hillenbrand, 2014), spectroscopic observations were taken in 2009 of known members that were later revealed to be of interest from the vantage of the current WISE study. These objects were selected for spectroscopy based on their presence in the fields photometrically monitored by Cody & Hillenbrand (2010) and lack of a published spectral type at that time.
As discussed by Cody (2012), observations took place on the nights of 18–21 January and 19–20 December with 68 unique low mass stellar and brown dwarf objects in Ori observed.
4.2 2012 Spectra
For the first run dedicated to WISE follow-up in Ori and Ori, we required all stars to have non-null photometric error in WISE bands 1 and 4 and to not suffer from the diffraction spike, scattered light halo, optical ghost or latent contaminant flags (SQL query: cc_flags not matches ’[DHOP]’). To minimize obvious contamination by background galaxies, we required the 2MASS Extended Source Catalog proximity column xscprox to be either null or . Finally, using the WISE band 4 image atlas we inspected all the YSO candidates and rejected objects that were extended or whose 22 emission appeared to be offset from the shorter wavelength centroids by more than 2. In both fields we noticed a concentration of objects with red colors that appears at magnitudes fainter than and . The spatial distribution of these detections is roughly uniform; thus they are likely mostly extragalactic, so we also cut them from further consideration. We obtained optical photometry for all sources where available from the NOMAD111http://www.usno.navy.mil/USNO/astrometry/optical-IR-prod/nomad online database and restricted our targets to objects with magnitude less than 18.3. For Ori we were able to use imaging data from the Sloan Digital Sky Survey222www.sdss.org to confirm that objects fainter than are indeed dominated by galaxies.
In Ori we obtained 29 objects with DBSP on 01 January, 2012, UT, selecting those YSO candidates with and without existing spectral types in the literature or in Cody’s thesis work discussed above. Most objects having and were observed, as were most objects at all brightnesses with . Among objects with , the observations focused on those without previous designations in SIMBAD, i.e. WISE is the first that attention has been called to them. A few objects meeting the above criteria had roughly equal brightness, close companions within a few arcsec in 2MASS or on the telescope guide camera when slewing to the field. These were excluded from observation due to concerns about contamination in the excess selection, since we didn’t have enough information to attribute or excesses between close equal sources.
In Ori we obtained 40 objects with DBSP on 02 January, 2012, UT, selecting YSO candidates with and and a cut during the observing. We also limited ourselves to targets south of Declination +09 so as to avoid the areas previously studied by others, namely, the 1 deg2 around Ori itself and the B30 and B35 regions, with the goal being that our work with WISE is unique in the lower Declination areas.
The prioritization for observations was a combination of brightness (brighter objects at high airmass) and color. Nothing with was observed (i.e., none of the Class III/transition disk candidates). We focused on the reddest colors. At the faint end, some spectra turned out to be active galactic nuclei (AGNs), but in general we attempted to observe the faintest YSO candidates. Spatially, the clustering of excess objects coincident with the Ori ring towards the southeast was prioritized; this spatial cut also captured many of the reddest objects that were not so faint as to be likely extragalactic contaminants. In examining regions to the west of Ori, almost every WISE-selected YSO candidate with was observed.
4.3 2013 Spectra
In 2013, all targets were in the Ori field, again with a focus on the western and southern parts of the region. We selected YSO candidates with to avoid both infrared-bright asymptotic giant branch stars (AGBs) and faint AGNs, although we did not impose a color criterion. In total, 80 sources were observed on 2, 4, 5 February 2013, UT.
For this run, we did not apply the additional WISE band 4 quality assessment, or the requirement on the cc_flags parameter that were used for the 2012 run. One result potentially attributable to this modification is that the fraction of observed sources with emission lines was lower than in the earlier spectra.
5 Spectroscopic Data Reduction and Analysis
Two-dimensional CCD images from both the blue and red channels of the spectrograph were corrected for detector bias and flat field and one-dimensional spectra were extracted, wavelength calibrated, and flux calibrated, all within the twodspec and onedspec packages of IRAF. In 2012, Feige 34, Feige 110, Gl 38-31, HD 19445, and HD 199178 were used as flux standards while in 2013, Feige 34, HD 93521, Hiltner 600, and G 191B2B served the purpose. For our setup, the full spectral range on the blue side was 3525–5075Å, and on the red side 4660–10,940Å, though mediated by the dichroic and the atmosphere.
The stars were classified visually by comparison to the Jacoby, Hunter & Christian (1984) and the Allen & Strom (1995) standards. The DoubleSpec blue side and red side spectra were classified independently, with the final spectral type taken as the intersection of the ranges concluded on each side.
Emission and absorption lines were studied in each object. Equivalent widths were measured for H, Li I 6707 Å, the Ca II triplet at 8498, 8542 and 8662 Å, and related H and K lines at 3933 and 3968 Å. Other emission and absorption lines noted in some spectra included [O I] 6300, 6363 Å, [S II] 6717, 6732 Å, O I 8446 Å, Na I 5890 Å, He I 5876 Å, and the Balmer series of Hydrogen out to H. Several objects with the Balmer jump clearly in emission were also identified.
We found that objects with mag and between 10–12 mag were most likely to show spectroscopic signs of youth such as strong H or the Ca II triplet in emission. Extremely red objects with mag and were more likely to be AGNs.
6 Updated YSO Selection Criteria
The initial WISE-based selection criteria and spectroscopic follow up observations described above served to obtain a sample of young stars with optical spectra in the and Orionis regions. Subsequent work by K14 showed that this original YSO finding scheme generates a large number of spurious candidate young stars. We thus implemented for final presentation here the more robust YSO finding procedure detailed in K14. The K14 scheme begins in the same way as K12 by removing extragalactic contaminants (AGNs and star-forming galaxies). It does not include a step to remove detection of sources that appear red due to nebular emission because it relies on the fact that YSO candidates occupy loci in color space that naturally separate them from these detections. As with K12, the scheme then uses WISE and then WISE+2MASS color criteria to identify and classify Class I and II YSOs. Final steps select candidate transition disk objects with red colors and retrieve candidate protostars from objects flagged as AGNs that are bright at . A new feature of the K14 scheme is the addition of an explicit phase of AGB star removal that uses cuts in the WISE vs. color-color and vs. color-magnitude diagrams. Table 1 presents a comparison of the number of YSO candidates produced by the K12 method described in Section 3 with the number produced by the K14 scheme, over the area of sky shown in Figure 1. The newer selection algorithm clearly finds a greatly reduced number of candidates as a consequence of its more conservative design.
| Method | N(Class I) | N(Flat) | N(Class II) | N(Class III) | N(Transition Disk) |
|---|---|---|---|---|---|
| Ori | |||||
| K12 | 405 | 1621 | 12653 | ||
| K14 | 77 | 452 | 15 | ||
| 58 | 80 | 353 | 53 | ||
| Ori | |||||
| K12 | 159 | 854 | 2855 | ||
| K14 | 24 | 381 | 13 | ||
| 9 | 27 | 300 | 82 | ||
Note. — K12 refers to the scheme of Koenig et al. (2012), specifically as described in Section 3. K14 refers to the scheme of Koenig & Leisawitz (2014). refers to YSO classes based on the slope of the infrared SED.
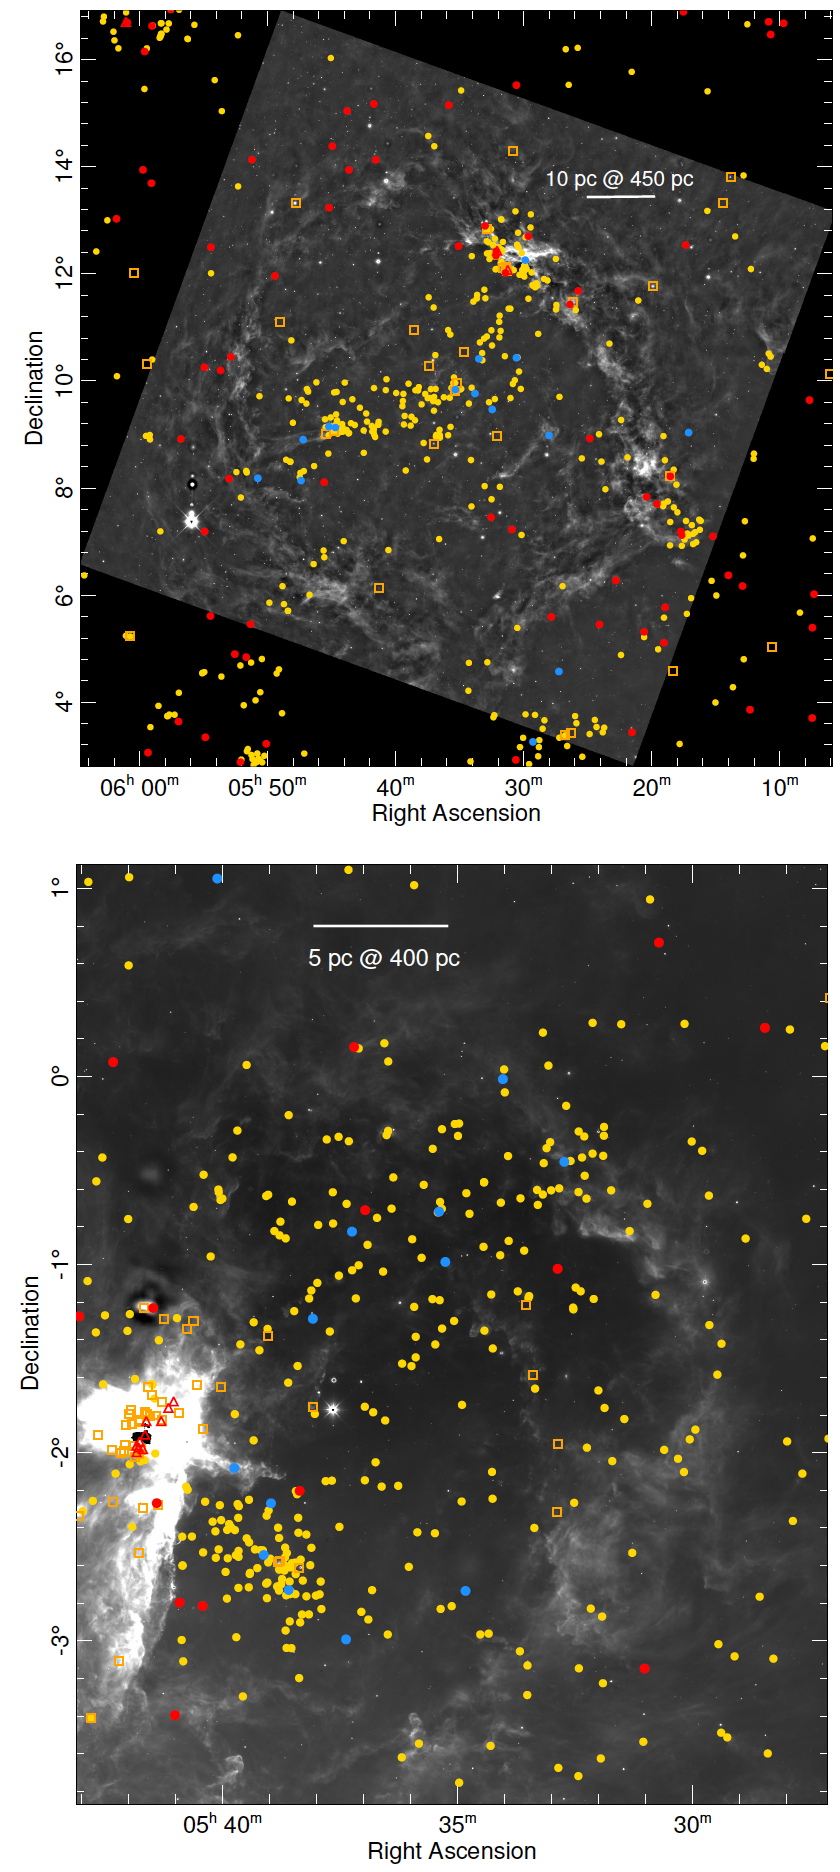
The spatial distribution of YSO candidates found using the K14 scheme in and Orionis is shown in Figure 2. To assess the new contribution made by our survey to the distribution of YSO candidates in the two regions, we carried out a census of the relevant literature. Both the and Orionis regions have been surveyed by many authors. The main studies in Ori are those by Hernández et al. (2010) and Dolan & Mathieu (2002). In Ori we compile the Mayrit catalog of Caballero (2008) and the studies by Peña Ramírez et al. (2012), Briceño et al. (2005), Megeath et al. (2012), Béjar et al. (2011) and Luhman et al. (2008).
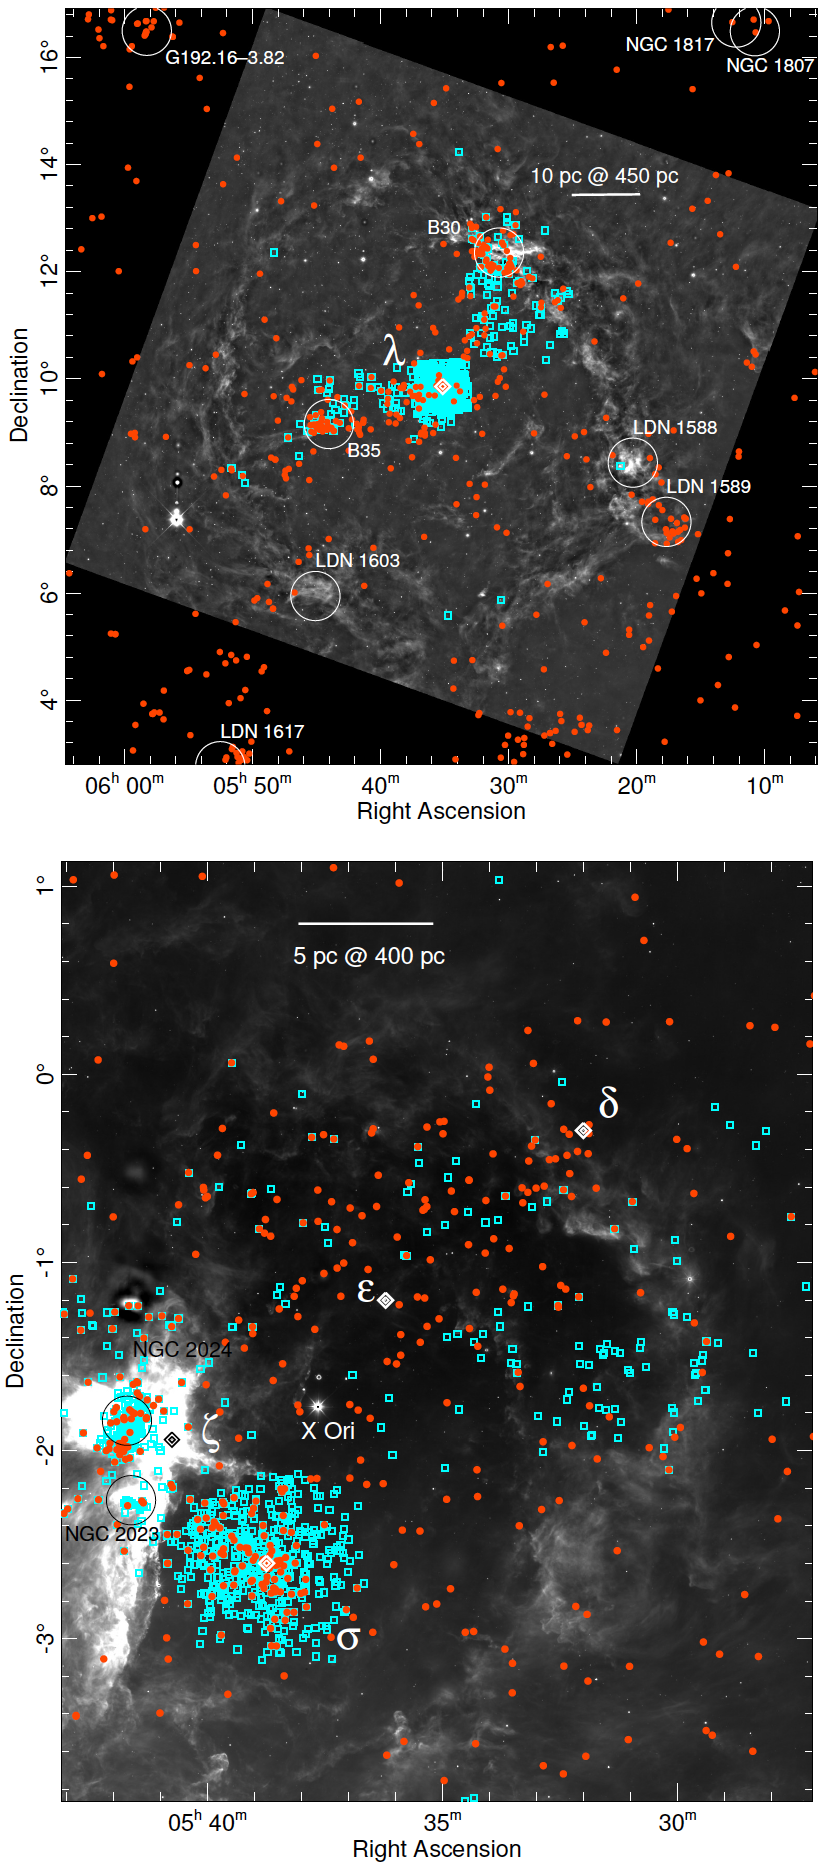
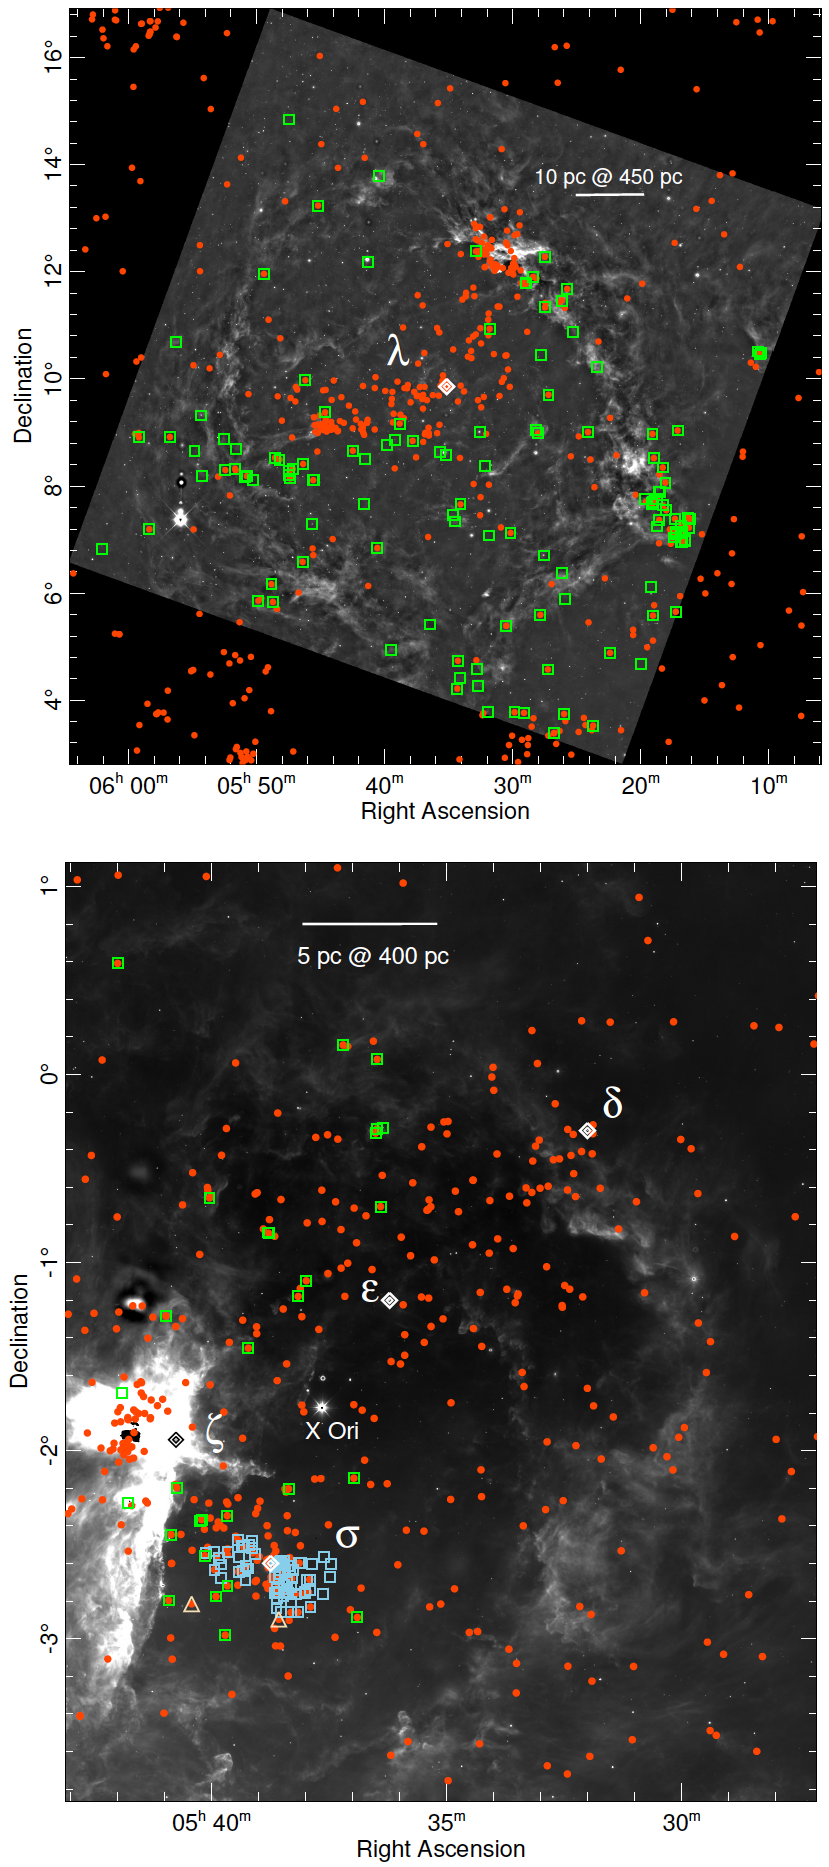
Figure 3 shows how the compiled list of previously known likely members of the two regions relate to the newly identified WISE YSO candidates found in this paper. Figure 4 shows the distribution of the targets followed up with optical spectroscopy in the two regions. The upper panels of Figures 2, 3 and 4 show that our extracted sample of YSO candidates extends beyond the boundaries of the Ori ring. G192.163.82 is an H ii region at a distance of 1.52 kpc (Shiozaki et al., 2011), with an associated young cluster (Carpenter et al., 1993). LDN 1617 is known for its association with Herbig Haro outflow sources and is at a distance 400 pc (Kajdič et al., 2012).
6.1 YSO Spectral Slopes
While the scheme of K14 provides an assessment of the distribution and a simple breakdown of the evolutionary state of the YSO candidates that it selects, a more commonly used means of dividing young objects with infrared excess emission is to use the slope of their spectral energy distributions (SEDs) in the near and mid-infrared. We follow the methodology of Greene et al. (1994) developed for the availability of K-band and 25 m IRAS measurements, and compute , the slope of the SED, for each YSO candidate over the longest possible wavelength baseline available from 2MASS and WISE (note: we do not perform a fit to the SEDs). Ideally we compute from the slope between the 2MASS band to 22 m at WISE band 4, requiring non-null band photometric error, signal to noise in and . If a source does not meet the band requirement we derive from the slope between and , requiring signal to noise in . If the band 4 photometry fails the above criteria we use WISE band 3 with the same test on signal to noise and at , paired with either 2MASS or as appropriate. Finally we resort to the slope between 2MASS and WISE bands if , and all fail the above tests. is computed from the following equation:
| (1) |
Note that for all objects, we attempt to remove the effects of dust extinction by looking up the value of in the nearest pixel in the -band extinction map of Lombardi et al. (2011). We compute the extinction in the 2MASS bands using the extinction law of Rieke & Lebofsky (1985) and in the WISE bands using the interpolation presented in Koenig & Leisawitz (2014). Having derived a value of for each YSO candidate, we divide them into the categories of Greene et al. (1994) as Class I ( 0.3), Flat ( ), Class II () and Class III (). Note that the Class III category does not signify ‘no infrared excess,’ but rather ‘weak excess.’ We tabulate the resulting breakdown of source types in Table 1. In both fields, some fraction of the K14 Class II sources are categorized as Class III in the prescription, and some are placed in the ‘Flat-SED’ class, although no more than 20% in either case. However, from the K14 Class I sources, 63% of the candidates in Ori move to the Flat SED class under the calculation, compared with 25% in Ori. In general this suggests that the Class I sources in Ori extend to much redder colors such that their slopes are consistent with a Class I source in that prescription. However, it should be noted that the most embedded clusters in the Ori region, those near to NGC 2023 and 2024, are poorly characterized in this survey, owing to the high degree of saturation in the WISE band 3 and 4 images in that area. This issue limits the robustness of the comparison of the SED class distributions between and Ori.
The Class III category in the prescription is an overlapping set with K14’s Class II and transition disk sources, because its only definition is a steeply negative SED slope. Since transition disk candidates are selected on the basis of weak excess in color and strong excess in , most of the transition disk objects in our samples are actually counted as Class II YSOs by the prescription (14/15 from the Ori sample, 11/13 from Ori).
7 Assessment of the WISE-Selected YSO Candidates
7.1 Spectroscopic Success Rate in YSO Confirmation
In Orionis, 75 of our spectra were YSO candidates from the K14 selection scheme. In Orionis, we obtained spectra of 48 K14 YSO candidates. We examined how many of these targets showed emission in either the H (equivalent width Å) or Ca II 8542 (equivalent width Å) lines as a simple test of ‘youth,’ although it should be noted that many M stars show H in emission. In Orionis, 50/75 objects (67%) met these criteria, while in Orionis 28/48 spectra (58%) met these requirements. While a more general indicator of youth is provided by the Lithium Li I 6707 Å line, our Palomar spectroscopic data are not only too low in resolution for this to be a reliable youth test, but were also found to suffer significant uncertainty due to a feature at this wavelength in the flat field that can be traced to the long decay time of a dome light, resulting in additional absorption at this wavelength in the final spectra. For this paper, we choose not to use the measured Li I equivalent width measurements.
7.2 Spectral and Mid-Infrared Properties
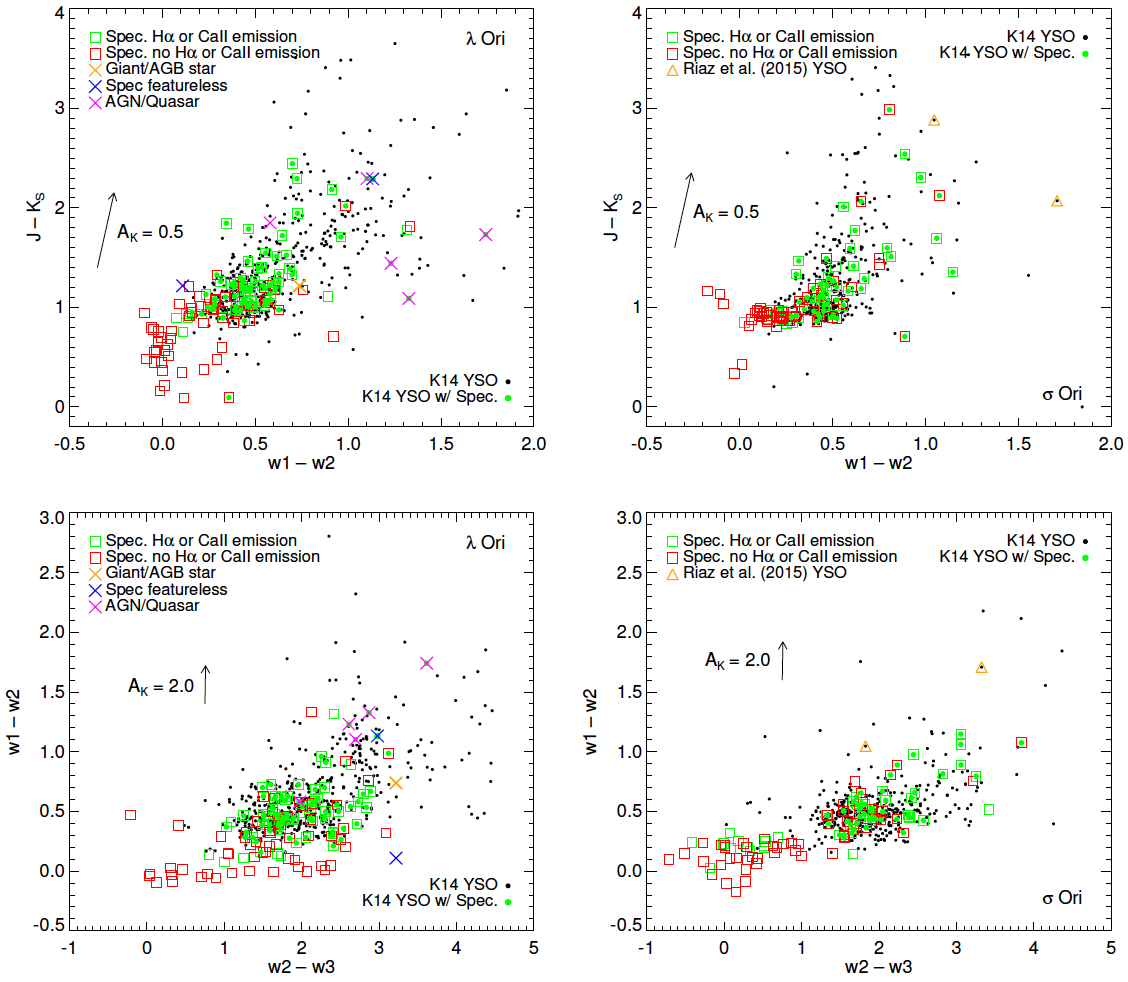
In Figure 6 we show color-color diagrams of the K14 WISE YSO candidates in the two Orion regions. We overlay the colors of the spectroscopic sample acquired in each field, separating those with and without H or Ca II 8542 Å above our threshold values, and distinguish those spectra that correspond to K14 YSO candidates and those that are not picked out by that selection process. In the panel for Ori, we also show the location of the two objects investigated by Riaz et al. (2015), both of which are candidate YSOs in our selection scheme and both of which appear to be good spectroscopic YSO candidates.
In both Ori and Ori a significant fraction (28/75 and 21/48 respectively) of spectroscopically observed K14 WISE YSOs do not show significant H or Ca II 8542 Å in emission. However, above = 1.3, a majority of WISE selected YSOs do exhibit emission in these lines. Figure 6 shows that in WISE color-space, a similar increase in the prevalence of H and/or Ca II 8542 in emission is seen when and .
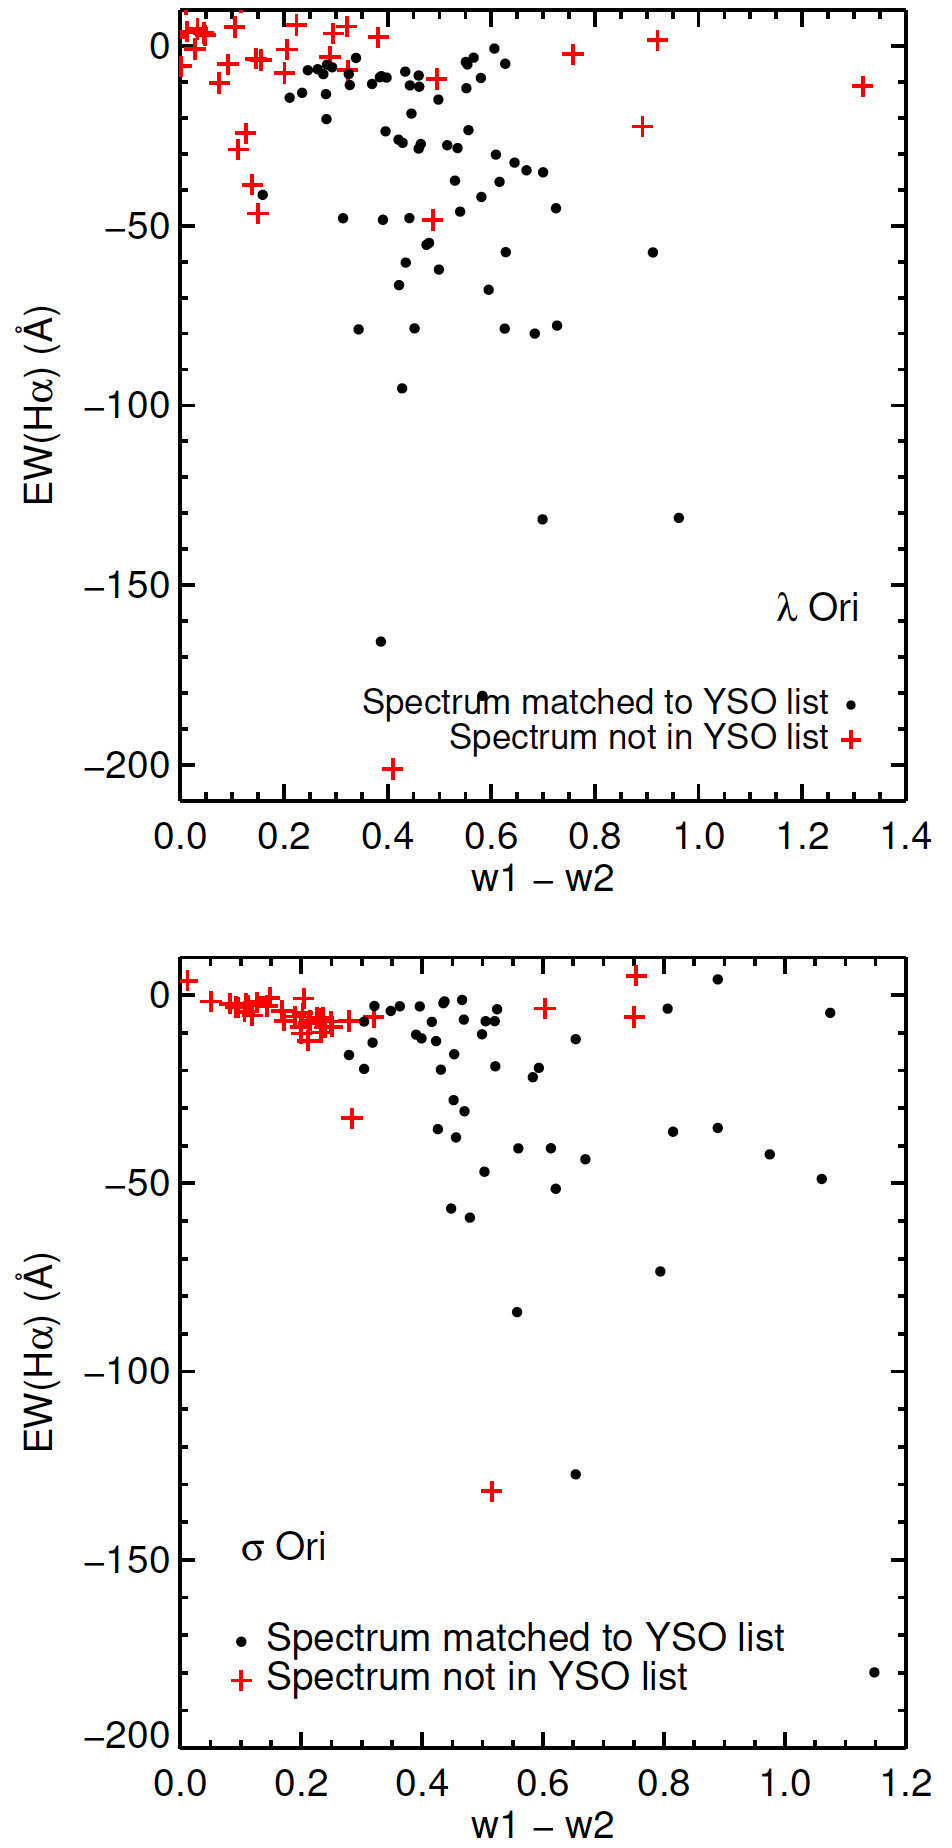
Objects followed up with spectra also exhibit differing distributions of H equivalent width between the K14 YSO candidates and those spectra not identified by these criteria (i.e., acquired under either the K12 criteria for infrared excess or as part of the Cody & Hillenbrand (2014) sample). Larger EW(H) in emission (i.e. more negative) are seen in the K14 selected YSO candidates. In Figure 5 we plot the equivalent width in the H line versus observed WISE color for the full spectroscopic sample, whether matched with the K14 YSO catalog (black points) or not (red crosses). In both fields a K-S test showed a probability that the equivalent width distributions were drawn from the same parent distribution. The anomalous red cross points with 0.6 were not selected as YSOs by the K14 scheme either because they failed to meet the requisite photometric quality criteria, or were rejected as AGB candidates because they have very bright apparent magnitude.
We conclude that the K14 YSO selection scheme has been tuned relative to the K12 YSO selection scheme to be an efficient method of identifying Class II and Class I objects having significant excess in 2MASS or WISE filters. The K14 selected YSOs are likely to have greater amounts of circumstellar material and therefore perhaps higher accretion rates than those objects with only weak infrared excess.
7.3 Spectra of Objects Outside the K14 WISE Selection
Approximately half of the optical spectra are of objects not designated as YSO candidates by the K14 scheme. Specifically, in Ori, 55 of the 130 and in Ori, 52 of 100 objects for which we acquired spectra do not correspond to a K14 WISE YSO candidate. As described above, this feature is partly because some of our spectroscopic targets were selected with earlier versions of our YSO selection criteria and partly because some came from the separately selected targets of Cody et al. The K14 scheme aggessively selects against objects likely to have fake detections in the WISE catalog, in particular in WISE band 4, which hinders its ability to find objects that have infrared excess only in the longest wavelength WISE band.
As seen in Figure 5, at color there is a dearth of infrared-selected YSO candidates. Yet some of these objects are moderate H emitters. At color there are a large number of infrared-selected YSO candidates, but still a few objects not selected that are moderate H emitters, and conversely some objects that are selected by K14 but do not exhibit strong H emission (those with small equivalent widths).
In Table 2 we present a summary of the properties of objects not selected under K14 but for which we have spectra. We list first the total number of spectra that do not match to a candidate WISE YSO, then the number that exhibit H or Ca II 8542 in emission above our threshold equivalent width values (). We then give the number that have red infrared colors, either , or excess color (). Some of these objects not selected under the K14 scheme have weak or no excess in WISE bands 1 and 2: which makes them candidate transition disk objects, that is, stars with cleared out or depleted inner regions. The number of these is given in Table 2 as . Of the full sample of spectra that do not match K14 WISE YSO candidates, 24/107 (22%) show spectroscopic signs of youth in H or Ca II 8542.
| Field | Total | N(Young) | N(excess) | N(TD-like) |
|---|---|---|---|---|
| Ori | 55 | 10 | 35 | 22 |
| Ori | 52 | 15 | 6 | 0 |
Note. — TD-like means ‘transition-disk’ like, as discussed in the text.
7.4 Contaminants: Spatial Distribution and Colors
Spectra marked in Figure 6 that appear to be those of AGNs or quasars in the Ori field are a result of the overlap in WISE color space of these extragalactic sources with protostars and the reddest Class II sources. These objects escape elimination because of their brightness in .
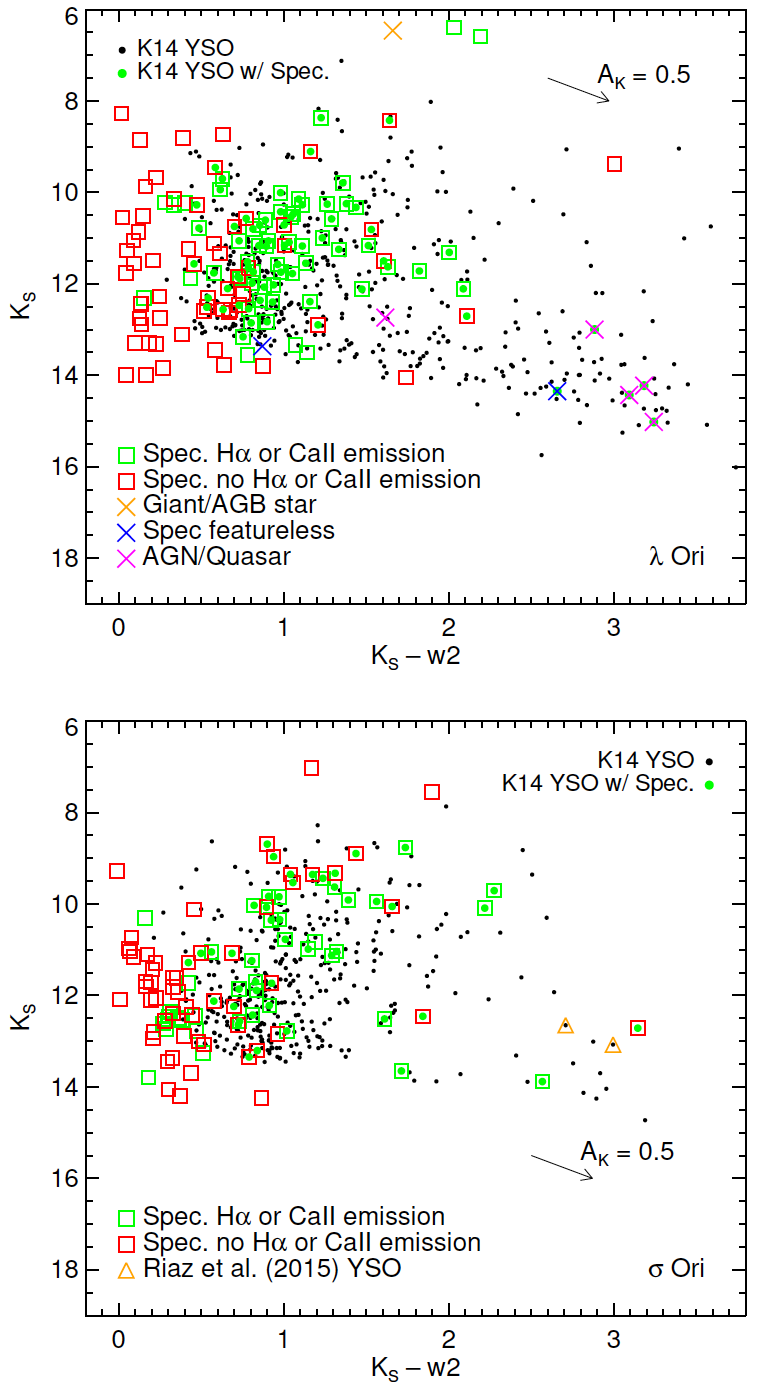
In the Orionis field, of the K14 YSO candidates with spectral follow-up, four were found to resemble those of extragalactic objects, whether AGNs or other galaxies. One K14 Class I candidate object was found to be a known quasar in a SIMBAD cross-match. One object appeared to have a featureless but blue spectrum. In Figure 7 we show a color-magnitude diagram summarizing the results of the overlap between the WISE photometric YSO selection scheme and our spectral follow-up program. In the panel for Ori, we also show the location of the two YSOs studied by Riaz et al. (2015).
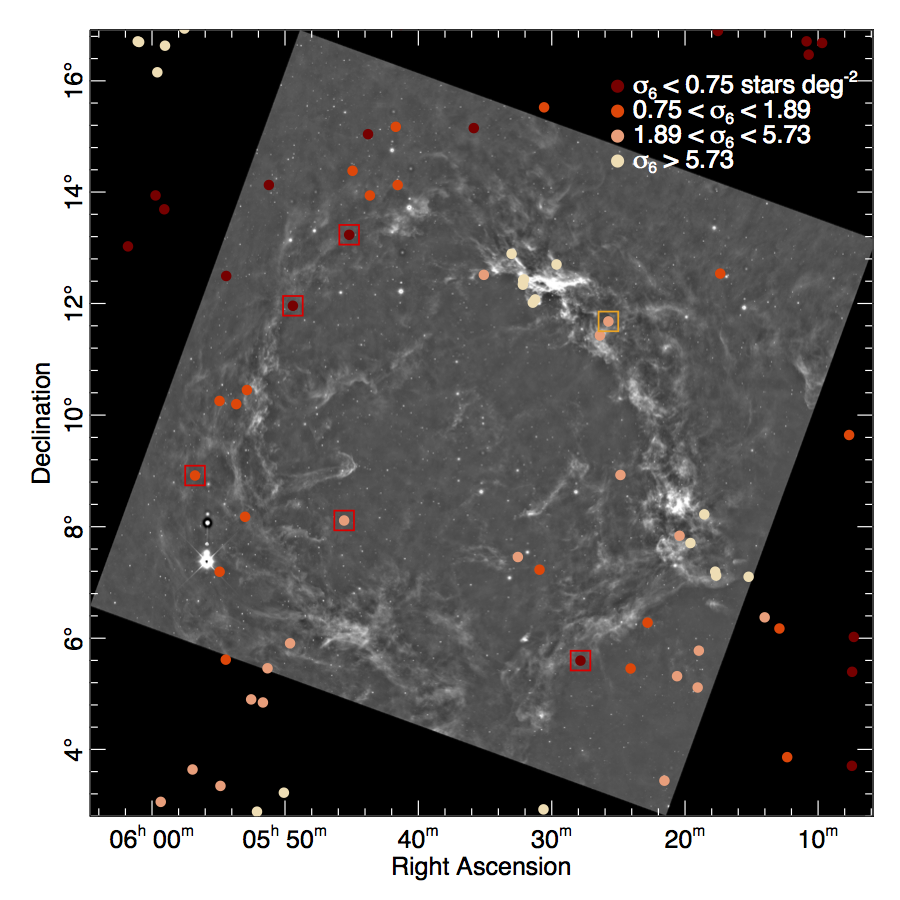
The extragalactic spectra were found amongst the protostar candidates in the Orionis field and in general were found in regions of low YSO surface density. In Figure 8 we show the distribution of protostar candidate sources color-coded by their projected angular space density , divided into quartiles of apparent space density. We compute by finding the distance to each object’s 6th nearest neighbor in the complete YSO catalog (Class II, transition disk, as well as protostars) and following the prescription of Casertano & Hut (1985). The quartiles are as follows—the lowest 25% of protostars have 0.75 stars per square degree, the 2nd quartile 0.751.89 stars per square degree, 3rd quartile 1.895.73 stars per square degree and the 4th quartile have 5.73 stars per square degree, color-coded from dark to light red. In the same figure we overlay the location of the objects whose spectra (or SIMBAD types) were extragalactic or otherwise non-stellar.
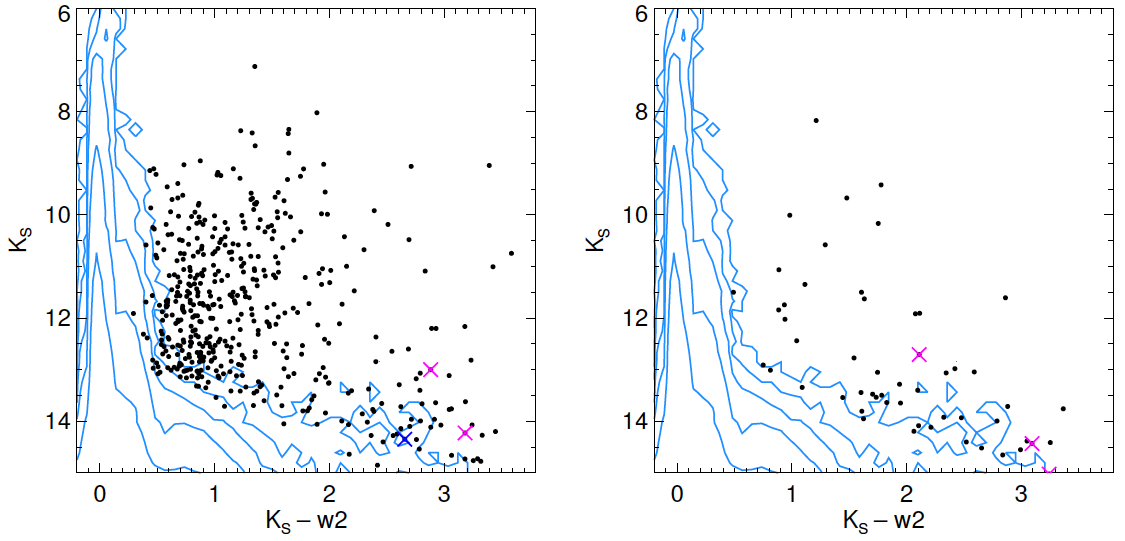
The colors of low density YSO candidates also show they may be largely dominated by extragalactic contaminants. In Figure 9 we show color-magnitude diagrams of all WISE YSO candidates above and below apparent density =0.75 stars per square degree. We also show for comparison a contour representation of the color-magnitude distribution of stars within of the North and South Galactic poles (requiring signal to noise 5, and uncertainty ). The plot of YSO candidates at low spatial density shows a relative increase in the quantity of sources with 4 and 12.5, similar to the region in color-magnitude space seen in the Galactic pole reference field data. This location is also where the objects found in the Galactic pole reference fields are found. This trend fits the expectation that the majority of stars are born in clusters, while extragalactic contaminants should be found in a more uniform distribution.
Koenig & Leisawitz (2014) estimated a contamination rate by extragalactic sources by randomly, repeatedly placing an appropriate number density of AllWISE catalog objects, drawn from a patch of sky away from the Galactic Plane, behind the 2D extinction map of Schlegel et al. (1998) for their Outer Galaxy test field and finding the average number of these that would be selected as YSO candidates by their scheme. Using the numbers from their Table 12 and scaling for the area of our Orion fields, we can estimate that 41 of the 77 Class I candidates and 32 of the 452 Class II candidates in Ori may be extragalactic contaminants. In Ori the numbers are 4 of 24 and 3 of 381 respectively. K14 estimated the Galactic contamination rate using the Galactic stellar populations model of Wainscoat et al. (1992) to predict an upper limit to the number density of non-YSOs that would appear in their test field in the same infrared magnitude and color ranges as YSOs in their scheme. We estimate that 28 of the Class I candidates and 93 of the Class II candidates in Ori may be Galactic contaminants and in Ori, 3 Class I and 9 Class II’s respectively may be Galactic contaminants. Our spectroscopic sample in Ori confirms none of the 6 Class I sources observed and 40 of the 64 Class II’s as young stars on the basis of H or Ca II 8542 emission line strength. Our spectroscopic sample in Ori (together with the samples of Cody et al. and Riaz et al.) confirms 3 of the 4 Class I sources observed and 26 of the 46 Class II’s as young stars in the same way. The Class I success rates rate and K14 predicted contamination rates appear to be consistent for the two fields. For the Class II sources, we confirm only the smaller subset of our candidates that possess H or Ca II 8542 in emission, and miss out on those objects that may have Lithium in absorption. A more precise test of the contamination rate predictions would require a measurement of the Lithium absorption line strength and a larger spectroscopic sample.
The analysis of Koenig & Leisawitz (2014) showed that the YSO candidate lists generated by their selection scheme were likely contaminated at a rate of roughly 173 extragalactic sources and at most 290 Galactic sources in their 480 square degree test field in the Outer Galaxy, or 0.36 sources deg-2 and 0.6 deg-2 respectively. These estimates predict 72 extragalactic and 121 Galactic sources contaminating the Orionis WISE YSO list and 7 and 12 sources in the Orionis list. The number of extragalactic contaminants was estimated in K14 by randomly, repeatedly placing an appropriate number density of AllWISE catalog objects, drawn from a patch of sky away from the Galactic Plane, behind the 2D extinction map of Schlegel et al. (1998) and finding the average number of these that would be selected as YSO candidates by the K14 scheme. The Galactic contamination rate was estimated by using the Galactic stellar populations model of Wainscoat et al. (1992) to predict an upper limit to number density of non-YSOs that would appear in that part of the sky in the same infrared magnitude and color ranges as YSOs in the K14 scheme. Using the spectroscopic data we have for the two fields combined (including the samples of Cody et al. and Riaz et al.), for those sources selected by K14 as Class II YSOs, we find 66 out of 110 objects followed up with spectra show either H or Ca II 8542 in emission. For the Class I sources, 3 out 10 objects show either H or Ca II 8542 in emission and we find 6 likely extragalactic contaminants, whether AGNs, quasars or featureless spectra. The total predicted contamination rate using the estimation of K14 above is 22% for the two fields combined. This rate appears low for the Class I sources, albeit from a small sample. The success rate of confirmed Class II candidates in these fields appears low as well; however, the absence of lithium absorption equivalent width measurements for these objects means there may be more young stars within this sample than we can ascertain from emission lines alone.
We note that Assef et al. (2013) quote a true AGN (dusty quasar) surface density of 62 per square degree, based on the simple selection criteria and in high latitude fields. This density of objects is much higher than the general density of all YSO candidates in the two Orion fields in this paper. In Ori the median local space density is 33 deg-2, while in Ori it is 9.5 deg-2. The AGN surface density of Assef et al. (2013) is also higher than the predictions of Koenig & Leisawitz (2014) for the extragalactic contamination rate. K14 estimated that their YSO candidate list was likely contaminated by approximately 173 extragalactic sources in their 480 square degree test field in the Outer Galaxy, or 0.36 sources deg-2. The high surface density of AGNs found by Assef et al. (2013) is largely due to their deeper survey in . Our YSO candidate sample is entirely brighter than , resulting from a cut in introduced in the K14 selection scheme specifically to try to minimize the number of AGNs included in the YSO candidate sample. The extragalactic objects in our spectroscopic sample are simply the bright tail of the galaxy population. In general, a , or magnitude upper limit is a critical criterion for avoiding extragalactic objects in a spectroscopic survey.
7.5 Ancillary Information on Candidates
Tables 3 and 4 present the entire WISE-2MASS derived catalogs of YSO candidates for the and Orionis fields respectively. We give the AllWISE catalog designation, coordinates, 2MASS and WISE photometry, source YSO class determined by the K14 scheme and the computed SED slope . We list the equivalent width measurements in the H and Ca II 8542 Å lines and spectral types where available from our spectra.
As a final step in vetting the list of mid-infrared selected YSO candidates, we consulted Palomar DSS and SDSS images to determine whether sources could be readily identified as galaxies, and also SIMBAD333http://simbad.u-strasbg.fr for previous information in the literature regarding possible status as a contaminant or a young star. Based on this information we have designated sources in Tables 3 and 4 with a ”y” (yes) or ”m” (maybe) or ”n” (no) to indicate the likelihood of membership in the Orion star forming region. Where spectral types were available in the literature we have included these in the tables and noted the specific reference in the final column.
In Ori, of 545 K14-selected candidates, 349 have no additional membership information from either the literature or our spectra. Of the 196 with supplemental information beyond just the photometry, we designate 149 as probable members (including 50 from our spectra) and 26 (including 17 from our spectra) as possible members for a confirmation rate of 76–89%. In Ori, of 418 K14-selected candidates, 147 have no additional membership information from either the literature or our spectra. Of the 271 with supplemental information, 233 are probable members (including 38 from our spectra) and 33 (including 6 from our spectra) are possible members, resulting in a confirmation rate of 86–98%. Only 20 sources in Ori and 4 in Ori are ruled out as galaxies or evolved stars.
8 Final YSO Census
8.1 Completeness
A summary of the number of YSO candidates found using the K14 scheme is presented in Table 1. Assuming a 400 pc distance, the limit of the selected YSO candidates illustrated in Figure 7 corresponds at an age of 1 Myr to a mass of 0.05 , with the mass limit increasing as the stars get older (about 0.15 at 10 Myr and 0.5 at 1 Gyr). In the presence of even modest extinction, we should be sensitive to the vast majority of young star candidates having infrared excess.
To assess the completeness of the K14-derived YSO sample, we take as a comparison sample the updated list of young stars found in nearby star forming regions from the Cores to Disks (c2d) survey produced by Hsieh & Lai (2013). We take their Spitzer photometric catalog, classify their young stars with the scheme of Gutermuth et al. (2009) and produce lists of Class I, II and transition disk young stars. We then search for that subset of objects in the AllWISE catalog and classify them following K14. At an apparent magnitude of =13.25 (10.3) the retrieval rate of Spitzer Class I or II YSOs by WISE is down to 50% (90%). An apparent magnitude of =13.25 converts to a mass limit of 0.1 M☉ (1.4 M☉) for an age between 3-5 Myr, using the stellar evolution models of Siess et al. (2000), assuming a distance of 400 pc and zero extinction.
8.2 YSO Spatial Distribution
In Figure 2, we show the distribution on the sky of YSOs found using the scheme of Koenig & Leisawitz (2014). Figure 4 shows the distribution of the spectra we acquired for this paper.
We note in Figure 9 that not all of the low density YSOs are contaminants. Several YSO candidates in the right panel have and 0.82, a locus that is not a feature of the reference field color-magnitude distribution. These are likely young stars that either have drifted away from their birth clusters or that formed in relative isolation.
We assess the clustering properties of the YSO candidates in Orion by constructing a minimal spanning tree from the source distribution. An MST is defined as the network of lines, or branches, that connects a set of points together such that the total length of the branches is minimized and there are no closed loops. We follow the methodology of Gutermuth et al. (2009) to identify a branch length cut off that separates groups or clusters from the low density background.
We fit two line segments to the cumulative distribution function of MST branch lengths: a steep-sloped segment at short spacings and a shallow-sloped segment at long spacings. We then adopt the MST branch length of the intersection point between the two lines as the critical cutting length. For the purposes of this analysis, we define a cluster as a group of five or more points all with branch lengths shorter than the cutoff. We run this analysis on both regions, using the complete YSO candidate lists and show the resulting clusters in Figure 10. In Ori, 65% of the YSO candidates belong to MST-identified groups of 5 or more members, while in Ori the fraction is 69%.
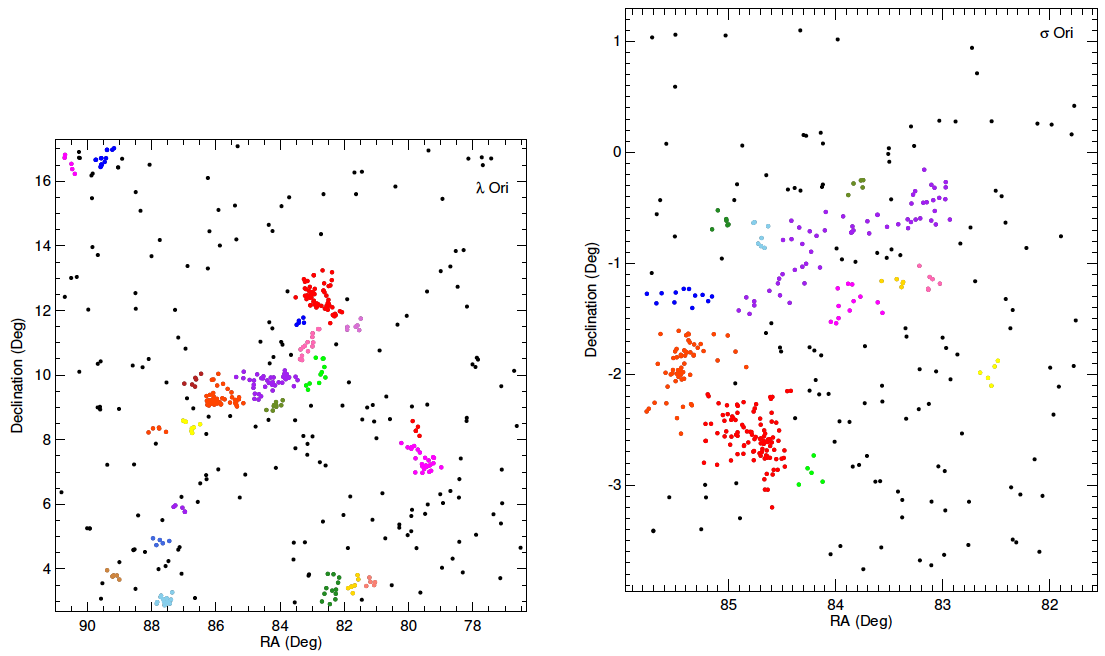
In the right panel, showing the Ori region, the MST analysis picks out several stellar aggregates away from the Ori ring. To the extreme north-east (RA , Dec ), it identifies a YSO cluster associated with the more distant G192.16 H ii region. Along the southern part of the panel, small groups near to L1617 are seen (RA , Dec ), as well as the northern edge of the larger 25 Ori/Orion OB1a cluster (81 RA 83, Dec ). Within the Orionis ring our catalog of YSO candidates resides in clusters around the head of the B35 pillar (85 RA , 8Dec ) and around B30 (RA 7, Dec 5). In between these groups the MST algorithm divides the YSOs into small groups around the central Ori cluster (purple, pink and green groups). The majority of the ring of emission seen in WISE band 3 does not appear to possess a large quantity of young stars with infrared excess, however small clusters of Class II and I sources are coincident with L1588 and L1589 (magenta and red points, 79 RA , 5Dec ).
In the right panel showing the Ori region, the Ori cluster itself is identified by the MST algorithm (red points, centered on RA 7, Dec 7), as are the groups associated with NGC 2024 and 2023 (orange points, RA, Dec 5). The more distributed population of YSOs to the north and west of these regions (83RA , Dec 2) is also picked out, but broken up by the MST algorithm into several groups. We are uncertain about the nature of the remaining, small groups in the right panel of the figure without further spectroscopic surveys to probe to lower masses and find and young stars without disk excess emission.
Using our spectroscopic sample, we confirm 12 YSO candidates outside MST-defined groups in Ori and 1 outside the MST-defined groups in Ori. The lowest local stellar density around such objects, as characterized by (see Section 7.4), is 0.5 stars per square degree in Ori and 18.4 stars per square degree in Ori. This diffuse population of YSOs could be made up of stars that have dispersed from where they formed. As with the remainder of the young stars we identify though, a complete census of the mass function and the non-disked population is necessary to determine the exact nature of these objects.
9 Discussion
9.1 The Wide-Field distribution of YSOs in and Ori
While WISE lacks the sensitivity and resolution to match the depth of previous YSO surveys in Orion, Figures 2, 3 and 4 demonstrate its ability to capture the basic distribution of star formation on large areal scales.
9.1.1 Ori region
In and around Orionis itself, several extensive and deep surveys of YSOs have focused on mapping out the low mass end of the initial mass function, resulting in the large number of literature sources marked in Fig. 3. In the brightest region of nebular emission in the field, the Spitzer survey of Megeath et al. (2012) also identifies a much greater number of YSO candidates than our present WISE survey, roughly 370 YSOs deg-2, compared to 84 YSOs deg-2 from WISE in that location, or a factor 4 greater. In the remaining northern and western parts of the region, the spectroscopic study of Briceño et al. (2005) and our YSO candidates comprise a more diffuse population of YSOs. As can be seen in Figure 2, the WISE YSO candidates are mostly Class II or transition disk objects. The mismatch between the literature YSOs and our sample in this part of the field is due to the ability of Briceño et al. to find weak-line T Tauri stars (WTTs) that lack significant infrared excess which our color-criteria cannot easily pick out. We find only 2 of the 105 objects noted by Briceño et al. as WTT objects in this region, but 21 of their 33 ‘CTT’ objects in a 2 cross-match between catalogs. As discussed by Briceño et al., these northern YSOs are a part of the Orion OB1b association. We do not note an obvious preferential association of our YSO candidates in this area with the cloud boundary/the bright rim traced by emission however.
9.1.2 Ori region
In Ori our catalog of YSO candidates traces the previously observed distribution of YSOs that extends from the head of the B35 pillar across to B30, passing through the central Ori cluster. Our catalog captures a subset of the YSO distribution mapped out by the Spitzer survey of Hernández et al. (2010) around the central Ori cluster. We also miss a fraction of the YSOs documented by the works of Dolan & Mathieu that lack strong infrared excess. The small cluster associated with L1588 and L1589 appears to be new to this study. Previous work in this area has focused on the several Herbig-Haro objects and outflows (HH114, 115, 328 and 329) concentrated around IRAS 05155+0707 (see for example Connelley et al., 2007). Our catalog also finds a low density distribution of candidate Class I sources to the east and north-east of Orionis, but still within the greyscale mosaic area in Figure 2. Two of these objects have already been found to be background AGNs (see Section 7.4). As noted by Koenig & Leisawitz (2014), the WISE Class I candidate selection is known to be the most highly contaminated by extragalactic sources. Because of their lack of obvious association with stellar groupings or bright nebular emission, we suspect that most of this group are likely background contaminants.
10 Conclusions
We have conducted a sensitive search down to the hydrogen burning limit for unextincted stars using WISE over 200 square degrees around Lambda Orionis and 20 square degrees around Sigma Orionis. We used the methodology of Koenig & Leisawitz (2014) that builds on the heritage of the work of Koenig et al. (2012), to identify a sample of 544 stars in Lambda and 418 stars in Sigma that are candidate YSOs.
We conducted optical spectroscopic followup of 14% of these candidates in Lambda and 11% in Sigma Orionis. On the basis of strong emission in the H or Ca II 8542 Å lines, we confirm 41 and 27 young stars respectively in the two regions. More reliable spectroscopic data covering the Li I 6707 Å line would enable us to confirm or reject a greater number of the WISE selected YSO candidates. Based on our followup spectroscopy for some candidates and the existing literature for others, we found that 80% of the K14-selected candidates are probable or likely members of the Orion star forming region.
We improved our understanding of the yield from the photometric selection criteria in various ranges of color-color and color-magnitude space, in particular WISE sources with mag and between 10–12 mag were most likely to show spectroscopic signs of youth. WISE sources with mag and were often AGNs when followed up spectroscopically.
While we improved the census of young stars in the and Ori regions, the presence of several strong Ca II and/or H emitters among spectra obtained of stars not selected via the K14 methods suggests that the criteria are—though robust and reliable—not 100% complete in finding the young stars that are present.
The population of newly identified and candidate YSOs roughly traces the known areas of active star formation, but we identify a few new ‘hot spots’ of activity near Lynds 1588 and 1589. We confirm the more dispersed population of YSOs seen in the northern half of the H ii region bubble around and Ori surveyed in Briceño et al. (2005). External to the Orionis ring we note clusters of YSO candidates around the L1617 cloud and the more distant G192.163.82 H ii region.
We present a minimal spanning tree analysis of the two regions to identify stellar groupings. We find that roughly two-thirds of the YSO candidates in each region belong to groups of 5 or more members. Given the likely rate of contamination of the YSO candidate sample by galaxies and older stars, as described in Section 7.4, we suspect the fraction of YSOs in clusters to be higher than this value. The population of stars selected by WISE outside the MST groupings does contain spectroscopically verified YSOs however, with a local stellar density as low as 0.5 stars per square degree.
| WISE name | Coordinates | J | uJ | H | uH | K | uK | w1 | uw1 | w2 | uw2 | w3 | uw3 | uw4 | w4 | Class | EW(H) | EW(Ca II) 8542 | Member | Source Type | Reference | ||
|---|---|---|---|---|---|---|---|---|---|---|---|---|---|---|---|---|---|---|---|---|---|---|---|
| RA (deg) | Decl. (deg) | (mag) | (mag) | (mag) | (mag) | (mag) | (mag) | (mag) | (mag) | (mag) | (mag) | (mag) | (mag) | (mag) | (mag) | Å | Å | ||||||
| J052701.95013053.3 | 81.758142 | 1.514806 | 10.143 | 0.023 | 9.587 | 0.022 | 9.295 | 0.023 | 8.836 | 0.023 | 8.515 | 0.020 | 6.379 | 0.016 | 4.243 | 0.029 | II | 0.90 | |||||
| J052705.47+002507.6 | 81.772798 | 0.418795 | 9.523 | 0.027 | 9.132 | 0.023 | 8.630 | 0.021 | 8.461 | 0.023 | 8.065 | 0.020 | 3.810 | 0.014 | 1.109 | 0.012 | II | 0.24 | y | HAeBe;B9 | HD 290409;Vieira et al. (2003) | ||
| J052706.54015530.7 | 81.777261 | 1.925207 | 13.562 | 0.022 | 12.930 | 0.022 | 12.567 | 0.024 | 12.252 | 0.023 | 11.877 | 0.022 | 10.490 | 0.091 | 8.202 | 0.266 | II | 1.75 | |||||
| J052711.25+000941.8 | 81.796915 | 0.161632 | 14.110 | 0.070 | 13.520 | 0.084 | 13.197 | 0.077 | 12.815 | 0.041 | 12.556 | 0.042 | 10.340 | 0.099 | 8.089 | 0.425 | II | 1.32 | |||||
| J052735.17004523.6 | 81.896577 | 0.756557 | 11.278 | 0.022 | 10.444 | 0.021 | 9.942 | 0.021 | 9.081 | 0.023 | 8.678 | 0.020 | 7.066 | 0.016 | 4.567 | 0.029 | II | 0.78 | y | K5 | Briceño et al. (2005) | ||
Note. — This Table is published in its entirety in the electronic edition of the Astrophysical Journal. A portion is shown here for guidance regarding its form and content. Right ascension and Declination coordinates are J2000.0.
| WISE name | Coordinates | J | uJ | H | uH | K | uK | w1 | uw1 | w2 | uw2 | w3 | uw3 | uw4 | w4 | Class | EW(H) | EW(Ca II) 8542 | Member | Source Type | Reference | ||
|---|---|---|---|---|---|---|---|---|---|---|---|---|---|---|---|---|---|---|---|---|---|---|---|
| RA (deg) | Decl. (deg) | (mag) | (mag) | (mag) | (mag) | (mag) | (mag) | (mag) | (mag) | (mag) | (mag) | (mag) | (mag) | (mag) | (mag) | Å | Å | ||||||
| J050603.60+043923.0 | 76.515035 | 4.656403 | 15.733 | 0.115 | 15.141 | 0.132 | 14.412 | 0.116 | 12.783 | 0.027 | 11.160 | 0.023 | 7.062 | 0.017 | 4.279 | 0.028 | I | 1.08 | |||||
| J050631.77+082532.7 | 76.632415 | 8.425772 | 13.407 | 0.025 | 12.794 | 0.033 | 12.439 | 0.027 | 12.054 | 0.024 | 11.398 | 0.022 | 9.501 | 0.041 | 8.494 | 0.427 | II | -1.27 | |||||
| J050651.72+100756.5 | 76.715537 | 10.132371 | 13.440 | 0.022 | 13.089 | 0.031 | 13.010 | 0.029 | 12.714 | 0.024 | 12.198 | 0.024 | 9.557 | 0.045 | 7.324 | 0.126 | II | -0.66 | |||||
| J050821.22+060202.0 | 77.088449 | 6.033907 | 15.511 | 0.077 | 14.644 | 0.080 | 13.922 | 0.062 | 12.677 | 0.024 | 11.599 | 0.022 | 7.918 | 0.021 | 5.122 | 0.034 | I | 0.56 | |||||
| J050823.77+070431.2 | 77.099072 | 7.075350 | 14.944 | 0.050 | 14.299 | 0.056 | 13.535 | 0.047 | 12.500 | 0.025 | 11.801 | 0.022 | 9.089 | 0.036 | 6.256 | 0.064 | II | -0.04 | |||||
Note. — This Table is published in its entirety in the electronic edition of the Astrophysical Journal. A portion is shown here for guidance regarding its form and content. Right ascension and Declination coordinates are J2000.0.
References
- Alecian et al. (2013) Alecian, E., Wade, G. A., Catala, C., et al. 2013, MNRAS, 429, 1001
- Allen & Strom (1995) Allen, L. E., & Strom, K. M. 1995, AJ, 109, 1379
- Assef et al. (2013) Assef, R. J., Stern, D., Kochanek, C. S., et al. 2013, ApJ, 772, 26
- Bally (2010) Bally, J. 2010, Nature, 466, 928
- Barrado y Navascués et al. (2004) Barrado y Navascués, D., Stauffer, J. R., Bouvier, J., Jayawardhana, R., & Cuillandre, J.-C. 2004, ApJ, 610, 1064
- Bayo et al. (2011) Bayo, A., Barrado, D., Stauffer, J., et al. 2011, A&A, 536, A63
- Béjar et al. (2011) Béjar, V. J. S., Zapatero Osorio, M. R., Rebolo, R., et al. 2011, ApJ, 743, 64
- Briceño et al. (2005) Briceño, C., Calvet, N., Hernández, J., et al. 2005, AJ, 129, 907
- Briceno (2008) Briceno, C. 2008, Handbook of Star Forming Regions, Volume I, 838
- Caballero (2008) Caballero, J. A. 2008, A&A, 478, 667
- Caballero & Solano (2008) Caballero, J. A., & Solano, E. 2008, A&A, 485, 931
- Caballero et al. (2008) Caballero, J. A., Valdivielso, L., Martín, E. L., et al. 2008, A&A, 491, 515
- Caballero et al. (2012) Caballero, J. A., Cabrera-Lavers, A., García-Álvarez, D., & Pascual, S. 2012, A&A, 546, A59
- Carpenter et al. (1993) Carpenter, J. M., Snell, R. L., Schloerb, F. P., & Skrutskie, M. F. 1993, ApJ, 407, 657
- Carpenter et al. (2009) Carpenter, J. M., Mamajek, E. E., Hillenbrand, L. A., & Meyer, M. R. 2009, ApJ, 705, 1646
- Casertano & Hut (1985) Casertano, S., & Hut, P. 1985, ApJ, 298, 80
- Cieza et al. (2012) Cieza, L. A., Schreiber, M. R., Romero, G. A., et al. 2012, ApJ, 750, 157
- Cody (2012) Cody, A. M. 2012, Ph.D. Thesis, California Institute of Technology
- Cody & Hillenbrand (2010) Cody, A. M., & Hillenbrand, L. A. 2010, ApJS, 191, 389
- Cody & Hillenbrand (2014) Cody, A. M., & Hillenbrand, L. A. 2014, ApJ, 796, 129
- Connelley et al. (2007) Connelley, M. S., Reipurth, B., & Tokunaga, A. T. 2007, AJ, 133, 1528
- Connelley & Greene (2010) Connelley, M. S., & Greene, T. P. 2010, AJ, 140, 1214
- Cunha & Smith (1996) Cunha, K., & Smith, V. V. 1996, A&A, 309, 892
- Dolan & Mathieu (1999) Dolan, C. J., & Mathieu, R. D. 1999, AJ, 118, 2409
- Dolan & Mathieu (2001) Dolan, C. J., & Mathieu, R. D. 2001, AJ, 121, 2124
- Dolan & Mathieu (2002) Dolan, C. J., & Mathieu, R. D. 2002, AJ, 123, 387
- Gray & Corbally (1998) Gray, R. O., & Corbally, C. J. 1998, AJ, 116, 2530
- Greene et al. (1994) Greene, T. P., Wilking, B. A., André, P., Young, E. T., & Lada, C. J. 1994, ApJ, 434, 614
- Gutermuth et al. (2009) Gutermuth, R. A., Megeath, S. T., Myers, P. C., et al. 2009, ApJS, 184, 18
- Herbig & Bell (1988) Herbig, G. H., & Bell, K. 1988, LicOB, 1111, 90
- Hernández et al. (2010) Hernández, J., Morales-Calderon, M., Calvet, N., et al. 2010, ApJ, 722, 1226
- Hsieh & Lai (2013) Hsieh, T.-H., & Lai, S.-P. 2013, ApJS, 205, 5
- Jacoby et al. (1984) Jacoby, G. H., Hunter, D. A., & Christian, C. A. 1984, ApJS, 56, 257
- Kajdič et al. (2012) Kajdič, P., Reipurth, B., Raga, A. C., Bally, J., & Walawender, J. 2012, AJ, 143, 106
- Koenig et al. (2012) Koenig, X. P., Leisawitz, D. T., Benford, D. J., et al. 2012, ApJ, 744, 130
- Koenig & Leisawitz (2014) Koenig, X. P., & Leisawitz, D. T. 2014, ApJ, 791, 131
- Kwok et al. (1997) Kwok, S., Volk, K., & Bidelman, W. P. 1997, ApJS, 112, 557
- Lang et al. (2000) Lang, W. J., Masheder, M. R. W., Dame, T. M., & Thaddeus, P. 2000, A&A, 357, 1001
- Lee & Chen (2007) Lee, H.-T., & Chen, W. P. 2007, ApJ, 657, 884
- Lodieu et al. (2009) Lodieu, N., Zapatero Osorio, M. R., Rebolo, R., Martín, E. L., & Hambly, N. C. 2009, A&A, 505, 1115
- Lombardi et al. (2011) Lombardi, M., Alves, J., & Lada, C. J. 2011, A&A, 535, A16
- Luhman et al. (2008) Luhman, K. L., Hernández, J., Downes, J. J., Hartmann, L., & Briceño, C. 2008, ApJ, 688, 362
- Luhman & Mamajek (2012) Luhman, K. L., & Mamajek, E. E. 2012, ApJ, 758, 31
- Manoj et al. (2006) Manoj, P., Bhatt, H. C., Maheswar, G., & Muneer, S. 2006, ApJ, 653, 657
- Mathieu (2008) Mathieu, R. D. 2008, Handbook of Star Forming Regions, Volume I, 757
- Megeath et al. (2012) Megeath, S. T., Gutermuth, R., Muzerolle, J., et al. 2012, AJ, 144, 192
- Nesterov et al. (1995) Nesterov, V. V., Kuzmin, A. V., Ashimbaeva, N. T., et al. 1995, A&AS, 110, 367
- Ochsendorf et al. (2014) Ochsendorf, B. B., Cox, N. L. J., Krijt, S., et al. 2014, A&A, 563, AA65
- Oke & Gunn (1982) Oke, J. B., & Gunn, J. E. 1982, PASP, 94, 586
- Peña Ramírez et al. (2012) Peña Ramírez, K., Béjar, V. J. S., Zapatero Osorio, M. R., Petr-Gotzens, M. G., & Martín, E. L. 2012, ApJ, 754, 30
- Rebull et al. (2011) Rebull, L. M., Koenig, X. P., Padgett, D. L., et al. 2011, ApJS, 196, 4
- Reid et al. (2007) Reid, I. N., Cruz, K. L., & Allen, P. R. 2007, AJ, 133, 2825
- Riaz et al. (2015) Riaz, B., Thompson, M., Whelan, E. T., & Lodieu, N. 2015, MNRAS, 446, 2550
- Rieke & Lebofsky (1985) Rieke, G. H., & Lebofsky, M. J. 1985, ApJ, 288, 618
- Rigliaco et al. (2012) Rigliaco, E., Natta, A., Testi, L., et al. 2012, A&A, 548, A56
- Rivinius et al. (2013) Rivinius, T., Carciofi, A. C., & Martayan, C. 2013, A&A Rev., 21, 69
- Rizzuto et al. (2012) Rizzuto, A. C., Ireland, M. J., & Zucker, D. B. 2012, MNRAS, 421, L97
- Sacco et al. (2008) Sacco, G. G., Franciosini, E., Randich, S., & Pallavicini, R. 2008, A&A, 488, 167
- Schlegel et al. (1998) Schlegel, D. J., Finkbeiner, D. P., & Davis, M. 1998, ApJ, 500, 525
- Sherry et al. (2008) Sherry, W. H., Walter, F. M., Wolk, S. J., & Adams, N. R. 2008, AJ, 135, 1616
- Shiozaki et al. (2011) Shiozaki, S., Imai, H., Tafoya, D., et al. 2011, PASJ, 63, 1219
- Skiff (2014) Skiff, B. A. 2014, VizieR Online Data Catalog, 1, 2023
- Siess et al. (2000) Siess, L., Dufour, E., & Forestini, M. 2000, A&A, 358, 593
- Strom et al. (1989) Strom, K. M., Strom, S. E., Edwards, S., Cabrit, S., & Skrutskie, M. F. 1989, AJ, 97, 1451
- Suárez et al. (2006) Suárez, O., García-Lario, P., Manchado, A., et al. 2006, A&A, 458, 173
- Vieira et al. (2003) Vieira, S. L. A., Corradi, W. J. B., Alencar, S. H. P., et al. 2003, AJ, 126, 2971
- Wainscoat et al. (1992) Wainscoat, R. J., Cohen, M., Volk, K., Walker, H. J., & Schwartz, D. E. 1992, ApJS, 83, 111
- Walter et al. (2008) Walter, F. M., Sherry, W. H., Wolk, S. J., & Adams, N. R. 2008, Handbook of Star Forming Regions, Volume I, 732
- West et al. (2011) West, A. A., Morgan, D. P., Bochanski, J. J., et al. 2011, AJ, 141, 97
- Zapatero Osorio et al. (2002) Zapatero Osorio, M. R., Béjar, V. J. S., Pavlenko, Y., et al. 2002, A&A, 384, 937