Shell-like structures in our cosmic neighbourhood
Abstract
Context. Signatures of the processes in the early Universe are imprinted in the cosmic web. Some of them may define shell-like structures characterised by typical scales. Examples of such structures are shell-like systems of galaxies, which are interpreted as a signatures of the baryon acoustic oscillations.
Aims. We search for shell-like structures in the distribution of nearby rich clusters of galaxies drawn from the SDSS DR8.
Methods. We calculated the distance distributions between rich clusters of galaxies and groups and clusters of various richness, searched for the maxima in the distance distributions and selected candidates of shell-like structures. We analysed the space distribution of groups and clusters that form shell walls.
Results. We find six possible candidates of shell-like structures, in which galaxy clusters have the maximum in their distance distribution to other galaxy groups and clusters at a distance of about Mpc. Another, less probable maximum is found at a distance of about Mpc. The rich galaxy cluster A1795, which is the central cluster of the Bootes supercluster, has the highest maximum in the distance distribution of all other surrounding groups and clusters in our rich cluster sample. It lies at a distance of about Mpc. The structures of galaxy systems that cause this maximum form an almost complete shell of galaxy groups, clusters, and superclusters. The richest systems in the nearby universe, the Sloan Great Wall, the Corona Borealis supercluster, and the Ursa Major supercluster, are among them. The probability that we obtain maxima like this from random distributions is lower than 0.001.
Conclusions. Our results confirm that shell-like structures can be found in the distribution of nearby galaxies and their systems. The radii of the possible shells are larger than expected for a baryonic acoustic oscillations (BAO) shell ( Mpc versus Mpc), and they are determined by very rich galaxy clusters and superclusters. In contrast, BAO shells are barely seen in the galaxy distribution. We discuss possible consequences of these differences.
Key Words.:
large-scale structure of the Universe; Galaxies: clusters: general1 Introduction
One of the most remarkable achievements of contemporary cosmology is the discovery of the cosmic web – a complex hierarchical network of galaxy systems in which galaxies, galaxy groups, clusters, and superclusters form interconnected systems that are separated by voids of various sizes (Einasto et al. 1975; Jõeveer et al. 1977; Jõeveer & Einasto 1978; Gregory & Thompson 1978; Chincarini & Rood 1979; Kirshner et al. 1981; Zeldovich et al. 1982; Oort 1983; de Lapparent et al. 1986). A short review of the early studies of the cosmic web can be found in Einasto et al. (2011a). The properties of the cosmic web are determined by various processes – chaotic quantum fluctuations in the very early Universe, the oscillations of the hot baryon-dark-matter-radiation plasma before the recombination, and the growth of density perturbations that is due to gravitational instability after the recombination. These processes may be reflected in the geometrical pattern of galaxies and galaxy systems by characteristic scales.
As proposed by Kofman & Shandarin (1988), the skeleton of the cosmic web is fixed by processes during or just after the inflation. The positions of high-density peaks and voids do not change much during the cosmic evolution, only the amplitude of over- and underdensities grows with time (Bond et al. 1996; van de Weygaert & Schaap 2009; Suhhonenko et al. 2011, and references therein). The growth of density perturbations in the post-recombination era is quite well studied (see Peebles 1980; Springel et al. 2005; van de Weygaert & Schaap 2009; Einasto et al. 2011a, for details and references).
The physics of baryon acoustic oscillations in the hot plasma is also well understood – these oscillations were created by the interplay between the gravitational pull of dark matter and the pressure of the photon-electron plasma in the early universe (Peebles & Yu 1970). BAO measurements together with cosmic microwave background (CMB) observations provide important tools to constrain cosmological parameters and break degeneracies between them. Planck results (Planck Collaboration et al. 2015) of the CMB anisotropies have determined the scale of acoustic oscillations ( Mpc) with high accuracy, in agreement with several experimental BAO studies: SDSS (Eisenstein et al. 2005), 2dFGRS (Cole et al. 2005), WiggleZ (Blake et al. 2011), 6dF galaxy survey (Beutler et al. 2011), SDSS-DR7 (Padmanabhan et al. 2012), and BOSS-DR9 (Anderson et al. 2012). An overview of observable signatures of BAO in the galaxy distribution in the cosmic web can be found in Weinberg et al. (2013, and references therein).
Baryonic acoustic oscillations create weak shells in the distribution of galaxies. The signatures of BAO have typically been detected with a two-point correlation function (Eisenstein et al. 2005; Martínez et al. 2009; Weinberg et al. 2013), but other methods have also been proposed. Juszkiewicz et al. (2013) showed that the skewness of the cosmic density field contains an imprint of baryonic acoustic oscillations. Recently, Arnalte-Mur et al. (2012) proposed a new method for searching for BAO shells in the distribution of galaxies – a baolet analysis, which is a dedicated wavelet technique. BAO shells are shell-like systems of galaxies whose central density enhancement is surrounded by an underdense region and then higher density shell-like structures of galaxies. Arnalte-Mur et al. (2012) searched for BAO shells using LRGs (luminous red galaxies) as a centre candidate sample and the SDSS MAIN galaxy sample to trace the shells. They detected BAO shells in the distribution of galaxies.
Early studies of the cosmic web have shown the presence of giant voids of a scale of about Mpc in our cosmic neighbourhood (Jõeveer & Einasto 1978; Zeldovich et al. 1982). Einasto et al. (1994) showed the presence of an Mpc characteristic scale in the three-dimensional distribution of rich clusters and superclusters of galaxies. Over- and underdensity regions of Mpc and even Mpc size have been detected in the quasar distribution (Miller et al. 2004; Einasto et al. 2014).
Recently, Einasto et al. (2015, hereafter E2015) detected two peaks in the distance distribution of rich galaxy groups and clusters at Mpc and at Mpc around the Abell cluster A2142.
These results give rise to the question about the geometrical properties of the cosmic web, and, in particular, the characteristic scales of the structures in the cosmic web. In this paper we attempt to answer this question by searching for the presence of characteristic scales in the distance distribution between galaxy groups and clusters that are expressed by the presence of maxima in these distributions, which may be caused by the shell-like structures around rich clusters in our cosmic neighbourhood. We use the sample of nearby rich clusters as shell centre candidates and analyse the space distribution of groups and clusters of galaxies in their neighbourhood with the aim to find structures that resemble shells. The detection of these structures enables us to study the properties of these shells and objects by tracing them in detail.
In Sect. 2 we describe the data we used, in Sect. 3 we give the results. We discuss the results and draw conclusions in Sect. 4. At http://www.aai.ee/~maret/Shell.html we present an interactive 3D model showing the distribution of galaxy groups in the volume under study.
We assume the standard cosmological parameters: the Hubble parameter km s-1 Mpc-1, the matter density , and the dark energy density .
2 Data
Our galaxy sample is the MAIN sample of the 8th data release of the Sloan Digital Sky Survey (Aihara et al. 2011) with the apparent magnitudes , and the redshifts , in total 576493 galaxies. We corrected the redshifts of galaxies for the motion relative to the CMB and computed the co-moving distances (Martínez & Saar 2002) of galaxies. The absolute magnitudes of galaxies were determined in the -band () with the - corrections for the SDSS galaxies, calculated using the KCORRECT algorithm (Blanton & Roweis 2007). We also applied evolution corrections, using the luminosity evolution model of Blanton et al. (2003). The magnitudes correspond to the rest-frame at the redshift .
Groups of galaxies were determined using the friends-of-friends cluster analysis method introduced in cosmology by Turner & Gott (1976); Zeldovich et al. (1982). A galaxy belongs to a group of galaxies if this galaxy has at least one group member galaxy closer than a linking length. The aim in Tempel et al. (2012, 2014) was to find as many groups as possible while keeping their properties uniform with respect to distance. In a flux-limited sample the density of galaxies slowly decreases with distance. To take this selection effect properly into account when constructing a group catalogue from a flux-limited sample, the linking length was rescaled with distance, calibrating the scaling relation by observed groups. Therefore, the values of the linking length in physical coordinates in the group catalogue depend on the distance. In the redshift interval , used in our study (see below), these values are approximately Mpc. As a result, the largest sizes in the sky projection and the velocity dispersions of our groups are similar at all distances. Since our study is focused on rich groups of galaxies, it is important to note that with these values of the linking length, our groups do not include large sections of surrounding galaxy filaments or superclusters (see Tempel et al. 2014, for detailed discussion). The details of the data reduction and the description of the group catalogue can be found in Tempel et al. (2012, 2014). When compiling the group catalogue, various selection effects that might affect the catalogue were taken into account. In particular, the SDSS galaxy sample is incomplete because of fibre collisions - the smallest separation between spectroscopic fibres is 55”, and about 6% of galaxies in the SDSS are without observed spectra. Tempel et al. (2012, 2014) studied the effect of missing galaxies on a group catalogue and concluded that this mostly affects galaxy pairs. They estimated that approximately 8% of galaxy pairs may be missing from the catalogue. This does not affect our study, which is mainly focused on richer galaxy groups. We used the data of groups and clusters in the comoving distance interval 120 Mpc 340 Mpc (corresponding to the redshift range ) where the selection effects are the smallest (we discuss the selection effects in detail in Einasto et al. 2012a). As candidates of shell centres we chose data of groups with at least 50 member galaxies that were analysed previously in Einasto et al. (2012b, a). They correspond to rich galaxy clusters. This sample of 109 clusters includes all clusters from the SDSS DR8 with at least 50 member galaxies in this distance interval.
We calculated the distance distributions and radial densities from these rich clusters to other groups and clusters of different richness from richest clusters to poorest groups (galaxy pairs) in our catalogue and searched for a maxima in these distributions. These indicate the possible presence of shell-like structures in the galaxy distribution. To estimate the effect of the errors in distance distributions, we applied the following procedure. We determined the distance distributions by the kernel method, using the B3 box spline kernel (see e.g. Liivamägi et al. 2012) and selecting the kernel width as recommended by Silverman (1986). The kernel width depends on both the variance of the distance distribution and the number of groups, therefore we used different kernel widths for different richness classes, in the range of Mpc to Mpc. To determine the density distributions, we generated reference random point distributions (of 200000 points) for every richness class, following the SDSS mask and the radial selection function for groups of this class. The density distribution is the ratio of the observed and the reference distance distributions. We found bootstrap errors of distance and density distributions, using the smoothed bootstrap method (see, for example, Davison & Hinkley 1997). This is based on the idea of smoothing the observed integral probability distribution for bootstrap selection and is realised by selecting the observed points with replacement, as usual, and adding to their coordinates a random replacement with the probability distribution given by the kernel function used, but with a smaller width (we used half of the original width). We also applied a Kolmogorov-Smirnov test to compare different distance distributions. Errors of the distances between clusters are small, of the order of the cluster sizes (approximately Mpc), and their influence on the results of the statistical tests is negligible. With the Kolmogorov-Smirnov test we compared the integral distribution of the data without binning, applying an empirical cumulative distribution function to the data.
3 Results
3.1 Distances between rich clusters and groups
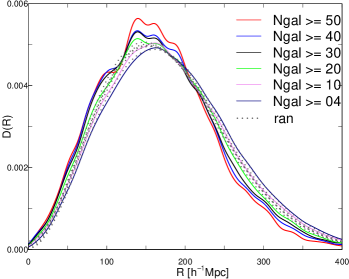
We calculated distances from rich clusters with at least 50 member galaxies to clusters and groups with (109), (176), (310), (583), (1972), (11084), and (45858) (we give the number of systems in parenthesis). Figure 1 shows the distribution of the distances from all rich clusters with at least 50 member galaxies together with distances from rich clusters to random points. All curves in Fig. 1 are normalised so that each integrates to . We looked for specific features in the distance distributions between groups. The main form of the distribution is caused by the shallowness of our sample (its thickness is only Mpc, while it is Mpc wide). Several wiggles seen in the distance distributions indicate possible density maxima around the clusters. One with the highest height is located at distance of Mpc, indicating an enhanced density of groups and clusters around rich clusters at this distance. The wiggles are seen in distributions of distances of rich clusters and clusters with 20 – 50 member galaxies and disappear from distributions if calculations include groups with 2 – 10 member galaxies. This suggests that possible structures with enhanced density are more clearly delineated by rich groups and clusters of galaxies. The Kolmogorov-Smirnov test, applied to the distance distributions in the distance interval of Mpc, confirmed that the differences in distributions of distances from rich clusters with at least 50 member galaxies to groups with 2 – 10 member galaxies are statistically highly significant, with a -value . Wiggles like this are not seen in the distance distributions to random points. As seen in Fig. 1, the distance distributions of random points and poor groups overlap, showing that these distributions are similar.
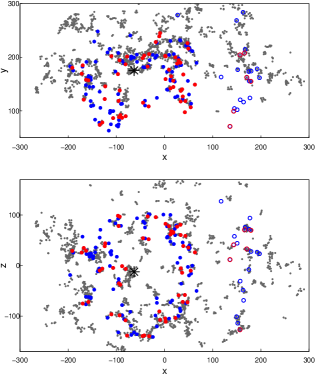
In Fig. 2 we plot the distribution of groups and clusters with at least four member galaxies in Cartesian coordinates defined as in Park et al. (2007) and in Liivamägi et al. (2012): , , and , where is the comoving distance, and and are the SDSS survey coordinates. In the SDSS, the survey coordinates form a spherical coordinate system, where corresponds to , corresponds to , and at , . Here the locations of all rich groups and clusters with at least 30 member galaxies are plotted, but to avoid strong projection effects, we show only those poor groups that are supercluster members. Rich clusters of galaxies with at least 50 members are plotted in red. This figure shows that many rich clusters are located at the -coordinate interval approximately Mpc, at which rich galaxy superclusters, including those belonging to the Sloan Great Wall, form three chains of superclusters, separated by voids of size of about Mpc. The Bootes supercluster (Scl 349) with its richest cluster, A1795, is located in the middle chain of superclusters. We also see rich clusters in the chains of nearby superclusters that connect the Hercules supercluster and the chains of rich superclusters behind it (the distribution of galaxy superclusters was described in detail in Einasto et al. 2011b).
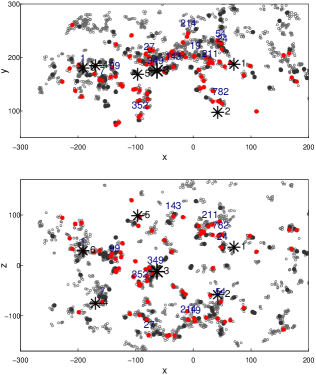
As a next step, we analysed the distance distributions of groups and clusters of galaxies around each rich cluster individually. This analysis showed that whether the distance distribution has a maximum or not depends on the location of the cluster in the cosmic web (Fig. 2). Cluster A1795 in the middle chain of superclusters in the Bootes supercluster (SCl 349, cluster 3 in the figure and in Table LABEL:tab:cl7data) has the strongest maximum in the distance distributions. In the next section we describe in detail the structures in the cosmic web that give rise to these maxima. We found 28 galaxy clusters with a maximum at Mpc in these distributions. They can be considered as shell centre candidates. If these clusters are located in the same (or neighbouring) superclusters, they are grouped together and represent the same possible centre, therefore we selected one cluster per possible centre. Data on six shell centre candidate clusters are given in Table LABEL:tab:cl7data. We list the coordinates, distances, total luminosities, and the peak values of the luminosity density field at the location of the cluster (at a smoothing length of Mpc, calculated with the spline kernel in units of mean luminosity density, = 1.65 Liivamägi et al. 2012). Next we describe the maximum, and the spatial structure around cluster A1795 in detail. Data on galaxy superclusters mentioned in the text can be found in Table LABEL:tab:scl (see Liivamägi et al. 2012; Einasto et al. 2012a, for details).
| (1) | (2) | (3) | (4) | (5) | (6) | (7) | (8) | (9) | (10) |
| No. | ID | Abell ID | SCl ID | ||||||
| [deg] | [deg] | [ Mpc] | [] | ||||||
| 1 | 20159 | 52 | 158.02 | 40.16 | 203.31 | 59.80 | 3.9 | A 1026, A 1035X | — |
| 2 | 3714 | 82 | 164.58 | 1.56 | 121.07 | 54.71 | 5.6 | A 1139X | — |
| 3 | 23374 | 114 | 207.22 | 26.68 | 186.81 | 100.95 | 9.0 | A 1795X, A 1818 | 349 |
| 4 | 34513 | 53 | 225.86 | 7.88 | 261.94 | 94.18 | 5.9 | A 2020 | 1311 |
| 5 | 50647 | 52 | 232.32 | 52.88 | 217.84 | 62.30 | 4.4 | — | — |
| 6 | 29587 | 207 | 239.52 | 27.32 | 264.53 | 365.47 | 20.7 | A 2142X | 1 |
3.2 Structure around cluster A1795
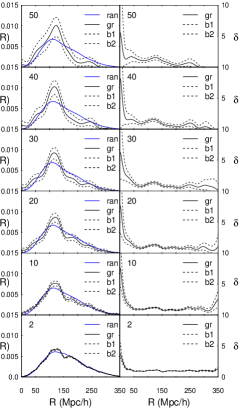
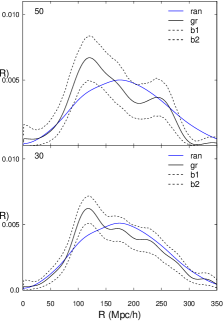
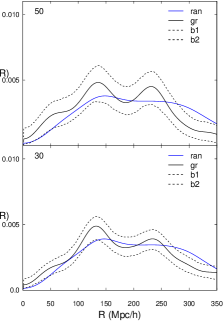
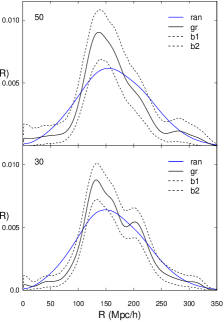
We show in Fig. 3 the distributions of distances of rich and poor clusters and groups from cluster A1795. We also plot the distance and density distributions of the random samples that follow the mean dependence of the groups on distance from the observer (the reference distribution) and the 95% confidence limits for the distributions, obtained by smoothed bootstrap, as described above. Random distributions are smooth with a maximum around Mpc that is caused by the geometry of the sample (Fig. 3). The selection functions used to generate the random distributions account for the fact that the spatial density of groups of various richness in our sample differs slightly. Thus the dependence of the density of groups of different richness in the random distributions on distance follows that in our group catalogue.
| (1) | (2) | (3) | (4) | (5) | (6) |
|---|---|---|---|---|---|
| ID(long) | ID | ID(E01) | |||
| 239+027+0091 | 1 | 264 | 1809 | 22.2 | — |
| 227+006+0078 | 7 | 233 | 1675 | 17.0 | 154 |
| 184+003+0077 | 19 | 231 | 2919 | 15.0 | 111 |
| 167+040+0078 | 24 | 225 | 751 | 14.6 | 95 |
| 202-001+0084 | 27 | 256 | 5163 | 14.0 | 126 |
| 173+014+0082 | 54 | 241 | 2064 | 12.4 | 111 |
| 230+027+0070 | 99 | 215 | 2874 | 11.5 | 158 |
| 229+006+0102 | 103 | 302 | 1004 | 11.0 | 160 |
| 135+038+0094 | 124 | 281 | 548 | 10.5 | 249 |
| 152-000+0096 | 126 | 285 | 1001 | 10.1 | 82 |
| 203+059+0072 | 143 | 211 | 753 | 10.1 | 133 |
| 172+054+0071 | 211 | 207 | 1618 | 9.2 | 109 |
| 216+016+0051 | 349 | 159 | 284 | 8.5 | 138 |
| 227+007+0045 | 352 | 135 | 379 | 8.7 | 154 |
| 151+054+0047 | 782 | 139 | 465 | 6.8 | — |
| 226+007+0090 | 1311 | 272 | 95 | 5.4 | — |
Figure 3 shows in the distributions of distances between A1795 and other rich clusters with at least two maxima, the first maximum at the distance approximately Mpc, and a second one, at the distance approximately Mpc ( and Mpc exactly). Out of 108 rich clusters in our sample, 54 are located in the distance interval of Mpc from A1795. The bootstrap analysis and the comparison with random distribution (blue line in Fig. 3, and the Kolmogorov-Smirnov test for the full samples) confirmed that the observed distance distributions are different from random distributions at a high significance level. The location of the maximum does not depend on richness, but its height increases with the group richness. The density distributions show minimum and maximum at the same scales. There is a slight increase of densities and bump in the distance distributions at scales smaller than Mpc. At the density maximum at Mpc, the cluster density is about 1.6 times higher than the mean cluster density in the sample.
The tests mentioned above showed that observed distributions differ from random distributions, but as the number of rich groups in our sample is small, the maximum we find might still be random fluctuations. They also show a difference from random samples, but this does not say whether the difference is related to the presence of maxima in the distance distributions. To check this, we generated 1000 random samples for every richness class with the same number of groups as in the corresponding class. These samples populate the same volume as the observed clusters and have the same selection function. For each of these random samples, we found the distance and density distribution around A1795 in the same way as we did for the observed sample and determined the maxima in these distributions. The mean number of maxima depended on the richness class, being about 4 for the groups of richness and about 6 for . We found the probability distribution of these maxima in the plane and compared it with the values of for the observed maxima. This gave us the probability of obtaining maxima in the random distribution. By comparing the distribution of these maxima, we found a few random maxima near the observed maxima at small ( Mpc) and large ( Mpc) distances, but the maximum around Mpc lay far outside the minimum (1/1000) probability contour for the random maxima. We can therefore say that this maximum is real, with the probability that we obtain such a maximum from random distributions lower than 0.001, but the other maxima might be caused by the small number of groups in the sample.
Next we analyse the space distribution of galaxy groups and clusters around cluster A1795 to understand which structures are behind the minima and maxima in the distance and density distributions.
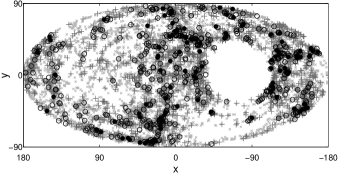
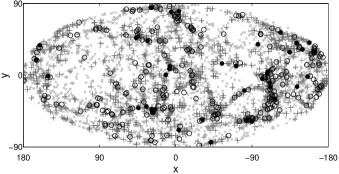
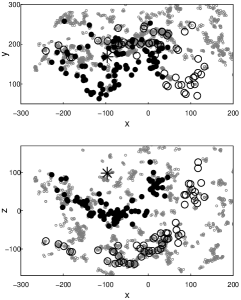
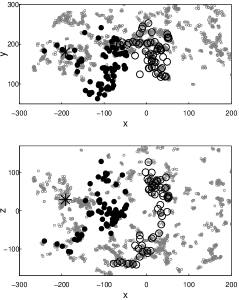
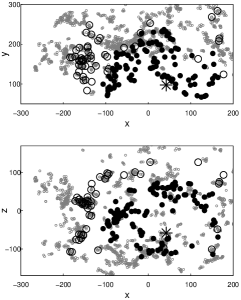
Figure 4 shows the sky distribution of poor and rich groups around cluster A1795 in a distance interval of 90 Mpc 130 Mpc (upper panel), and in a distance interval of 50 Mpc 90 Mpc (lower panel). Almost the complete sky is covered; only a small part of the shell is not visible as a result of the sample boundaries. This plot shows filaments of various richness in the shell. In the upper panel one of the richest structures is the Sloan Great Wall (the superclusters SCl 027 and SCl 019) in the lower central part of the plot, delineated by rich galaxy clusters. Here, in the region of the Sloan Great Wall, the highest luminosity density contrast value is , see Table LABEL:tab:scl. In contrast, in the middle of the left part of the figure we see a low-density region that is only crossed by filaments of poor groups. This clearly shows that the shell is determined by filamentary galaxy systems of various richness. The lower panel also shows filamentary galaxy systems, but they are generally poor. Even the richest systems here consist mostly of poor groups and clusters of intermediate richness.
To understand the space distribution of galaxy groups and clusters in this region better, we show in Fig. 5 the distribution of groups and clusters with at least four member galaxies in Cartesian coordinates. Below we describe the structures of the cosmic web around A1795 in detail. The central part of the structure seen in the figure is formed by cluster A1795 and other groups and clusters in the Bootes supercluster (SCl 349 with a highest luminosity density ). They are surrounded by underdense regions. Chains of galaxy systems penetrating these voids connect the Bootes supercluster with other superclusters that form the walls of the shell. These chains cause the density enhancement at distances Mpc seen in Fig. 3 and in the sky distribution in Fig. 4. After a minimum at about Mpc, the next maximum in the distance distribution at Mpc is due to clusters and groups in rich superclusters. ID numbers of some superclusters are shown in Fig. 5. They include the superclusters from the Sloan Great Wall, SCl 027 and SCl 019 with a density contrast and in the lower part of the lower panel, the Ursa Major supercluster (SCl 211) with and SCl 024 with near SCl 211 in the upper part of the right panel, and the superclusters SCl 099 (the Corona Borealis supercluster with ) and SCl 001 with on the left side of panels. The superclusters SCl 352 with and SCl 782 with are members of galaxy filaments that penetrate the void between the nearby rich Hercules supercluster () and the superclusters SCl 027 and SCl 211, marking the other edges of the shell. Thus, galaxy superclusters around cluster A1795 form a structure close to a spherical shell-like structure since rich superclusters, connected by galaxy filaments and poor superclusters, are approximately at the same distance from the centre cluster A1795. The maximum in the distance distribution is wide, which is due to the width of superclusters. The voids are not empty but marked by poor galaxy groups (Fig. 4). This shows that the overall distribution of the poor groups is smoother than that of rich clusters, and their density contrast is lower, as seen in Fig. 3. The distribution of rich galaxy superclusters in this region was also described in Einasto et al. (2011b).
Groups and clusters at distances Mpc are located across the void region at a distance of Mpc from the wall surrounding cluster A1795. Possibly, they form another shell. However, the far part of this possible wall are not covered by SDSS, and we cannot study this structure in detail.
3.3 Structures around other rich clusters
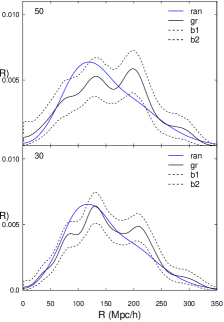
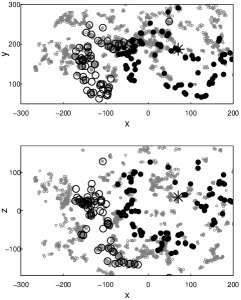
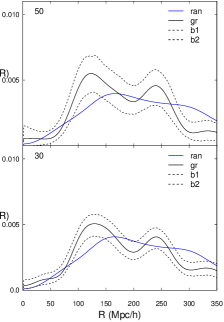
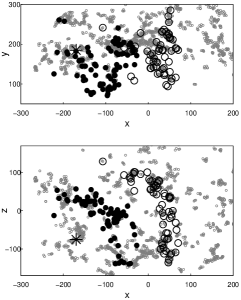
Our calculations showed five more possible shell candidates for which central galaxy clusters had a maximum at a scale of about Mpc in the distance distribution to other galaxy groups and clusters. None of these possible shells are as fully embedded in our sample volume as the shell around cluster A1795. We applied the smoothed bootstrap test to compare the observed and random distance distributions and found for all these clusters that the observed distributions differ from random with high significance. With the maxima test described above, we tested the probability that these maxima can also be found in random distributions. Our sample is shallow, the mean density run of the randomised samples does not represent the local group density distribution well. We therefore did not use the normalised density as shown in Fig. 3, but show the direct distance distributions instead. The maximum in the distance distributions is not always at the same position. Depending on the location of clusters of different richness in superclusters and on the width of superclusters, the values of the maximum for these clusters are in a distance interval of Mpc in the distance distribution of clusters with . We list the values of distance maxima in the captions of the distance distribution figures. We also present the figures of the distribution of groups and clusters with at least four member galaxies in Cartesian coordinates around these five clusters. The data of these clusters are listed in Table LABEL:tab:cl7data. Systems with the number of member galaxies are plotted with black filled circles if their distances from the shell centre cluster lie in an interval of 100 Mpc 150 Mpc, and with black empty circles if their distances lie in an interval of between 200 Mpc 250 Mpc from the centre.
Cluster Gr50647 (Fig. 6) lies at the edge of one chain of superclusters described in Einasto et al. (2011b, 2012a), the superclusters SCl 143 with and SCl 211 (the Ursa Major supercluster with ) are among them. The walls of the possible shell are formed by superclusters in the nearby void region and another chain of superclusters, including the Corona Borealis supercluster with . Clusters at distances 200 Mpc from Gr50647 lie in the Sloan Great Wall. The maxima test confirmed that the maximum at Mpc has a probability lower than 0.001 to be drawn from the random distributions.
Cluster A2142 (Gr29587), the central cluster of a rich supercluster (A2142 supercluster, E2015) is the centre of a possible shell whose walls are formed by superclusters SCl 007, SCl 352, and SCl 349 (the centre of another shell candidate) with a density contrast (Fig. 7). The Sloan Great Wall and other rich superclusters cause a maximum in the cluster distance distribution at 200 Mpc (Fig. 7 left panel). For this cluster the maxima test showed, however, that the maximum at Mpc can also be found in the random distributions. The low significance of the maximum may arise from the location of this cluster near the sample edge.
Cluster Gr20159 (A1026) is an isolated cluster at the edge of a chain of the Ursa Major (SCl 211) and other superclusters (Fig. 8). The possible shell around it is formed by poor superclusters and clusters at the edges of voids. The maximum at Mpc differs from random in the distance distribution of rich clusters around it, with , and is not significant in the case of poorer groups. This is the only cluster in our sample for which the second maximum in the distance distribution can be found from random distributions with a probability lower than 0.001. For this cluster the second maximum for observed clusters is strong, the random distribution is much lower at large distances, but stronger than the observed distribution at smaller distances due to normalisation.
Cluster Gr3714 (A1139) in Fig. 9 is located at the edge of a chain of galaxy groups connected by rich superclusters with poor groups through the void. The possible shell around it is formed by the Bootes supercluster, the Ursa Major, and other superclusters.
Cluster Gr34513 (A2020) is the only rich cluster in the supercluster SCl 1311 with a density contrast , the lowest in our supercluster sample. However, the possible shell walls around it are formed by very rich and high-density superclusters, the Sloan Great Wall, and the Bootes supercluster among them (see Fig. 10).
For these two clusters the maxima test confirmed that the maximum in the distance distributions to other groups and clusters at Mpc has a probability lower than 0.001 to be random.
4 Discussion and conclusions
We analysed the distance distributions around rich clusters of galaxies in the local Universe and found 28 clusters with a maximum at Mpc scales in these distributions. These clusters represent centres of six shell-like structures.
-
•
The rich cluster A1795 in the Bootes supercluster has an almost complete shell-like structure with a radius of about Mpc around it. The probability that we derive this maximum from random distributions is lower than 0.001. The walls of the shell are delineated by filaments of galaxy systems of various richness from poor groups to the richest superclusters in the nearby Universe – the Sloan Great Wall, the Corona Borealis supercluster, the Ursa Major supercluster, and others.
-
•
We found five additional possible centres of shell-like systems with a maximum on a scale of about Mpc in the distance distribution of galaxy groups and clusters around them. These possible shells are only partly embedded in our sample volume. For one cluster (A1026) the maximum at a distance Mpc cannot be drawn from a random distribution.
-
•
The luminosity density contrast of possible shell centres and walls varies from the highest density peak in the whole SDSS survey (in the region of the A2142 supercluster, ) to relatively low density regions with .
The radii of the shells are larger than Mpc, the well-known BAO scale, and they are wide, being in the interval of Mpc. They depend on the positions of the central clusters in the cosmic web.
Another important difference is the composition of the shells: BAO shells are barely detected in the distribution of galaxies. In contrast, the walls of the shell connected with cluster A1795 are formed by superclusters, structures of the highest density in the nearby Universe.
These differences in the properties of shells suggest that the causes for them are different phenomena.
A characteristic scale of about Mpc has been found in the distribution of rich superclusters (Einasto et al. 1994, 1997c; Saar et al. 2002), and in the correlation function of galaxy clusters (Einasto et al. 1997a, b). This is a manifestation of the cellular structure of the Universe, delineated by rich clusters and galaxy superclusters (Jõeveer et al. 1977; Jõeveer & Einasto 1978; Aragón-Calvo et al. 2010; Aragón-Calvo 2014). Einasto et al. (1997d) noted that while the characteristic sizes of voids between superclusters of galaxies are similar for superclusters of all richnesses, the supercluster richness differs in wall voids. This agrees with our present finding that the richness of structures and their luminosity density in shell centres and walls varies strongly.
The pattern of the cosmic web originates from processes in the early universe. The positions of high-density peaks and voids do not change much during the cosmic evolution, only their amplitude grows with time (see references in Introduction). However, it is not yet clear which processes cause shell-like structures in the local cosmic web. Therefore it is important to continue the analysis of the possible characteristic scales in the galaxy cluster and supercluster distribution using samples with larger sky coverage and wider redshift range to understand the presence and possible nature of these scales.
Acknowledgements.
We cordially thank the referee for many useful comments and suggestions that greatly helped us to improve the paper. We are pleased to thank the SDSS Team for the publicly available data releases. Funding for the Sloan Digital Sky Survey (SDSS) and SDSS-II has been provided by the Alfred P. Sloan Foundation, the Participating Institutions, the National Science Foundation, the U.S. Department of Energy, the National Aeronautics and Space Administration, the Japanese Monbukagakusho, and the Max Planck Society, and the Higher Education Funding Council for England. The SDSS Web site is http://www.sdss.org/. The SDSS is managed by the Astrophysical Research Consortium (ARC) for the Participating Institutions. The Participating Institutions are the American Museum of Natural History, Astrophysical Institute Potsdam, University of Basel, University of Cambridge, Case Western Reserve University, The University of Chicago, Drexel University, Fermilab, the Institute for Advanced Study, the Japan Participation Group, The Johns Hopkins University, the Joint Institute for Nuclear Astrophysics, the Kavli Institute for Particle Astrophysics and Cosmology, the Korean Scientist Group, the Chinese Academy of Sciences (LAMOST), Los Alamos National Laboratory, the Max-Planck-Institute for Astronomy (MPIA), the Max-Planck-Institute for Astrophysics (MPA), New Mexico State University, Ohio State University, University of Pittsburgh, University of Portsmouth, Princeton University, the United States Naval Observatory, and the University of Washington. The present study was supported by by the ETAG projects IUT26-2 and IUT40-2, and by the European Structural Funds grant for the Centre of Excellence ”Dark Matter in (Astro)particle Physics and Cosmology” TK120. This work has also been supported by ICRAnet through a professorship for Jaan Einasto. VJM, PAM, and LlHG acknowledge support from the Spanish Ministry for Economy and Competitiveness and FEDER funds through grants AYA2010-22111-C03-02 and AYA2013-48623-C2-2, and Generalitat Valenciana project PrometeoII 2014/060.References
- Aihara et al. (2011) Aihara, H., Allende Prieto, C., An, D., et al. 2011, ApJS, 193, 29
- Anderson et al. (2012) Anderson, L., Aubourg, E., Bailey, S., et al. 2012, MNRAS, 427, 3435
- Aragón-Calvo (2014) Aragón-Calvo, M. A. 2014, ArXiv e-print [arXiv:1409.8661]
- Aragón-Calvo et al. (2010) Aragón-Calvo, M. A., van de Weygaert, R., & Jones, B. J. T. 2010, MNRAS, 408, 2163
- Arnalte-Mur et al. (2012) Arnalte-Mur, P., Labatie, A., Clerc, N., et al. 2012, A&A, 542, A34
- Beutler et al. (2011) Beutler, F., Blake, C., Colless, M., et al. 2011, MNRAS, 416, 3017
- Blake et al. (2011) Blake, C., Kazin, E. A., Beutler, F., et al. 2011, MNRAS, 418, 1707
- Blanton et al. (2003) Blanton, M. R., Hogg, D. W., Bahcall, N. A., et al. 2003, ApJ, 592, 819
- Blanton & Roweis (2007) Blanton, M. R. & Roweis, S. 2007, AJ, 133, 734
- Bond et al. (1996) Bond, J. R., Kofman, L., & Pogosyan, D. 1996, Nature, 380, 603
- Chincarini & Rood (1979) Chincarini, G. & Rood, H. J. 1979, ApJ, 230, 648
- Cole et al. (2005) Cole, S., Percival, W. J., Peacock, J. A., et al. 2005, MNRAS, 362, 505
- Davison & Hinkley (1997) Davison, A. C. & Hinkley, D. V. 1997, Bootstrap Methods and their Application (Cambridge University Press, Cambridge)
- de Lapparent et al. (1986) de Lapparent, V., Geller, M. J., & Huchra, J. P. 1986, ApJL, 302, L1
- Einasto et al. (1997a) Einasto, J., Einasto, M., Frisch, P., et al. 1997a, MNRAS, 289, 801
- Einasto et al. (1997b) Einasto, J., Einasto, M., Frisch, P., et al. 1997b, MNRAS, 289, 813
- Einasto et al. (1997c) Einasto, J., Einasto, M., Gottlöber, S., et al. 1997c, Nature, 385, 139
- Einasto et al. (1975) Einasto, J., Jôeveer, M., Kivila, A., & Tago, E. 1975, Astronomicheskij Tsirkulyar, 895, 2
- Einasto et al. (2011a) Einasto, J., Suhhonenko, I., Hütsi, G., et al. 2011a, A&A, 534, A128
- Einasto et al. (1994) Einasto, M., Einasto, J., Tago, E., Dalton, G. B., & Andernach, H. 1994, MNRAS, 269, 301
- Einasto et al. (2001) Einasto, M., Einasto, J., Tago, E., Müller, V., & Andernach, H. 2001, AJ, 122, 2222
- Einasto et al. (2015) Einasto, M., Gramann, M., Saar, E., et al. 2015, A&A, 580, A69
- Einasto et al. (2011b) Einasto, M., Liivamägi, L. J., Tago, E., et al. 2011b, A&A, 532, A5
- Einasto et al. (2012a) Einasto, M., Liivamägi, L. J., Tempel, E., et al. 2012a, A&A, 542, A36
- Einasto et al. (1997d) Einasto, M., Tago, E., Jaaniste, J., Einasto, J., & Andernach, H. 1997d, A&AS, 123, 119
- Einasto et al. (2014) Einasto, M., Tago, E., Lietzen, H., et al. 2014, A&A, 568, A46
- Einasto et al. (2012b) Einasto, M., Vennik, J., Nurmi, P., et al. 2012b, A&A, 540, A123
- Eisenstein et al. (2005) Eisenstein, D. J., Zehavi, I., Hogg, D. W., et al. 2005, ApJ, 633, 560
- Gregory & Thompson (1978) Gregory, S. A. & Thompson, L. A. 1978, ApJ, 222, 784
- Jõeveer & Einasto (1978) Jõeveer, M. & Einasto, J. 1978, in IAU Symposium, Vol. 79, Large Scale Structures in the Universe, ed. M. S. Longair & J. Einasto, 241–250
- Jõeveer et al. (1977) Jõeveer, M., Einasto, J., & Tago, M. 1977, Tartu Astrofüüs. Obs. Preprint, Nr. A-1, 45 p., 1, A1
- Juszkiewicz et al. (2013) Juszkiewicz, R., Hellwing, W. A., & van de Weygaert, R. 2013, MNRAS, 429, 1206
- Kirshner et al. (1981) Kirshner, R. P., Oemler, Jr., A., Schechter, P. L., & Shectman, S. A. 1981, ApJL, 248, L57
- Kofman & Shandarin (1988) Kofman, L. A. & Shandarin, S. F. 1988, Nature, 334, 129
- Ledlow et al. (2003) Ledlow, M. J., Voges, W., Owen, F. N., & Burns, J. O. 2003, AJ, 126, 2740
- Liivamägi et al. (2012) Liivamägi, L. J., Tempel, E., & Saar, E. 2012, A&A, 539, A80
- Martínez et al. (2009) Martínez, V. J., Arnalte-Mur, P., Saar, E., et al. 2009, ApJL, 696, L93
- Martínez & Saar (2002) Martínez, V. J. & Saar, E. 2002, Statistics of the Galaxy Distribution (Chapman & Hall/CRC, Boca Raton)
- Miller et al. (2004) Miller, L., Croom, S. M., Boyle, B. J., et al. 2004, MNRAS, 355, 385
- Oort (1983) Oort, J. H. 1983, ARA&A, 21, 373
- Padmanabhan et al. (2012) Padmanabhan, N., Xu, X., Eisenstein, D. J., et al. 2012, MNRAS, 427, 2132
- Park et al. (2007) Park, C., Choi, Y., Vogeley, M. S., Gott, III, J. R., & Blanton, M. R. 2007, ApJ, 658, 898
- Peebles (1980) Peebles, P. J. E. 1980, The large-scale structure of the universe (Princeton University Press)
- Peebles & Yu (1970) Peebles, P. J. E. & Yu, J. T. 1970, ApJ, 162, 815
- Planck Collaboration et al. (2015) Planck Collaboration, Ade, P. A. R., Aghanim, N., et al. 2015, ArXiv e-print [arXiv:1502.01589]
- Saar et al. (2002) Saar, E., Einasto, J., Toomet, O., et al. 2002, A&A, 393, 1
- Silverman (1986) Silverman, B. W. 1986, Density estimation for statistics and data analysis (Chapman and Hall, London)
- Springel et al. (2005) Springel, V., White, S. D. M., Jenkins, A., et al. 2005, Nature, 435, 629
- Suhhonenko et al. (2011) Suhhonenko, I., Einasto, J., Liivamägi, L. J., et al. 2011, A&A, 531, A149
- Tempel et al. (2012) Tempel, E., Tago, E., & Liivamägi, L. J. 2012, A&A, 540, A106
- Tempel et al. (2014) Tempel, E., Tamm, A., Gramann, M., et al. 2014, A&A, 566, A1
- Turner & Gott (1976) Turner, E. L. & Gott, III, J. R. 1976, ApJS, 32, 409
- van de Weygaert & Schaap (2009) van de Weygaert, R. & Schaap, W. 2009, in Lecture Notes in Physics, Berlin Springer Verlag, Vol. 665, Data Analysis in Cosmology, ed. V. J. Martínez, E. Saar, E. Martínez-González, & M.-J. Pons-Bordería, 291–413
- Weinberg et al. (2013) Weinberg, D. H., Mortonson, M. J., Eisenstein, D. J., et al. 2013, Phys. Rep, 530, 87
- Zeldovich et al. (1982) Zeldovich, I. B., Einasto, J., & Shandarin, S. F. 1982, Nature, 300, 407