Improved measurement of the branching ratio
Abstract
A new measurement of the branching ratio, , resulted in . This is in agreement with the standard model prediction and improves the test of electron-muon universality to the level of 0.1 %.
pacs:
13.20.Cz, 14.40.Be, 14.60.St, 14.80.-jThe standard model (SM) assumes equal electro-weak couplings of the three lepton generations, a hypothesis known as lepton universality which is studied in high precision measurements of and decays. A recent measurement of decays lhcb , where represents e or , hinted at a possible violation of e- universality in second order weak interactions that involve neutral and charged currents. The branching ratio of pion decays, , where indicates inclusion of associated radiative decays, has been calculated in the SM with extraordinary precision to be vc ; bmty . Comparison with the latest experimental values, triumf and psi , has provided one of the best tests of e- universality in weak interactions for the charged current, at the 0.2 % level giving sensitivity to new physics beyond the SM up to mass scales of (500) TeVbmty . Examples of new physics probed include R-parity violating SUSY mjrm , extra leptons endo and leptoquarks lepto . In this paper, we present the first results from the PIENU experiment, which improve on the precision of and the test of e- universality.
The branching ratio is obtained from the ratio of positron yields from the decay (total positron energy E MeV) and the decay followed by the decay (, E MeV) using pions at rest. Figure 1 shows a schematic view of the apparatus nimpaper in which a 75-MeV/ beam from the TRIUMF M13 channel m13 was degraded by two thin plastic scintillators B1 and B2 and stopped in an 8-mm thick scintillator target (B3) at a rate of /s. Pion tracking was provided by wire chambers (WC1 and WC2) at the exit of the beam line and two (,) sets of single-sided 0.3-mm thick planes of silicon strip detectors, S1 and S2, located immediately upstream of B3.

The positron calorimeter, 19 radiation lengths (r.l.) thick, placed on the beam axis consisted of a 48-cm (dia.) 48-cm (length) single-crystal NaI(T) detector bnl preceded by two thin plastic scintillators (T1 and T2). Two concentric layers of pure CsI crystals e949 (9 r.l. radially, 97 crystals total) surrounded the NaI(T) crystal to capture electromagnetic showers. Positron tracking was done by an () pair of Si-strip detectors (S3) and wire chambers (WC3) in front of the NaI(T) crystal.
A positron signal, defined by a T1 and T2 coincidence, occurring in a time window –300 to 540 ns with respect to the incoming pion was the basis of the main trigger logic. This was prescaled by a factor of 16 to form an unbiased trigger (Prescaled-trigger). Events in an early time window 6 to 46 ns and events with MeV in the calorimeter provided other triggers (Early- and HE-triggers), which included most decays. The typical trigger rate (including monitor triggers) was 600 Hz.
Events originating from stopped pions were selected based on their energy losses in B1 and B2. Any events with extra activity in the beam and positron counters (B1, B2, T1 and T2) in the time region of –7 to 1.5 s with respect to the pion stop were rejected. About 40 % of events survived the cuts. A fiducial cut for positrons entering the NaI(T) detector required a track at WC3 to be within 60 mm of the beam axis to reduce electromagnetic shower leakage from the crystal.
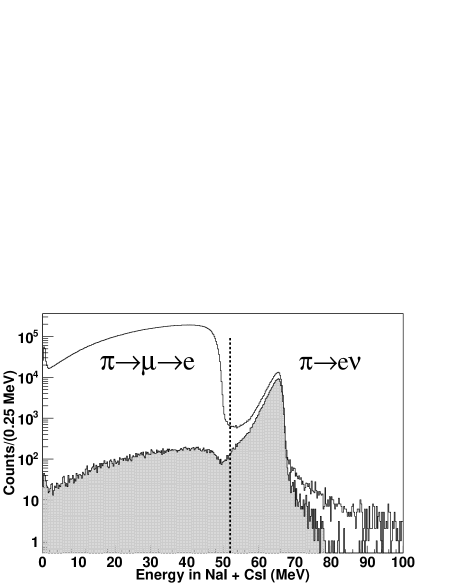
The summed NaI(T) and CsI energy for positrons in the time region 5 to 35 ns is shown in Fig. 2. The time spectra for events in the low- and high-energy regions separated at E MeV are shown in Fig. 3. Events satisfying the Early-trigger or Prescaled-trigger filled the low-energy histogram (Fig. 3a) and HE-trigger events filled the high-energy histogram (Fig. 3b). There were events at this stage. The raw branching ratio was determined from the simultaneous fit of these timing distributions. To reduce possible bias, the raw branching ratio was shifted (“blinded”) by a hidden random value within 1 %. Prior to unblinding, all cuts and corrections were determined and the stability of the result against variations of each cut was reflected in the systematic uncertainty estimate.
In the low-energy time spectrum, the main components were decays at rest (L1), decays (L2, about 1 % of L1) after decays-in-flight of pions (DIF), and decays coming from previously stopped (“old”) muons remaining in the target area (L3):
| L1: | for , |
| L2: | for , and |
| L3: | for any . |
The distribution coming from the presence of plural muons in the target area was estimated to be 0.01 %, and was ignored in the fit. The low-energy fraction of events due to shower leakage and radiative decays was also negligible in the low-energy time spectrum fit.
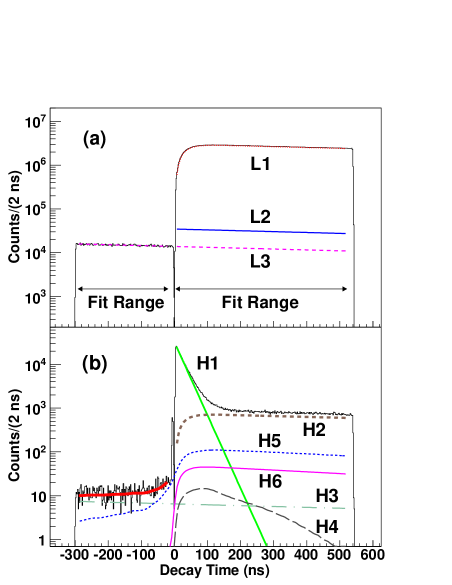
The primary time distribution component in the high-energy region was the decay (H1: for ). The amplitude of H1 also included the high-energy portion (E) of decay-in-flight of muons (DIF) following decay at rest, which was estimated by simulation geant to be of L1. The major backgrounds (H2) in the high-energy region came from muon decays due to the energy resolution of the detector, radiative muon decays in which the -ray raised the observed calorimeter energy above Ecut, and extra hits (pile-up) in the calorimeter with a flat time distribution ( due to neutrons from the pion production target). The H2 component had an identical time dependence to the low-energy spectrum (L1+L2). The contribution from L3 via the same mechanism was separately treated as a muon decay component (H3) to include other contributions of “old” muons.
Radiative pion decays (branching fraction, radpi ) followed by decays could contribute to the high-energy region if the -ray hit the calorimeter. The contribution of the extra -ray to the observed positron energy varied with the time difference of the two decays. This contribution (H4) was simulated using the observed pulse shapes of the NaI(T) and CsI signals, and is shown by the dashed line in Fig. 3b. The amplitude of this component was of L1 in the fit.
The background in the region ns was due to events with time distribution H3 and those in which a positron from an “old” muon hit T1 in coincidence with a positron, from decay of the stopped pion, that missed T1 but hit the calorimeter, raising the observed energy above Ecut. The shape of this time spectrum (H5), including the inverse combination, was generated by simulation using the observed pulse shapes and the energy distributions for the corresponding event topologies. The shape and the relative amplitude of H5 are shown by the dotted line in Fig. 3b.
A pile-up cut based on the T1 waveform rejected events with two hits. However, events with two T1 hits within the double pulse resolution of T1 ( ns) were accepted, and the probability for the measured positron energy to be E Ecut was high in those events. By artificially increasing the double pulse resolution up to 200 ns, the amplitude of this component (H6) was obtained and fixed to the “old” muon background L3 in the fit. The H6 component is shown by the full line in Fig. 3b; the uncertainty in was 0.01 %.
The free parameters in the fit for the low-energy region were the amplitudes of L1, L2, and L3. The time origin , which was determined using prompt events, was fixed in the fit. The choice of did not affect the branching ratio as long as the amplitude of L2 was a free parameter. The free parameters for the high-energy region were the amplitudes of H1, H2, H3 and H5. The total of the high-energy and low-energy fit was minimized with a common . The fitting region was –290 ns to 520 ns excluding the prompt region of –19 to 4 ns.
The overall fit result is almost indistinguishable from the data and is not displayed in Fig. 3, except in (b) for ns (thick solid line). No structure was evident in the plot of residuals of the fit. The raw branching ratio and its statistical and systematic uncertainties were with (DOF=673). The systematic uncertainty includes uncertainties of the parameters and shapes in the fit and of small components excluded from the standard fitting function as listed in Table 1. The branching ratio was stable for the fits with free pion and muon lifetimes, which were consistent with the current values pdg .
Some corrections applied to the raw branching ratio relied on simulation geant . Pions were generated 0.5 m upstream of the detector according to the measured pion beam distribution. Small energy-dependent effects in the energy-loss processes of positrons change the relative acceptances of low- and high-energy events. The ratio of the acceptances of the and decays was found to be for a WC3 radius cut 60 mm.
The largest correction to the raw branching ratio was for the events below Ecut, which primarily arose from the response function of the calorimeter. Because of structure in the response function due to hadronic interactions bump , which was not well reproduced by the simulation, empirical measurements were performed. Special data, using a simplified setup consisting of T2 and WC1-3, taken with a 70-MeV/ positron beam at various entrance angles were used to determine the response function. In order to obtain the fraction of the events below Ecut for the full setup, the difference in the detector geometry, the angular distributions, and radiative pion decays were estimated using simulation. The fraction of the events below E MeV was found to be %. Since a small contribution to the observed fraction from low-energy positrons in the beam could not be ruled out, the tail correction obtained in this way was treated as an upper bound.
In order to estimate the lower bound to the tail fraction, events were suppressed using an early decay-time region 5–35 ns, pulse shape and total energy in B3, and measurements of the straightness of the pion track neutrino . The resulting background-suppressed positron energy spectrum is shown by the shaded histogram in Fig. 2. The remaining background was subtracted from the spectrum using the fact that the background-suppressed spectrum in a low-energy region contained a negligible tail contribution. The area of the low-energy region was scaled to the full region () using the known background distribution. This resulted in a lower bound of %. Since the total energy cut used in the suppression method tended to remove events with Bhabha scattering which resulted in larger energy deposit in B3, a correction of % obtained by simulation was added to the tail correction. Thus, the lower bound was %. Combining the upper and lower bounds, a multiplicative tail correction of was obtained.
Possible energy-dependent effects on were studied using positrons in the beam at momenta 10–70 MeV/, and with positrons from muons stopped at the center of B3 by lowering the beam momentum to 62 MeV/. The multiplicative correction from this effect was . Other uncertainties included are for possible trigger inefficiencies () and distortions due to pile-up and other cuts ().
Stability of the measured branching ratio was further tested for dependence on many parameters, such as fitting ranges, fiducial cuts, pile-up cuts and Ecut, which provided confidence in the validity of the background functions and corrections. Figure 4 shows the dependence on Ecut. The drop below 50.5 MeV is primarily due to the energy threshold of the HE-trigger.
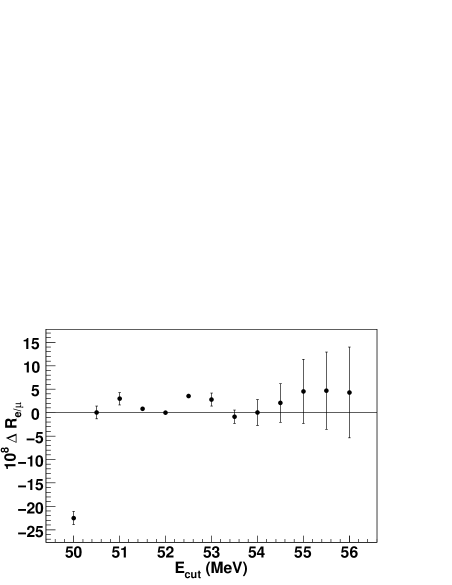
Table 1 shows a summary of the fit uncertainties and corrections after “unblinding”. The measured branching ratio is , consistent with previous work and the SM prediction. The present result improves the test of e- universality compared to previous experiments by a factor of two: for the charged current. Results using an order of magnitude more data and possibly improved systematic uncertainty estimates will be forthcoming.
This measurement also results in improved 90 % confidence-level limits fc on the neutrino mixing parameter between the weak electron-neutrino eigenstate and a hypothetical mass eigenstate neutrino , in the mass region MeV, where is a kinetic factor found in Refs. shrock ; oldnu .
| Values | Uncertainties | ||
| 1.1972 | 0.0022 | 0.0005 | |
| , lifetimes | 0.0001 | ||
| Other parameters | 0.0003 | ||
| Excluded components | 0.0005 | ||
| Corrections | |||
| Acceptance | 0.9991 | 0.0003 | |
| Low-energy tail | 1.0316 | 0.0012 | |
| Other | 1.0004 | 0.0008 | |
| 1.2344 | 0.0023 | 0.0019 | |
This work was supported
by the Natural Sciences and Engineering Research Council
and TRIUMF through a contribution from the National Research Council of Canada,
and by the Research Fund for the Doctoral Program of Higher Education of China,
by CONACYT doctoral fellowship from Mexico, and
by JSPS KAKENHI Grant numbers 18540274, 21340059, 24224006 in Japan.
We are grateful to Brookhaven National Laboratory for
the loan of the crystals, and to the TRIUMF operations, detector,
electronics and DAQ groups for
their engineering and technical support.
References
- (1) R. Aaij ., Phys. Rev. Lett. 113, 151601 (2014).
- (2) W.J. Marciano and A. Sirlin, Phys. Rev. Lett. 71, 3629 (1993); V. Cirigliano and I. Rosell, J. High Energy Phys. 0710, 005 (2007).
- (3) D.A. Bryman, W. Marciano, R. Tschirhart and T. Yamanaka, Ann. Rev. Nucl. Part. Sci. 61, 331-354 (2011).
- (4) D.I. Britton , Phys. Rev. Lett. 68, 3000 (1992); D.I. Britton , Phys. Rev. D49, 28 (1994).
- (5) G. Czapek , Phys. Rev. Lett. 70, 17 (1993).
- (6) M.J. Ramsey-Musolf, S. Su and S. Tulin, Phys. Rev. D76, 095017 (2007).
- (7) M. Endo and T. Yoshinaga, arXiv:1404.4498.
- (8) S. Davidson, D. Bailey and B. Campbell, Z. Phys. C61, 613 (1994).
- (9) A. Aguilar-Arevalo , Nucl. Instrum. Methods A791, 38-46 (2015).
- (10) A. Aguilar-Arevalo , Nucl. Instrum. Methods A609, 102 (2009).
- (11) G. Blanpied , Phys. Rev. Lett. 76, 1023 (1996).
- (12) I-H. Chiang , IEEE NS-42, 394 (1995).
- (13) GEANT4; S.Agostinelli , Nucl. Instrum. Methods A506, 250 (2003); http://geant4.cern.ch.
- (14) G. Bressi, , Nucl. Phys. B513, 555 (1998).
- (15) K.A. Olive (Particle Data Group), Chin. Phys. C38, 090001 (2014).
- (16) A. Aguilar-Arevalo , Nucl. Instrum. Methods A621, 188 (2010).
- (17) M. Aoki , Phys. Rev. D84, 052002 (2011).
- (18) G.J. Feldman and R.D. Cousins, Phys. Rev. D57, 3873 (1998).
- (19) D.I. Britton , Phys. Rev. D46, R885 (1992).
- (20) R.E. Shrock, Phys. Rev. D24, 1232 (1981).