Social media appears to affect the timing, location, and severity of school shootings
Abstract
Over the past two decades, school shootings within the United States have repeatedly devastated communities and shaken public opinion. Many of these attacks appear to be ‘lone wolf’ ones driven by specific individual motivations, and the identification of precursor signals and hence actionable policy measures would thus seem highly unlikely. Here, we take a system-wide view and investigate the timing of school attacks and the dynamical feedback with social media. We identify a trend divergence in which college attacks have continued to accelerate over the last 25 years while those carried out on K-12 schools have slowed down. We establish the copycat effect in school shootings and uncover a statistical association between social media chatter and the probability of an attack in the following days. While hinting at causality, this relationship may also help mitigate the frequency and intensity of future attacks.
pacs:
89.65.-s,89.75.Da,89.75.Fb,89.75.-kIntroduction
Extensive research has been carried out on individual mass shooting case studies, yielding a complex variety of causes revolving around individual-centric factors such as mental illness, social rejection and harassment Newman et al. (2004); Flannery et al. (2013); Kimmel and Mahler (2003); Leary et al. (2003) (see Muschert and Carr (2006) and O’Toole (2000) for reviews). A sociological model to understand and prevent attacks has been proposed Levin and Madfis (2009) and several solutions have been presented, including community cohesion Newman et al. (2004) and early-signals detection Wike and Fraser (2009); Borum et al. (2010). Recent studies have analyzed the causes of school shootings at a larger scale, finding that school shootings can impact new attacks Towers et al. (2015), and that unemployment rates are correlated with shooting rates Pah et al. (2017). Our work provides a significant advance on current understanding by providing a collective level description beyond individual case studies, accompanied by a rigorous mathematical framework. We establish the copycat effect in school shootings, providing evidence for the role that media plays in the spread of school shootings Muschert and Schildkraut (2017). These results follow from our unified treatment of two complementary databases (see Methods), the first (Shultz) of which includes fatals attacks from 1990–March 2018, while the second (Everytown) includes all incidents from 2013–March 2018, irrespective of whether there were casualties. Furthermore, we include a database of mass killings (collected by USA Today), covering attacks causing more than four casualties from 2006–July 2015, showing that the results are not exclusive of school shootings, but consistent across high-profile types of violence.
Data characterization
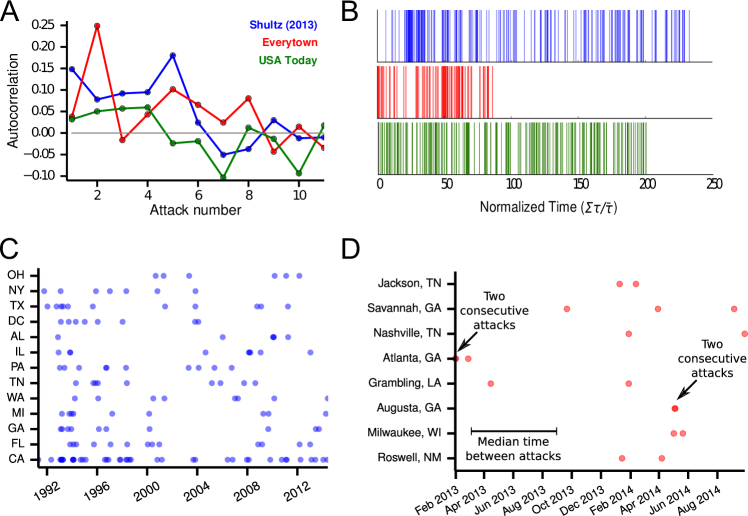
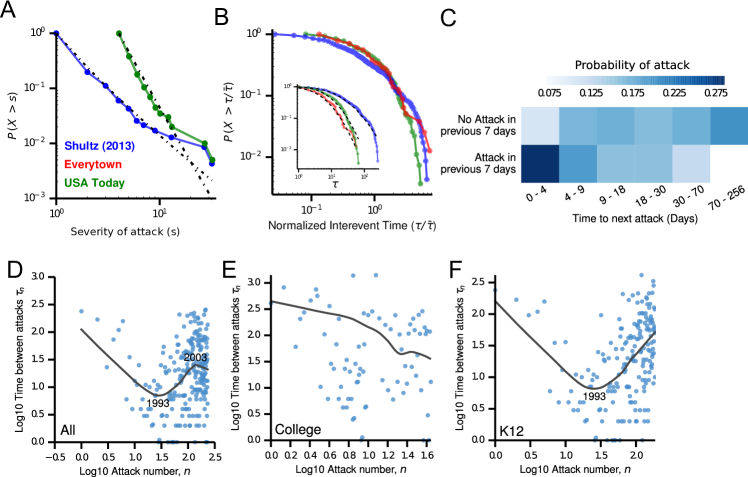
Many human activities have been shown to give rise to heavy-tail distributions in the magnitude of the associated events and in the interevent times. Consistent with other human activities, we found heavy-tail distributions in the attack size (Fig. 1A) and the timing of attacks (Fig. 1B) across the three databases studied. Despite these data reflecting attacks with different characteristics, all databases showed remarkable consistency in the interattack distribution when normalized by the average waiting time (Fig. 1B). Importantly, heavy-tail distributions in the timing of attacks show a deviation from a random Poisson process, where the event rate is uniform in time, and indicate the presence of underlying factors.
The deviation from Poisson processes in complex systems has been associated with burstiness Goh and Barabási (2008), where events cluster together in time (Figs. S1A–D). Clustering can emerge from two mechanisms Goh and Barabási (2008). Firstly, it is related to the distribution of interevent times and can be characterized by the normalized coefficient of variance . ranges between for highly regular processes to for Poisson processes and for heavy-tail distributions. Physiological complex systems such as hearbeats are highly regular, while natural and human activities usually exhibit large burstiness values Goh and Barabási (2008). Interestingly, the distribution of time events is only moderately skewed, with for the Shultz, Everytown and USA Today databases. These values contrast with the burstiness for other human activities such as emailing, library loans, printing and calls, that range between and . The second mechanism affecting clustering is the memory of the system. While natural activities exhibit memory (e.g., large replicas follow large earthquakes), human activities have low to no memory Goh and Barabási (2008). We measured the memory of the system using autocorrelation, which ranges between for disassortative process—i.e., large (small) interevent times follow small (large) interevent times, for no correlation and for assortative processes. In contrast to other human activities, we found memory comparable to natural phenomena for up to five attacks (Fig. S1A). Importantly, the existance of memory is linked to a four-fold increase in the probability of an attack in the days following a school shooting (Fig. 1C). Given that the clustering not only arises from a skewed distribution of the interevent times, but also from memory, we hypothesize the existence of an external feedback loop increasing the attack rate, that we later link to social media.
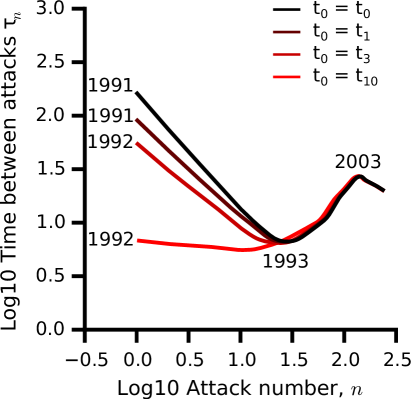
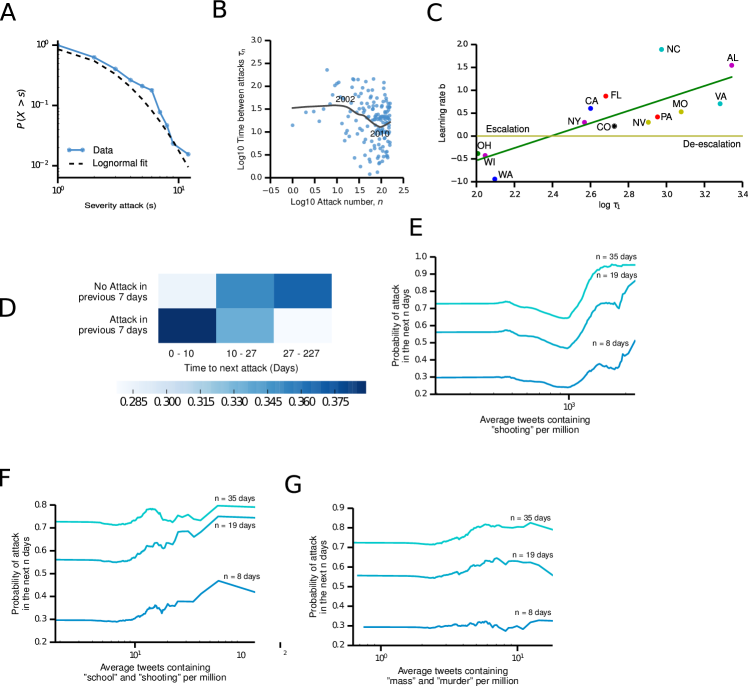
To further characterize the data, we analyzed the interevent time distribution in detail. We apply locally weighted scatterplot smoothing (LOWESS) to the log-log plot of versus (Fig. 1D–F), where the slope is an indicator of changes in the attack rate Johnson et al. (2013). Figure 1D, containing all attacks, shows three regions in time: From 1990 until 1993, the attack rate increased steadily (). From 1993 until 2003 there was a slowing down in the attacks (), that was interrupted around 2004, when the escalation rate again became positive. Although the specific value of depends on the correct determination of the first interevent time (), the results are robust to different values of (Fig. S2B–C). The change in trend in 2004 shows that college attacks have been accelerating (Fig. 1E), while K-12 attacks have continued slowing down (Fig. 1F). In the following sections we describe and analyze the results of two models that have been successfully applied to explain other forms of conflict: the Hawkes process Hawkes (1971); Hawkes and Oakes (1974); Laub et al. (2015) and the dynamical Red Queen or “Red versus Blue” model Johnson et al. (2013).
Models
Hawkes process: The Hawkes process is a self-exciting point process model described by
| (1) |
where is the attack rate at position and time , is the background Poisson rate and is the contribution of the attack occurring at . Hawkes processes have been typically used to study earthquakes Ogata (1988). In the case of seismicity, a triggered earthquake is followed by aftershocks, which in turn activate new aftershocks creating a cascade of events. This is modelled by separating earthquakes into background and aftershocks, where background events occur with a specific background rate and the probability of the aftershocks depends on the time and distance from previous earthquakes according to the kernel . The kernel can be explicitly defined Ogata (1988) or calculated using non-parametric methods Marsan and Lengliné (2008). The same modelling has also recently been successfully applied to social phenomena, such as finance Hardiman et al. (2013), crime Mohler et al. (2012), terrorism in Irak Lewis et al. (2012) and mass killings Towers et al. (2015). Here, we used the non-parametric method from Marsan and Lengliné (2008) to estimate the kernel and understand the mechanism by which school shootings trigger cascades of attacks.
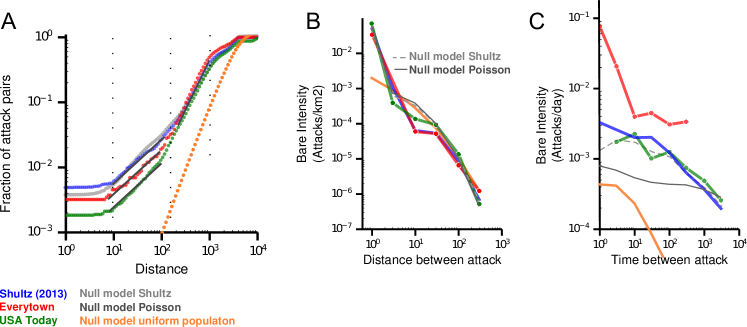
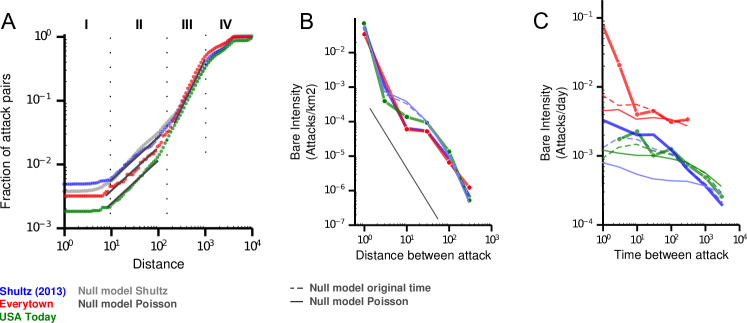
Marsan and Lengliné’s method Marsan and Lengliné (2008) uses an expectation-maximization algorithm on the binned events (earthquakes in their case). It iteratively decouples the events into background and triggering events using and , and updates and using the new decoupling of events until convergence is obtained. The original algorithm revealed a linear scaling between the magnitude of the event and the probability of an aftershock. However, this either does not apply for school shootings or the difference is too small to quantify given the sparsity of our data (Fig. S3A–B). Therefore, we excluded the magnitude of the attack from the study and calculate the relationship between the probability of new attacks given the time and distance since previous attacks. In order to put our results in perspective, we created four null models where we varied the distance and the timing between attacks. In the first two models (I,II) the attacks were drawn at random from US cities with probability proportional to their population (using the Geonames database). In the last two models (III,IV) the attacks were drawn at random from any coordinate in the United States. Models I and III use a timing between attacks equal to the (Schulz or Everytown), whereas in models II and IV the attacks occur as a Poisson process with equal to the mean interevent time database ( days and days).
First, we analyze the the fraction of pairs of attacks that are located within a specific distance of each other (Fig. 2). The distance between all attack pairs is similar to that expected if the attacks were distributed proportional to the US population. Next, we analyzed the effect of time and distance in the spreading of attacks. Figures 2B–C show the two components of the kernel function , the intensity decrease as a function of the distance between attacks (Fig. 2B) and the decrease as a function of time between attacks (Fig. 2C). If the attacks were uniformly distributed, the algorithm would assign a low weight to the kernel function. However, we obtained a consistent form of the kernel function for all databases studied. Both the distance between attacks and the time between attacks diminish the probability of new attacks as an approximate power-law. Moreover, although the consistency in distance can be explained by the underlying distribution of population (Fig. 2B), the consistency in timing cannot be explained by an underlying Poisson process (Fig. 2C). Thus our results indicate that while the attacks occur approximately at random in space, with the exception of within-town attacks, the attacks do affect the timing of new shootings, increasing the rate of attacks by a 3-10 fold, especially in the week following the attack. Our results are consistent with those of Towers et al. Towers et al. (2015), where the kernel of the Hawkes process was explicitly modeled with a exponential decay on time. While Towers et al. determined that an attack had a half-life of 8.9 days ([3.7-36.9] days) in subsequent attacks, we estimate it on 7.3 days ([5.2 - 11.3] days). The Hawkes model confirms the presence of attack cascades, and quantifies the effect of distance and time in the probability of new attacks.
Red versus Blue model: Empirical and theoretical studies have shown that the trend in timings and distribution of severities of attacks in human conflicts are described by the power laws and respectively, where is the time between attacks and , is the escalation rate, is the attack severity, and Johnson et al. (2011, 2013). Positive values of the escalation rate reflect an increase in the frequency of attacks with time, while the attack rate decreases if is negative. An explanatory model emerges from consideration of the confrontation dynamics between two opponents Johnson et al. (2011). In our case, the two ‘opponents’ are the pool of potential attackers which we call Red, none of whom are necessarily in contact with or know each other, and Society which we call Blue. At any one instance, Red tends to hold a collective advantage over Blue in that Red is largely an unknown threat group residing within Blue. The size of this advantage depends on the number of potential attackers and their resources. Each attack can affect the balance between Red and Blue, for example by increasing Johnson et al. (2011, 2013). It is reasonable to assume that the main changes in Red’s lead over Blue occur just after a new attack, e.g., due to media coverage. This is confirmed empirically by the increased probability of a subsequent attack (Fig. 1C), as well from the results of the Hawkes model (Fig. 2C). If the changes in are independent and identically distributed, the Central Limit Theorem states that the typical value of after attacks, , will be proportional to , where Rudnick and Gaspari (2010). For the more general case where changes in depend on the history of previous changes, will deviate from corresponding to ‘anomalous’ diffusion Klafter et al. (1987). Taking the frequency of the attacks to be proportional to Red’s advantage over Blue, we obtain .
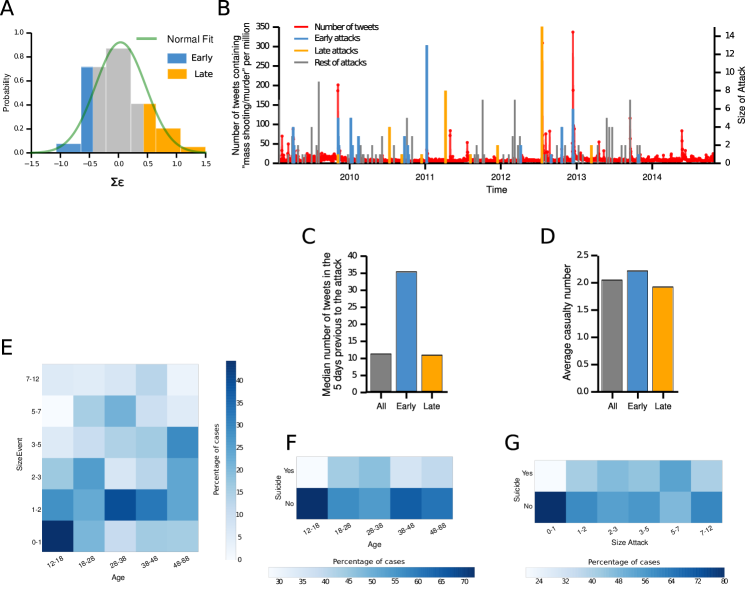
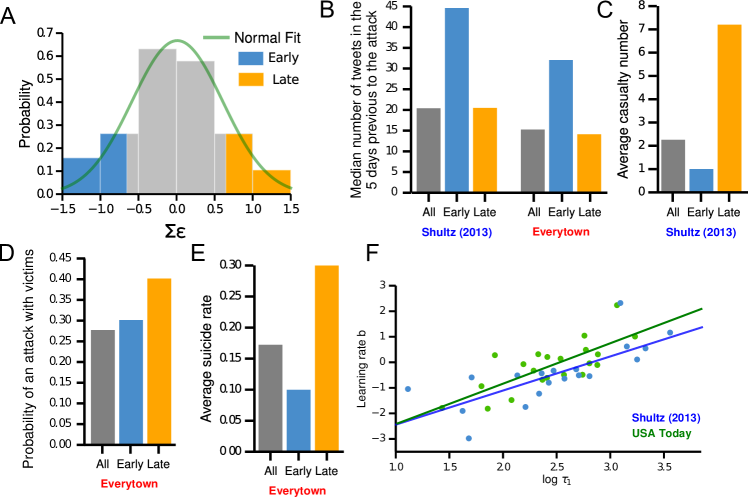
Our theory predicts that the time to the attack is determined by the progress curve . The progress curve assumes that the time to the next attack is deterministic. However, in reality one can imagine that a series of background processes would need to ‘fall into place’ before a potential attacker finds himself in an operational position to carry out an attack and hence provide the attack. The triggering of each of these processes may independently fluctuate and so delay or accelerate the next attack. Similar to multiplicative degradation processes in engineering, we assume that each of these steps multiplies the expected time interval by a factor where the stochastic variables ’s mimic these exogenous factors. It is reasonable to assume that the values of the ’s are independent and identically distributed, which means that their sum (i.e., the noise term in the progress curve fit) is approximately Gaussian distributed with zero mean (Fig. 3A). The observed time interval is now given by . It then follows that , since if . Hence the progress curve represents a straight line fit through a maximum likelihood approach on a log-log plot, exactly as assumed by our LOWESS analysis (Fig. 1D–F) where residuals are Gaussian distributed. The attacks whose deviates from zero are likely to have distinctive characteristics. We labeled the attacks where is larger than one standard deviation as Late and the ones where it is smaller than one negative standard deviation as Early (Fig. 3A). We found that Early attacks are correlated with high media activity (Fig. 3B), as expected since those attacks take place while the news about the previous one have not fade out. We also observed that Late attacks are both more deadly (Fig. 3C–D) and result more frequently in the suicide of the attacker than Early attacks (Fig. 3E). We identify Late attacks with planned attacks whose attackers provide a continued leakage of clues over time O’Toole (2000).
The Red versus Blue model uncovers an unexpected inter-relationship between the patterns of lone-wolf school attacks in different geographical locations. If events in different locations were independent, one would not expect any relationship between the and in different locations. However Figure 3F shows that the opposite is true. The presence of a linear relationship among these different states, as well as the presence of a significant kernel function in the Hawkes model, indicates that there is a common dynamical factor influencing otherwise independent attackers across different states. Our analysis suggests that the cause of this common dynamical factor lies in modern media sources.
The copycat effect
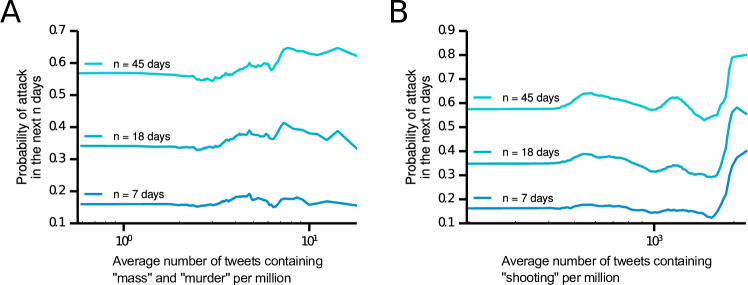
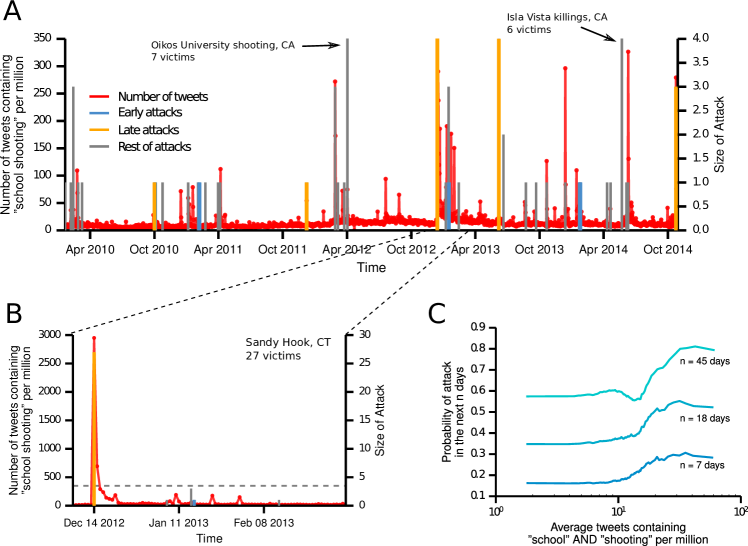
Our hypothesis that the interaction between attacks is indirect through the media is a phenomenon commonly known as the copycat effect Coleman (2004). This interaction can be attributed to an acute ‘issue-attention cycle’ Downs (1972) with the media reacting strongly to every attack Rocque (2012). Although the effect of mass media has been studied, evidence of copycats has been anecdotal O’Toole (2000). To analyze the role of social media (which echos and amplifies all media), we obtained 72 million tweets containing the word “shooting”. From these, over 1.1 million tweets contained the word “school”. Figures 4A–B visualizes the relationship between the number of tweets containing the words “school” and “shooting” with the Early and Late attacks. As expected given that a peak in Twitter activity follows every attack, Early attacks are correlated with periods of high Twitter activity. To study the interaction between social media and school shootings, we plotted the average number of tweets containing the words “school” and “shooting” against the probability of an attack in the next 7, 17 and 44 days, corresponding to percentiles , , and of the distribution of the days between attacks. Fig. 4C shows that the probability of an attack increases with the number of tweets talking about school shootings. For example, the probability of an attack in the next week doubles when the number of school shooting tweets increases from 10 to 50 tweets/million. By contrast, tweets containing only “shooting” or “mass” and “murder” did not show a pronounced effect (Fig. S5). Our analysis thus confirms that social media publicity about school shootings correlates with an increase in the probability of new attacks.
Concluding remarks
Our treatment goes towards explaining and predicting the probablistic escalation patterns in school shootings. Our theory is supported by analysis of an FBI dataset of active shooting Blair and Schweit (2014) (Figs. S6 and S7, Supplementary Information), and has implications in attack prevention and mitigation. First, the discovery of distinct trends for college and K-12 attacks should motivate policy makers to focus policy efforts in distinct ways for these two educational settings. Second, the presence of underlying patterns in the data can improve both short-term and long-term prediction of future trends, for example by focusing the efforts in the cities where there has already been already an attack. Finally, our analysis proves for the first time the copycat effect in school shootings, a topic which has been analyzed primarily in a narrative, case-by-case way to date. Our results do not contradict the fact that the psychological aspect of the attacker is a key factor in an individual attack, or that traditional prevention methods work, but instead draw a new collective example of human conflict in which a small, dynamical, violent sector of society confronts the remainder fueled by Blue’s own informational product (media).
Methods
Methods
Databases
We studied the following datasets: Everytown: The attacks, with and without victims, were extracted from http://everytown.org/, containing all incidents from the period January 2013 to November 2014. Shultz: The database for the period 1990–2013 gathered by Shultz et al. Shultz and Cohen (2013) was updated with the Everytown database to include recent attacks with victims up to November 2014. USA Today: The database for the period 2006–July 2015 gathered by http://www.usatoday.com/, including all attacks with four or more victims. Active shootings: The date, size, age of the attacker and suicide result was obtained from the 2014 FBI report A Study of Active Shooter Incidents, 2000–2013 Blair and Schweit (2014). Twitter: 57 billions tweets were analyzed in the period 2010 to November 2014, extracting over 72 million tweets with the word “shooting”, 1.1 million with the words “shooting” and “school”, and 233 thousand with the words “mass” and “murder”.
Active shootings
We repeated the analysis with the 160 active shootings events from the FBI database Blair and Schweit (2014). In this case, the distribution of attack sizes does not follow a power law (Fig. S6A). However, this is likely due to the definition of active shooting, where attacks with a low number of casualties do not tend to be included in the study. In agreement with the results of the report Blair and Schweit (2014), we find a steady rise in the frequency of attacks (Fig. S6B). Consistent with our results of school shootings, the time between the two first attacks is a good indicator of the subsequent escalation pattern (Fig. S6C). We found an interaction between attacks (Fig. S6D), which can be attributed to the copycat effect, since the probability of an attack in the subsequent 8, 19 and 35 days is correlated with the number of tweets containing “shooting” (Fig. S6E), or “school” and “shooting” (Fig. S6F), but not “mass” and “murder” (Fig. S6G). We can define again Early and Late attacks (Fig. S7A), that correlate with Twitter activity (Fig. S7B–C). However, the size of the attacks in this case is not different for Early and Late attacks (Fig. S7D).
Finally, we analyzed the correlation between age, size, and suicide rates (Fig. S7E–G). We found a positive correlation between age and attack size (Fig. S7E). Teenagers (ages 12–18) correlate with small size events (Fig. S7E) and low suicide rates (Fig. S7F). Young attackers (ages 18–38) exhibit high suicide rates (Fig. S7F). The size of the attack is not well correlated with suicide rates, with the exception of attacks without victims (Fig. S7G).
Acknowledgements.
We are grateful for funding from the Vermont Complex Systems Center and use of the Vermont Advanced Computing Core. PSD was supported by NSF CAREER Grant No. 0846668.References
- Newman et al. (2004) K. Newman, C. Fox, D. J. Harding, J. Mehta, and W. Roth, Rampage: The social roots of school shootings (Perseus, New York, 2004).
- Flannery et al. (2013) D. J. Flannery, W. Modzeleski, and J. M. Kretschmar, Current Psychiatry Reports 15, 331 (2013).
- Kimmel and Mahler (2003) M. Kimmel and M. Mahler, American behavioral scientist , 1982 (2003).
- Leary et al. (2003) M. R. Leary, R. M. Kowalski, L. Smith, and S. Phillips, Aggressive Behavior 29, 202 (2003).
- Muschert and Carr (2006) G. W. Muschert and D. Carr, Journalism & Mass Communication Quarterly 83, 747 (2006).
- O’Toole (2000) M. E. O’Toole, The school shooter: A threat assessment perspective (DIANE Publishing, 2000).
- Levin and Madfis (2009) J. Levin and E. Madfis, American Behavioral Scientist 52, 1227 (2009).
- Wike and Fraser (2009) T. L. Wike and M. W. Fraser, Aggression and Violent Behavior 14, 162 (2009).
- Borum et al. (2010) R. Borum, D. G. Cornell, W. Modzeleski, and S. R. Jimerson, Educational Researcher 39, 27 (2010).
- Towers et al. (2015) S. Towers, A. Gomez-Lievano, M. Khan, A. Mubayi, and C. Castillo-Chavez, PLoS ONE 10, e0117259 (2015).
- Pah et al. (2017) A. R. Pah, J. Hagan, A. L. Jennings, A. Jain, K. Albrecht, A. J. Hockenberry, and L. A. Amaral, Nature Human Behaviour 1, 2 (2017).
- Muschert and Schildkraut (2017) G. Muschert and J. Schildkraut, “School Shootings in the Media,” (2017).
- Goh and Barabási (2008) K.-I. Goh and A.-L. Barabási, EPL (Europhysics Letters) 81, 48002 (2008).
- Johnson et al. (2013) N. F. Johnson, P. Medina, G. Zhao, D. S. Messinger, J. Horgan, P. Gill, J. C. Bohorquez, W. Mattson, D. Gangi, H. Qi, P. Manrique, N. Velasquez, A. Morgenstern, E. Restrepo, N. Johnson, M. Spagat, and R. Zarama, Scientific reports 3, 3463 (2013).
- Hawkes (1971) A. G. Hawkes, Biometrika 58, 83 (1971).
- Hawkes and Oakes (1974) A. G. Hawkes and D. Oakes, Journal of Applied Probability , 493 (1974).
- Laub et al. (2015) P. J. Laub, T. Taimre, and P. K. Pollett, arXiv preprint arXiv:1507.02822 (2015).
- Ogata (1988) Y. Ogata, Journal of the American Statistical association 83, 9 (1988).
- Marsan and Lengliné (2008) D. Marsan and O. Lengliné, Science 319, 1076 (2008).
- Hardiman et al. (2013) S. J. Hardiman, N. Bercot, and J.-P. Bouchaud, The European Physical Journal B 86, 1 (2013).
- Mohler et al. (2012) G. O. Mohler, M. B. Short, P. J. Brantingham, F. P. Schoenberg, and G. E. Tita, Journal of the American Statistical Association (2012).
- Lewis et al. (2012) E. Lewis, G. Mohler, P. J. Brantingham, and A. L. Bertozzi, Security Journal 25, 244 (2012).
- Johnson et al. (2011) N. F. Johnson, S. Carran, J. Botner, K. Fontaine, N. Laxague, P. Nuetzel, J. Turnley, and B. Tivnan, Science 333, 81 (2011).
- Rudnick and Gaspari (2010) J. Rudnick and G. Gaspari, Elements of the Random Walk (Cambridge University Press; 1 edition, 2010).
- Klafter et al. (1987) J. Klafter, A. Blumen, and M. F. Shlesinger, Physical Review A 35, 3081 (1987).
- Coleman (2004) L. Coleman, The copycat effect: How the media and popular culture trigger the mayhem in Tomorrow’s headlines (Simon and Schuster, 2004).
- Downs (1972) A. Downs, Public interest 28, 38 (1972).
- Rocque (2012) M. Rocque, The Social Science Journal 49, 304 (2012).
- Blair and Schweit (2014) J. P. Blair and K. W. Schweit, Texas State University and Federal Bureau of Investigation, U.S. Department of Justice, Washington D.C. (2014).
- Shultz and Cohen (2013) J. M. Shultz and A. M. Cohen, Disaster Health 1, 84 (2013).
Supporting Information