Broadband dispersion engineered microresonator on-a-chip
Control of dispersion in fibre optical waveguides is of critical importance to optical fibre communications systemsAgrawal_2007 ; Ainslie_1986 and more recently for continuum generation from the ultraviolet to the mid-infraredranka_2000_visible ; Reeves_2003_transformation ; Dudley_2006_Review ; petersen_2014_mid . The wavelength at which the group velocity dispersion crosses zero can be set by varying fibre core diameter or index stepCohen_1979 ; White_1979 ; tsuchiya1979dispersion ; Petermann_1983 ; Ainslie_1986 . Moreover, sophisticated methods to manipulate higher-order dispersion so as shape and even flatten dispersion over wide bandwidths are possible using multi-cladding fibrekawa_1974characteristics ; Miya_1981fabrication ; Cohen_1982QCfiber ; Jang_1982Exp ; bhagavatula_1983 ; Monerie_1982propagation ; QC_design_1984 . Here we introduce design and fabrication techniques that allow analogous dispersion control in chip-integrated optical microresonators, and thereby demonstrate higher-order, wide-bandwidth dispersion control over an octave of spectrum. Importantly, the fabrication method we employ for dispersion control simultaneously permits optical Q factors above 100 million, which is critical for efficient operation of nonlinear optical oscillators. Dispersion control in high Q systems has taken on greater importance in recent years with increased interest in chip-integrable optical frequency combsPascal_comb_Nature ; Pascal_2009NP ; Kippendberg_Diddams_review ; Pascal_2011_octave ; Okawachi_2011_SiN ; Herr_2012_NP ; Jiang_2012_PRL ; Coen_2013_modeling ; Chembo_2013_PRA ; Lamont_2013_SiNModel ; Pascal_2014_PRL ; Herr_2014_Solition ; Herr_2014_PRL_mode ; Papp_2014_Optica ; Pascal_2014_Arx ; Grudinin_2014micro ; Okawachi_2014_SiN ; Brasch_2014_SiN ; Xue_2014_dark ; Jost_2014_microwave .
High-Q microresonators, through cavity enhancement of an input field, enable many important optical devices and functionsVahala_2003_Nature . These applications include frequency comb generationPascal_comb_Nature ; Pascal_2009NP ; Kippendberg_Diddams_review ; Pascal_2011_octave ; Okawachi_2011_SiN ; Herr_2012_NP ; Jiang_2012_PRL ; Coen_2013_modeling ; Chembo_2013_PRA ; Lamont_2013_SiNModel ; Pascal_2014_PRL ; Herr_2014_Solition ; Herr_2014_PRL_mode ; Papp_2014_Optica ; Pascal_2014_Arx ; Grudinin_2014micro ; Okawachi_2014_SiN ; Brasch_2014_SiN ; Xue_2014_dark ; Jost_2014_microwave , pulse sourcesPeccianti_2012_NC ; Pasquazi_2012_OE , cascaded Raman lasersSpillane_2002_Raman ; Rong_2005_Raman , stimulated Brillouin lasersHansuek_2012_NP ; Buttner_2014_SBS and harmonic generation Carmon_2007_visible ; Levy_2011_OE . In many systems the control of modal dispersion is helpful or essential. This is particularly important in parametric oscillatorskippenberg_2004PRL ; grudinin_maleki_2009 where the local dispersion must be anomalous and in frequency microcombs where both the sign of the dispersion as well as its spectral shape are critical for comb operationKippendberg_Diddams_review ; Pascal_comb_Nature . Spectral bandwidth and coherent operation are strongly influenced by dispersion, and there has been remarkable progress in these areas, including sub-comb synchronizationPascal_2014_PRL ; Papp_2014_Optica ; Jiang_2012_PRL ; Pascal_2014_Arx , soliton generationHerr_2014_Solition ; Herr_2014_PRL_mode ; Brasch_2014_SiN ; Xue_2014_dark ; Jost_2014_microwave , and dispersive wave formationLamont_2013_SiNModel ; Okawachi_2014_SiN ; Coen_2013_modeling ; Brasch_2014_SiN .
There have been multiple approaches to engineer dispersion in microresonators. The control of waveguide width and height in Si3N4, diamond, MgF2, and CaF2 resonators alters geometric dispersionOkawachi_2011_SiN ; Okawachi_2014_SiN ; Grudinin_2014micro ; Hausmann_2014_diamond . HfO2-coated Si3N4 and oxidized Si resonators also provides dispersion controlRiemensberger_2012_OE ; Jiang_2014_Sidispersion .

This paper studies dispersion control in ultra-high-Q (UHQ) silica disks using a method that is inspired by dispersion engineering in optical fibres. By creating multi-wedge disks and precisely controlling their geometry during microfabrication, we have devised technique that lithographically controls higher-order dispersion over an octave of bandwidth. After introducing the approach and microfabrication method, resonator dispersion is measured at various bands from 960 nm to 2100 nm and compared with modeling to confirm dispersion control.
Results
Dispersion design principle. Optical fibre designers use multiple cladding layers to control both the magnitude, sign and spectral profile of the combined material and waveguide dispersionMiya_1981fabrication ; Jang_1982Exp ; Cohen_1982QCfiber ; bhagavatula_1983 . We devised a method for dispersion control in disk resonators that is analogous to these methods. Fig. 1a compares the dispersion of a single-wedge disk with that of a single-core optical fibre. Details on fabrication and basic properties of the single-wedge disk are contained in ref [43]. Briefly, the device is fabricated from thermal silica on silicon using lithography combined with wet and dry etching. In terms of dispersion control a key parameter is the wedge angle . The group index spectra of three resonators that differ only in their wedge angles are shown in the figure. The group index of bulk silica is also provided for comparison. In effect, the wedge angle introduces a component of normal dispersion that is stronger for smaller wedge anglesHansuek_2012_NP ; JiangLi_OE . By comparison, in the single-clad fibretsuchiya1979dispersion , the group index is varied (for fixed core diameter) through control of .
Fig. 1b shows the calculated optical mode in the single-wedge disk and the optical fibre to further understand the mechanism of dispersion control in each system. In the resonator, longer wavelength modes see their centroid of motion around the resonator shift inwards (i.e., smaller radii) so that the effective optical path is smaller. This is equivalent to normal dispersionHansuek_2012_NP ; JiangLi_OE . In the fibre, longer wavelength modes have a greater spatial overlap with the lower-index cladding. Greater contrast between the core and cladding indices therefore strengthens this normal contribution to dispersion.
This similarity between the resonator and fibre cases suggests a method to engineer dispersion in the resonator that is illustrated in the Fig. 1c. In the right-hand panel, the case of a multi-clad fibre is considered in relation to a resonator featuring multiple wedge angles. The multi-clad fibre can be understood by analyzing the dispersion in short and long-wavelength casesCohen_1982QCfiber . Short wavelength modes are confined primarily by the core region and experience a group index that is similar to a corresponding single core fibre. Longer wavelength modes are primarily confined by the secondary cladding layer. The corresponding spectral dependence of the group index can be understood as a transition between these two extreme cases (see spectrum for multi-clad fibre in Fig. 1c). The wavelength at which the transition occurs can be correspondingly engineeredkawa_1974characteristics ; Monerie_1982propagation ; QC_design_1984 . For example, by placing the outer, higher index region closer to the inner core, the transition will occur at shorter wavelengths.
Using analogous reasoning for the resonator, the case of a double-wedge resonator is considered in the left-hand panel of Fig. 1c. In this case, the shorter wavelength modes experience the outer, larger-angle wedge (=45∘) while the longer wavelength modes experience the inner, smaller wedge angle (=10∘). The spectral dependence of the group index thereby transitions between these two extreme cases. By controlling the specific wedge angles the long and short wavelength limiting behavior is controlled. Likewise, in analogy with the multi-clad fibre, the location of the wedge-angle transition allows control of the wavelength band over which the group index transitions between these two limits. As shown below, this concept can be extended to the design the group index of a quadruple-wedge disk which provides more flexibility in dispersion control over a wider range of wavelengths.
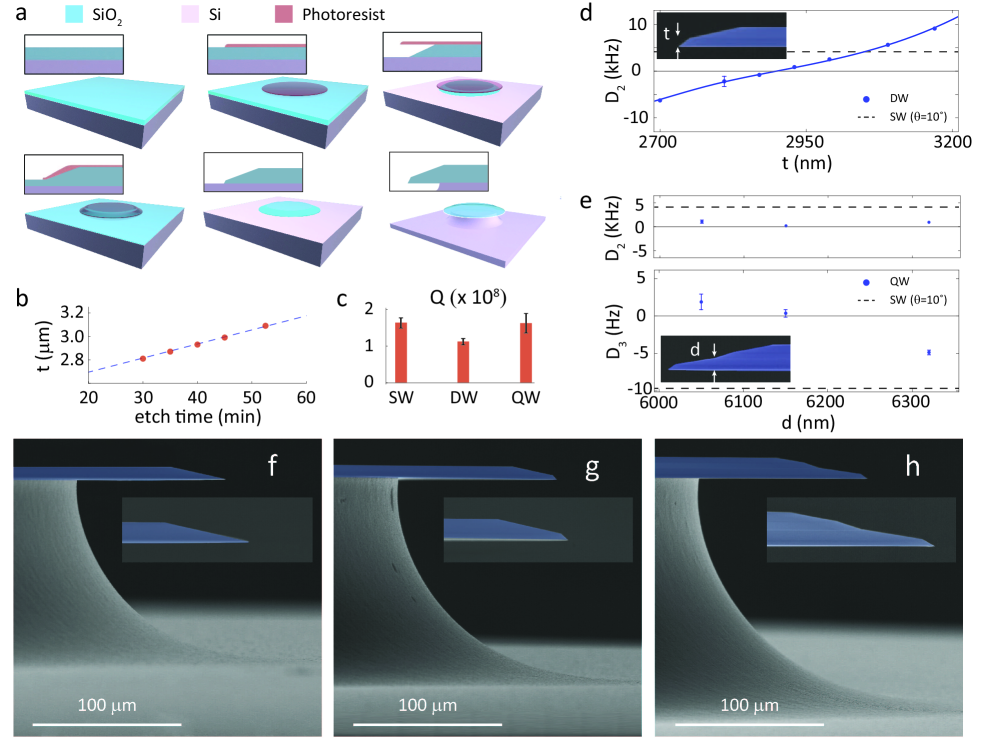
Device structure and fabrication process. The multi-wedge disk process is an extension of the techniques developed for the original single-wedge disk resonatorHansuek_2012_NP . Fabrication begins with thermally grown SiO2 on Si, which is then processed with photolithography and wet etching into single-wedge shaped disks (see top row in Fig. 2a) in which the wedge angle can be controlled from 8∘ to 55∘ (see Methods). A double-wedge (see lower row in Fig. 2a) is created through another cycle of thermal oxidation, photolithography and wet etching. During this second cycle, the angle of the additional wedge is adjusted as before and its height is controlled through the duration of etching. Calibrations have shown that the height increases at a rate of 10 nm/min (cf. Fig. 2b), resulting in the following spectral rates: FSR 400 kHz/min and FSR 300 Hz/min (cf. Fig. 2d). The process can be repeated to add additional wedges. A four wedge structure is shown in Fig. 2h. Because of the added complexity of the process, the optical Q factors of the multi-wedge structures are lower than for the single-wedge devices. Nonetheless, Q factors of 1.63, 1.12, 1.62 108 for single-, double-, and quadruple-wedge, respectively were achieved at 1550 nm.
Dispersion characterization. To characterize dispersion in the resonator we measure ( is mode index) in several wavelength bands and calculate which is related to the GVD parameter through the following expression:
| (1) |
where R is a resonator radiusJiang_2014_Sidispersion ; Pascal_2009NP . As a preliminary test of (at 1550 nm) control in double-wedge design, a series of the outer wedge heights (“t”, see inset) were fabricated with different wet etch times. A plot of the measured versus outer wedge height is provided in Fig. 2d, and the solid line is calculated using a finite element solver. increases as a function of etch duration at the average rate of 300 Hz/ min, and the measured has a standard deviation of 495 Hz from the finite-element-simulation resulting from the available precision in the atomic force microscope and the scanning electron microscope measurement of the resonator cross-section.
An additional interior wedge adds geometric dispersion (normal dispersion) in the spectral range that optical modes experience the new wedge angle. Fig. 2e shows measurements of and in such a structure plotted versus the parameter “d” (see inset in Fig. 2e). Here, we define higher order dispersion term as
| (2) |
where is the frequency at which the dispersion is measured and , , correspond to FSR, FSR per mode, and the third order dispersion parameterHerr_2014_Solition ; Herr_2014_PRL_mode . As shown in measurements below, the slope of dispersion curve at 1550 nm gets flatter () as “d” decreases and eventually becomes inverse () to the slope of material dispersion curve. In addition, the outer wedge height is also designed to keep consistent within a range of kHz.
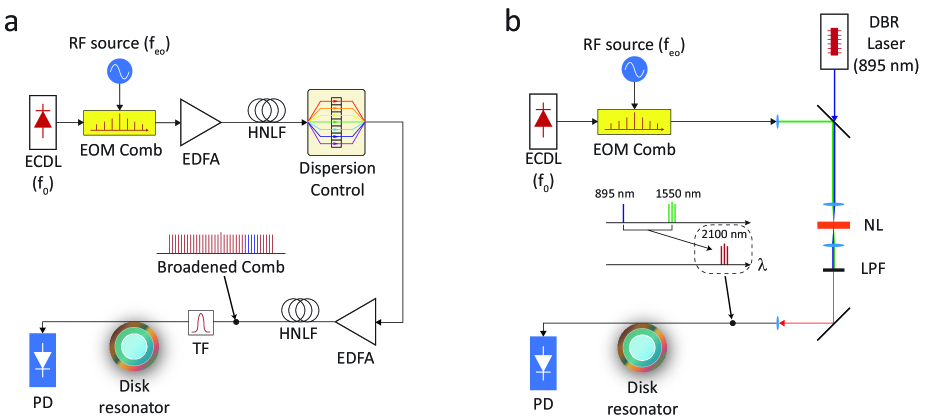
To measure the FSR quickly and over a broad range of wavelengths, we have modified a method reported in ref [52]. The measurement setup is shown in Fig. 3a and incorporates a frequency comb generated using electro-optical modulation (EOM) in conjunction with optical broadening using high nonlinearity fibre (HNLF). The seed laser for the EOM comb was a tunable laser that was scanned continuously during the measurement. Further details on this EOM comb are provided in ref [53]. The comb bandwidth was approximately 300 nm centered around 1550 nm and the line spacing was tunable and set to coincide approximately with the resonator FSR. A relatively narrow band of comb frequencies was coupled to the resonator using a tunable optical filter and the transmitted optical signals were measured using a photodetector. A measurement proceeded by first setting the tunable filter to a desired wavelength. The optical filter had a 3-dB-bandwidth of 3 nm so approximately 15 comb teeth would be launched to the resonator input port (the EOM comb line spacing was approximately 22 GHz). The photo detected signal was then observed as a time trace on an oscilloscope that was synchronized with the scanning seed laser. If the microwave frequency used to establish the EOM comb line spacing was set to exactly coincide with the FSR of the resonator at the selected wavelength, then a single transmission minimum would appear since the filtered comb teeth are all coupled to the neighboring resonances of the resonator. By slightly tuning the comb drive frequency away from the FSR value, the single transmission minimum would break up into many separate peaks since the comb teeth would now achieve resonance at slightly different points in the laser scan. The resolution in determination of the FSR by this method was estimated to be about 100 kHz. It is also important to note that the method provides an FSR value that is spectrally averaged since multiple comb teeth participate in the process. This fact tends to smooth the data with respect to effects like avoided-crossings of mode families. In addition to measurements in the 1500 nm band, the EOM comb was also shifted in wavelength to 2.1 by difference frequency generation using a 895 nm pump laser. Also, measurements of FSR using the technique reported in ref [52] were conducted at 980 nm and 1300 nm. Collectively, these measurements provided a very good picture of how dispersion could be modified through judicious cavity design.
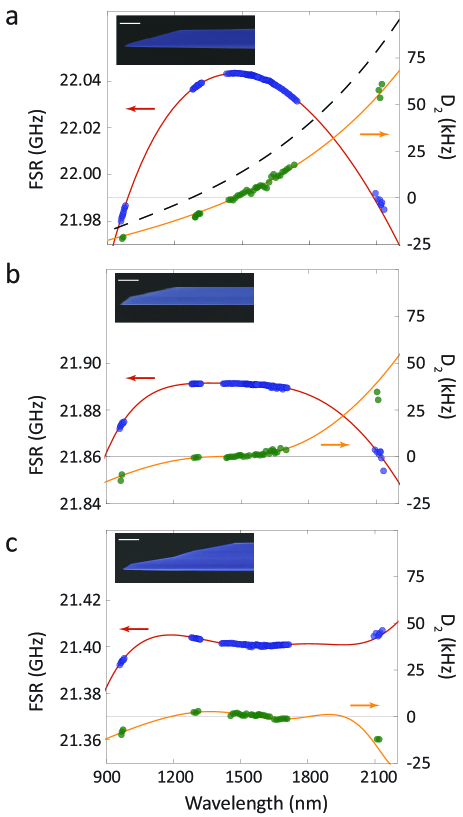
Fig. 4a-c show measured FSR, , and the results of simulations for the device structures provided in the insets. As has been noted in ref [52], a single wedge contributes geometrical dispersion that is both normal and approximately spectrally flat. Also, smaller wedge angles increase the strength of this contribution. In figure 4a, the zero dispersion wavelength (), has been shifted by this effect to 1.5 Hansuek_2012_NP ; JiangLi_OE (material dispersion has a near 1.3 ).
In the double wedge resonator (Fig. 4b) there is a gradual onset of the geometrical dispersion from shorter to longer wavelengths as a result of a steep outer wedge (low normal dispersion) to the shallow interior wedge (larger normal dispersion). The overall effect is to provide a flattening of the dependence of FSR on wavelength over a broad range of wavelengths. The dispersion in the transition is therefore reduced. The addition of additional wedges can be used to extend control to longer wavelengths. In the quadruple-wedge-design the additional interior wedges provide control out to 2 (Fig. 4c).
Conclusion
This study has proposed and tested a resonator dispersion control approach that is inspired by dispersion control methods in multi-cladding optical fibre. This approach provides the first method of controlling resonator dispersion over a broad range of wavelengths (equivalent to having control over high-order dispersion). The approach builds on the high-Q silica-on-silicon wedge-resonator fabrication by adding additional wedge angles to the resonator. The position of each wedge and its angle determine the wavelength location and strength of a corresponding contribution to normal dispersion. As a result, the approach is highly intuitive and when combined with numerical modeling provides a well controlled way to engineer dispersion over broad wavelength bands. Dispersion engineered high-Q resonators, as described here, will be useful in nonlinear resonator devices such as frequency microcombs. Moreover, the methods can also be applied in control of dispersion in nonlinear waveguide structures.
Methods
Device fabrication. The fabrication process was based on the previously described method for the chemically etched wedge-resonatorHansuek_2012_NP . Disk resonators were fabricated on (100) prime-grade float-zone silicon wafers. The first SiO2 layer was thermally grown at 1000∘C with a thickness in the range of 79 m, and photoresist was patterned using a KarlSuss MA-6 aligner on the oxide layer.
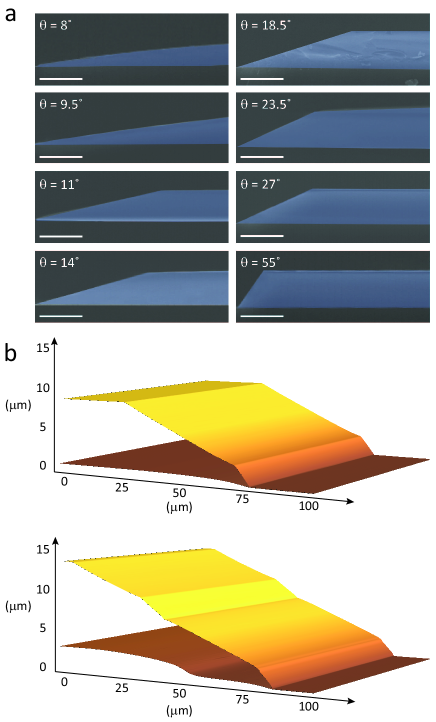
Hexamethyldisilazane (HMDS) was additionally deposited prior to photoresist coating for wedge angles larger than 20∘ (right column of Fig. 5a). For wedge angles in a range of 8∘20∘, photoresist was spin-coated on the oxide layer without HMDS (left column of Fig. 5a). Photoresist thickness was used to adjust the wedge angle. The photoresist pattern acted as an etch mask during immersion in a buffered hydrofluoric acid (HF) solution, and the resist was removed once wet etching was completed. The second SiO2 layer was grown at the same temperature as the etched wedge disk, and the thickness of the oxide was accurately controlled via duration of thermal oxidation. Again, the photoresist was patterned on the oxide layer and the wet etch proceeded to create additional wedge angles. After cleaning to remove photoresist and residues, XeF2 dry etch was applied to etch the Si.
Finite element simulation. The numerical calculations were implemented using the COMSOL multiphysics package. Fibre parameters used in the Fig.1 were from ref [8; 54; 17], and the values for fused silica refractive index were taken from the Sellmeir equation of ref [55]. Resonator dispersion was calculated via an iterative approachPascal_2009NP . Fig. 1a-b use a resonator thickness of 8 , and Fig. 1c-d use outer wedge heights of 3 and 5 for the angle ordering 45∘10∘ (red) and 10∘45∘ (blue), respectively. Fig. 4 uses a resonator geometry obtained from fabricated devices. Oxide thickness was measured using Filmetrics model F40 and Dektak 3ST profilometer, and the wedge profile was obtained using an atomic force microscope (Bruker Dimension ICON) and scanning electron microscope (Hitachi S-4100). Fig. 5b shows an atomic force microscope image of top and bottom surfaces of double-wedge and quadruple-wedge disks. The top surface profile was obtained from the disk before silicon dry etch (5th step in Fig. 2a), and then the silica disk was completely removed by BHF and the silicon surface morphology was scanned for the bottom surface profile.
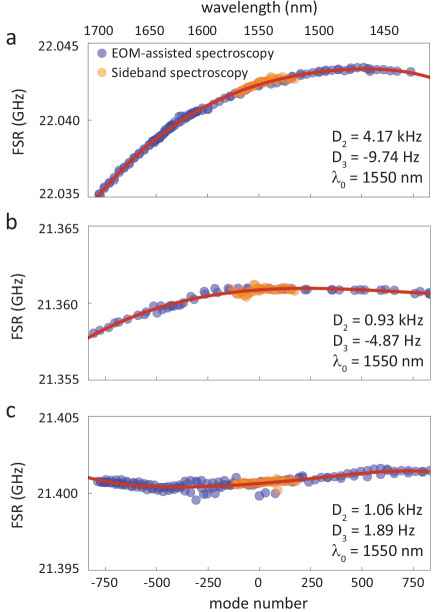
Dispersion parameters fitting. The resonance frequencies of one mode family can be described as a Taylor series shown in eqn.(2), and the coefficients of the series correspond to dispersion parameters at . The FSR can also be expressed as a Taylor series with the same coefficients in eqn.(2).
| (3) |
Fig. 6 shows the measured FSR of single-wedge and quadruple wedge structures (Fig.4), and the fitted polynomial curves (eqn.(3)) to the experimental results. Here, FSR was measured using both EOM-assisted (Fig. 3a, 300-nm-bandwidth) and sidebandJiangLi_OE (70-nm-bandwidth) spectroscopy methods. The variation of FSR is very small (10 kHz /mode), thus it is necessary to accumulate the variation of FSR throughout multiple FSRJiangLi_OE in order to fulfill the condition that where is the resolution in determination of the FSR (approximately 100 kHz).
Acknowledgments We gratefully acknowledge support from the Defense Advanced Research Projects Agency under the QuASAR program, the National Institute of Standards and Technology, the Kavli Nanoscience Institute and the Institute for Quantum Information and Matter, an NSF Physics Frontiers Center with support of the Gordon and Betty Moore Foundation.
Author Information Correspondence and requests for materials should be addressed to K.J.V. (vahala@caltech.edu).
Competing financial interests The authors declare no competing financial interests.
References
- (1) Agrawal, G. P. Nonlinear fiber optics (Academic press, 2007).
- (2) Ainslie, B. J. & Day, C. R. A review of single-mode fibers with modified dispersion characteristics. Lightwave Technology, Journal of 4, 967–979 (1986).
- (3) Ranka, J. K., Windeler, R. S. & Stentz, A. J. Visible continuum generation in air-silica microstructure optical fibers with anomalous dispersion at 800 nm. Optics letters 25, 25–27 (2000).
- (4) Reeves, W. et al. Transformation and control of ultra-short pulses in dispersion-engineered photonic crystal fibres. Nature 424, 511–515 (2003).
- (5) Dudley, J. M., Genty, G. & Coen, S. Supercontinuum generation in photonic crystal fiber. Reviews of modern physics 78, 1135 (2006).
- (6) Petersen, C. R. et al. Mid-infrared supercontinuum covering the 1.4–13.3 m molecular fingerprint region using ultra-high na chalcogenide step-index fibre. Nature Photonics 8, 830–834 (2014).
- (7) Cohen, L., Lin, C. & French, W. Tailoring zero chromatic dispersion into the 1.5 - 1.6 m low-loss spectral region of single-mode fibres. Electronics Letters 15, 334–335 (1979).
- (8) White, K. & Nelson, B. Zero total dispersion in step-index monomode fibres at 1.30 and 1.55 m. Electronics Letters 15, 396–397 (1979).
- (9) Tsuchiya, H. & Imoto, N. Dispersion-free single-mode fibre in 1.5 m wavelength region. Electronics Letters 15, 476–478 (1979).
- (10) Petermann, K. Constraints for fundamental-mode spot size for broadband dispersion-compensated single-mode fibres. Electronics Letters 19, 712–714 (1983).
- (11) Kawakami, S. & Nishida, S. Characteristics of a doubly clad optical fiber with a low-index inner cladding. Quantum Electronics, IEEE Journal of 10, 879–887 (1974).
- (12) Miya, T., Okamoto, K., Ohmori, Y. & Sasaki, Y. Fabrication of low dispersion single-mode fibers over a wide spectral range. Quantum Electronics, IEEE Journal of 17, 858–861 (1981).
- (13) Cohen, L., Mammel, W. & Jang, S. Low-loss quadruple-clad single-mode lightguides with dispersion below 2 ps/km nm over the 1.28 1.65 wavelength range. Electronics Letters 18, 1023–1024 (1982).
- (14) Jang, S., Cohen, L., Mammel, W. & Saifi, M. Experimental verification of ultra-wide bandwidth spectra in double-clad single-mode fiber. Bell System Technical Journal 61, 385–390 (1982).
- (15) Bhagavatula, V., Spotz, M., Love, W. & Keck, D. Segmented-core single-mode fibres with low loss and low dispersion. Electronics Letters 19, 317–318 (1983).
- (16) Monerie, M. Propagation in doubly clad single-mode fibers. Microwave Theory and Techniques, IEEE Transactions on 30, 381–388 (1982).
- (17) Etzkorn, H. & Heinlein, W. Low-dispersion single-mode silica fibre with undoped core and three f-doped claddings. Electronics Letters 20, 423–424 (1984).
- (18) Del’Haye, P. et al. Optical frequency comb generation from a monolithic microresonator. Nature 450, 1214–1217 (2007).
- (19) Del’Haye, P., Arcizet, O., Gorodetsky, M., Holzwarth, R. & Kippenberg, T. Frequency comb assisted diode laser spectroscopy for measurement of microcavity dispersion. Nature Photonics 3, 529–533 (2009).
- (20) Kippenberg, T. J., Holzwarth, R. & Diddams, S. A. Microresonator-based optical frequency combs. Science 332, 555–559 (2011).
- (21) Del’Haye, P. et al. Octave spanning tunable frequency comb from a microresonator. Physical review letters 107, 063901 (2011).
- (22) Okawachi, Y. et al. Octave-spanning frequency comb generation in a silicon nitride chip. Optics letters 36, 3398–3400 (2011).
- (23) Herr, T. et al. Universal formation dynamics and noise of kerr-frequency combs in microresonators. Nature Photonics 6, 480–487 (2012).
- (24) Li, J., Lee, H., Chen, T. & Vahala, K. J. Low-pump-power, low-phase-noise, and microwave to millimeter-wave repetition rate operation in microcombs. Physical review letters 109, 233901 (2012).
- (25) Coen, S., Randle, H. G., Sylvestre, T. & Erkintalo, M. Modeling of octave-spanning kerr frequency combs using a generalized mean-field lugiato–lefever model. Optics letters 38, 37–39 (2013).
- (26) Chembo, Y. K. & Menyuk, C. R. Spatiotemporal lugiato-lefever formalism for kerr-comb generation in whispering-gallery-mode resonators. Physical Review A 87, 053852 (2013).
- (27) Lamont, M. R., Okawachi, Y. & Gaeta, A. L. Route to stabilized ultrabroadband microresonator-based frequency combs. Optics letters 38, 3478–3481 (2013).
- (28) Del’Haye, P., Beha, K., Papp, S. B. & Diddams, S. A. Self-injection locking and phase-locked states in microresonator-based optical frequency combs. Physical review letters 112, 043905 (2014).
- (29) Herr, T. et al. Temporal solitons in optical microresonators. Nature Photonics 8, 145–152 (2014).
- (30) Herr, T. et al. Mode spectrum and temporal soliton formation in optical microresonators. Phys. Rev. Lett. 113, 123901 (2014).
- (31) Papp, S. B. et al. Microresonator frequency comb optical clock. Optica 1, 10–14 (2014).
- (32) Del’Haye, P. et al. Phase steps and resonator detuning measurements in microresonator frequency combs. Nature communications 6 (2015).
- (33) Grudinin, I. S. & Yu, N. Dispersion engineering of crystalline resonators via microstructuring. Optica 2, 221–224 (2015).
- (34) Okawachi, Y. et al. Bandwidth shaping of microresonator-based frequency combs via dispersion engineering. Optics Letters 39, 3535–3538 (2014).
- (35) Brasch, V. et al. Photonic chip based optical frequency comb using soliton induced cherenkov radiation. arXiv preprint arXiv:1410.8598 (2014).
- (36) Xue, X. et al. Mode interaction aided soft excitation of dark solitons in normal dispersion microresonators and offset-frequency tunable kerr combs. arXiv preprint arXiv:1404.2865 (2014).
- (37) Jost, J. et al. Microwave to optical link using an optical microresonator. arXiv preprint arXiv:1411.1354 (2014).
- (38) Vahala, K. J. Optical microcavities. Nature 424, 839–846 (2003).
- (39) Peccianti, M. et al. Demonstration of a stable ultrafast laser based on a nonlinear microcavity. Nature communications 3, 765 (2012).
- (40) Pasquazi, A. et al. Stable, dual mode, high repetition rate mode-locked laser based on a microring resonator. Optics express 20, 27355–27363 (2012).
- (41) Spillane, S., Kippenberg, T. & Vahala, K. Ultralow-threshold raman laser using a spherical dielectric microcavity. Nature 415, 621–623 (2002).
- (42) Rong, H. et al. An all-silicon raman laser. Nature 433, 292–294 (2005).
- (43) Lee, H. et al. Chemically etched, ulta-high-Q resonator on a chip. Nature Photonics 6, 369–373 (2012).
- (44) Büttner, T. F. et al. Phase-locking and pulse generation in multi-frequency brillouin oscillator via four wave mixing. Scientific reports 4 (2014).
- (45) Carmon, T. & Vahala, K. J. Visible continuous emission from a silica microphotonic device by third-harmonic generation. Nature Physics 3, 430–435 (2007).
- (46) Levy, J. S., Foster, M. A., Gaeta, A. L. & Lipson, M. Harmonic generation in silicon nitride ring resonators. Optics express 19, 11415–11421 (2011).
- (47) Kippenberg, T., Spillane, S. & Vahala, K. Kerr-nonlinearity optical parametric oscillation in an ultrahigh-q toroid microcavity. Physical Review Letters 93, 083904 (2004).
- (48) Grudinin, I. S., Yu, N. & Maleki, L. Generation of optical frequency combs with a caf 2 resonator. Optics letters 34, 878–880 (2009).
- (49) Hausmann, B., Bulu, I., Venkataraman, V., Deotare, P. & Lončar, M. Diamond nonlinear photonics. Nature Photonics 8, 369–374 (2014).
- (50) Riemensberger, J. et al. Dispersion engineering of thick high- silicon nitride ring-resonators via atomic layer deposition. Optics express 20, 27661–27669 (2012).
- (51) Jiang, W. C., Zhang, J., Usechak, N. G. & Lin, Q. Dispersion engineering of high-q silicon microresonators via thermal oxidation. Applied Physics Letters 105, 031112 (2014).
- (52) Li, J., Lee, H., Yang, K. Y. & Vahala, K. J. Sideband spectroscopy and dispersion measurement in microcavities. Optics express 20, 26337–26344 (2012).
- (53) Beha, K. et al. Coherent frequency multiplication from 10 ghz to 140 thz. In Frontiers in Optics, FTh2A–6 (Optical Society of America, 2014).
- (54) Miya, T., Terunuma, Y., Hosaka, T. & Miyashita, T. Ultimate low-loss single-mode fibre at 1.55 m. Electronics Letters 15, 106–108 (1979).
- (55) Malitson, I. Interspecimen comparison of the refractive index of fused silica. JOSA 55, 1205–1208 (1965).