TXTaffil
Systematic study of the experimental measurements on cross section and kinematic distribution in collisions at different energies
Abstract
The world experimental data on cross section and kinematic distribution in and collisions at = 6.8 - 7000 GeV are examined in systematic way. The dependence of the inclusive cross section, rapidity and transverse momentum distributions are studied phenomenologically. We explore empirical formulas to obtain the total cross section, rapidity and transverse momentum () distribution. This is crucial for the interpretation of AA results at RHIC when the reference data are not available. In addition, the cross section at mid-rapidity and transverse momentum distributions in collisions at = 39 and 62.4 GeV are evaluated.
I Introduction
Lattice QCD predicts that, under conditions of extremely high temperatures and energy densities, a phase transition or crossover from hadronic matter to a new form of matter, known as Quark Gluon Plasma (QGP) QGP_bib , will occur. The Relativistic Heavy Ion Collider (RHIC) was built to search for the QGP and to study its properties in laboratory through high-energy heavy-ion collisions starwhitepaper . Many observables have been proposed to probe the QGP created in heavy-ion collisions. Among them, the suppression caused by the color-charge screening in QGP is one of most important signatures QGP_jpsi .
Over the past twenty years, production in hot and dense medium has been a topic attracting growing interest. Suppression of production has been observed in various experimental measurements SPS_jpsi1 ; SPS_jpsi2 ; SPS_jpsi3 ; PHENIX_jpsi1 . A similar suppression pattern and magnitude of was observed at SPS and RHIC despite of huge collision energy difference. Furthermore, the is suppressed more in forward rapidity than that in midrapidity at RHIC 200 GeV AuAu collisions PHENIX_jpsi2 . These experimental observations suggest that, in addition to color screening, there exist other effects contributing to the modification of production. Cold nuclear matter (CNM) effects, the combined contribution of finite formation time and finite space-time extent of QGP and recombination from uncorrelated c and in the medium may account for these contributions 10_zebo . Among these contributions, the regeneration of from the recombination of c plays an important role to explain the similar suppressions at SPS and RHIC. As the collision energy increases, the regeneration of from the larger charm quark density would also increase which partly compensates for the additional suppression from color-screening. The regeneration also expects a stronger suppression at forward rapidity at RHIC where the charm quark density is lower than that at midrapidity. At LHC, the is less suppressed in both mid-rapidity and forward rapidity than that at RHIC LHC_jpsi1 ; LHC_jpsi2 , which may indicate that the regeneration contribution is dominant in the production at LHC energies. Measurements of in different collision energies at the Solenoidal Tracker at RHIC (STAR) can give us indications on the balance of these mechanisms for production and medium properties.
To qualify the medium effects on the modification of production, the knowledge of cross section and kinematics in collision is crucial to offer a reference. During RHIC year 2010, STAR has collected abundant events of AuAu collisions at and 62.4 GeV, while the reference data in collisions is not in the schedule of RHIC run plan. As what we did in ref upsilon_paper , we study the world-wide data to obtain the reference at these collision energies.
In this letter,we report an interpolation of the -integrated and differential inclusive cross section in collisions at mid-rapidity to 39 and 62.4 GeV. We establish a strategy to estimate the inclusive cross section and kinematics at certain energy points, which makes the calculation of the nuclear modification factors for any colliding system and energy at RHIC possible. The extrapolation is done in three steps. The first step is an energy interpolation of the existing total cross section measurements. The second step is the description of the energy evolution of the rapidity distribution. The last step is the evaluation of the energy evolution of the transverse momentum distribution.
II Available experimental results treatment
The measurements of hadroproduction have been performed for about forty years. In such a long period, different experimental techniques have been utilized and different input information was available at the time of the measurements. Therefore, comparison of different experimental results on an equal footing needs an update of the published values on several common assumptions and aspects. For example, the branching ratio of (or ) have changed with time; the assumed functional forms for the and shapes, which can be used to infer the total production, are different in different measurements; and the treatment of the nuclear effects are not homogeneous. In this section, we update all the results with the current best knowledge of branching ratios, kinematics and nuclear effects.
The cross section for on a nuclear target is often characterized by a power law:
| (1) |
where is the proton-nucleon cross section and is the corresponding proton-nucleus cross section for a target of atomic mass number .
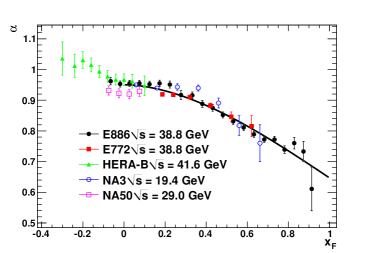
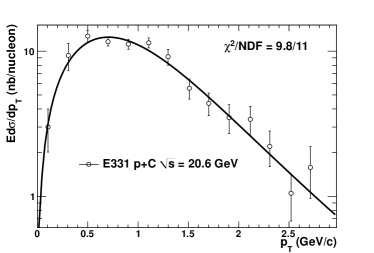
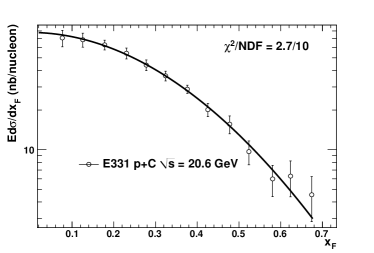
The dependence of on measured by NA3 alpha_na3 , NA50 alpha_na50 , E772 alpha_E772 , E886 alpha_E886 and HERA-B alpha_HERA-B is shown in Fig. 1, where is defined as ( is longitudinal momentum, along the beam direction.). No significant energy dependence of as a function of is observed within uncertainties, thus we assume it is independent of the cms-energy (). The results of at can be represented for convenience by the simple parametrization shown as solid line in Fig. 1: . If an experiment has published cross sections of in proton nucleus collisions, Eq. 1 and the solid curve in Fig. 1 is applied to obtain the corresponding cross section in proton nucleon collisions. Some of the experimental measurements are only quoted for a limited phase-space. To obtain the total cross sections, the functional forms of and spectrum shapes utilized for extrapolation are: ,and respectively, where a, b, and c are free parameters. As illustrated in Fig. 2, these two functional forms describe the and spectra very well. All the measurements are updated with the latest branching fractions ( for , for ) PDG . The treated results on cross sections are listed in Tab. 1.They show a good overall consistency, even though some of them contradict with each other. For example, the two measurements (E331 and E444) at 20.6 GeV deviate from each other by roughly 2. The E705 measurement at 23.8 GeV is higher than the UA6 one at 24.3 GeV by more than 2.
| Experiment | Reaction | (GeV) | (nb/nucleon) |
|---|---|---|---|
| CERN-PS CERN-PS | p+A | 6.8 | 0.7320.13 |
| WA39 WA39 | p+p | 8.7 | 2.351.18 |
| IHEP IHEP | p+Be | 11.5 | 21.635.64 |
| E331 E331 | p+Be | 16.8 | 85.1521.30 |
| NA3 alpha_na3 | p+Pt | 16.8 | 95.017.0 |
| NA3 alpha_na3 | p+Pt | 19.4 | 122.621 |
| NA3 alpha_na3 | p+p | 19.4 | 12022 |
| E331 E331_1 | p+C | 20.6 | 27832.8 |
| E444 E444 | p+C | 20.6 | 176.523.3 |
| E705 E705 | p+Li | 23.8 | 271.5129.84 |
| UA6 UA6 | p+p | 24.3 | 171.4222.21 |
| E288 E288 | p+Be | 27.4 | 294.1273.53 |
| E595 E595 | p+Fe | 27.4 | 26456 |
| NA38/51 NA38 ; NA51 | p+A | 29.1 | 229.534.4 |
| NA50 alpha_na50 | p+A | 29.1 | 250.737.6 |
| E672/706 E672 | pBe | 31.6 | 343.0775.12 |
| E771 E771 | p+Si | 38.8 | 359.134.2 |
| E789 E789 | p+Au | 38.8 | 415.04100 |
| ISR ISR52 | p+p | 52 | 716303 |
| PHENIX PHENIX200 | p+p | 200 | 4000938 |
| CDF CDF1960 | p+ | 1960 | 225603384 |
| ALICE ALICE2760 | p+p | 2760 | 29912.65384.3 |
| ALICE ALICE7000 | p+p | 7000 | 54449.48494 |
III Results
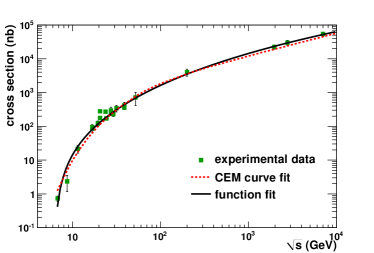
The energy evolution of the total inclusive production cross section in proton induced interactions is shown in Fig. 3. The first approach is to use the predicted shape in the Colour Evaporation Model at Next to Leading Order (NLO) CEM to describe the energy dependence of cross section. The central CT10 parton density set PDF_CT10 and set is utilized in the predicted shape, where m is the charm quark mass, is the factorization scale, is the renormalization scale. The fit is defined such that the normalization of the NLO CEM calculation is left as a free parameter (): . The second approach is to use a functional form to describe the cross section energy evolution: , where , a, b, c and d are free parameters. As shown in Fig. 3, both approaches can describe the energy evolution trend of cross section. The for CEM and functional fit are 90.5/22 and 76.7/20, respectively. The large mainly comes from three experimental points which contradict with the common trend (E331 and E444 measurements at 20.6 GeV, E705 measurement at 23.8 GeV). If we exclude these three data points and refit the results, the for CEM and functional fit are 41.1/19 and 16.7/16, respectively. The values extrapolated (without the three bad experimental points) for the cross sections at 39 and 62.4 GeV, utilizing the functional form and the NLO CEM based fit are listed in Table 2.
| Fit | cross section (nb/nucleon) | |
|---|---|---|
| 39 GeV | 62.4 GeV | |
| NLO CEM | 42520 | 94142 |
| function | 44530 | 99566 |
| evaluated results | 4453020 | 9956654 |
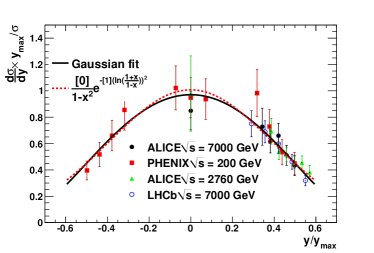
The knowledge of the rapidity dependence of production at different cms-energies is crucial to obtain a reference for the measurements at mid-rapidity from RHIC. Based on a universal energy scaling behavior in the rapidity distribution obtained at different cms-energies, we explore approaches to the extrapolation of the rapidity distribution. As shown in Fig. 4, the y-differential cross sections at different cms-energies have been normalized by the total cross section, and the normalized values are plotted verse , where has been previously defined. Despite of huge cms-energy difference, the treated RHIC PHENIX200 and LHC ALICE2760 ; ALICE7000 ; LHCb7000 experimental distributions fall into a universal trend, which allows us to perform global fits to all the experimental results with suitable functions. Two functional forms are chosen to do the fits: one is Gaussian function, the other one is , where a and b are free parameters. Both of them can describe the global distribution very well( for gaussian fit, for the other fit). With the extrapolated cross sections and rapidity distributions, the predicted cross section times branching ratio at 39 and 62.4 GeV in mid-rapidity are and nb, respectively. The uncertainties include statistical and systematic uncertainties. These values are highly consistent with the estimations from CEM model ( nb for 39 GeV, for 62.4 GeV).
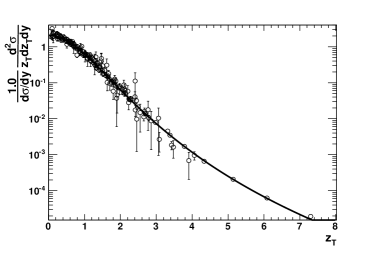
The energy evolution of transverse momentum distribution are also studied via available experimental measurements from 10 - 7000 GeV alpha_na3 ; E288 ; E672 ; E331_1 ; PHENIX200 ; ALICE7000 ; CDF1960 ; ISR53 . We use part of the world-wide fixed-target data (with only p, Be, Li, and C respectively) measured with incident protons. In this way, we avoid uncertainties due to ignoring any cold nuclear matter effects on the transverse momentum distributions. To compare the different experimental measurements at different energies and rapidity domains, as shown in Fig. 5, the transverse momentum distributions are normalized by their -integrated cross sections and plotted verse the variable, which is defined as . The treated distributions follow a universal trend despite of the different cms-energies and rapidity domains. We can describe the global distributions very well by the following function: function , where , , and n is the only free parameter. From the fit, we obtain with .
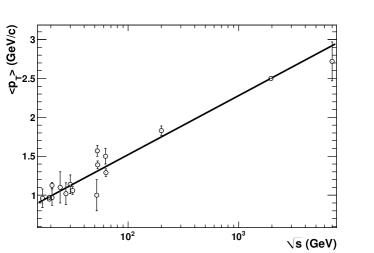
With the universal shape and information at certain energy and rapidity domain (we focus on mid-rapidity), we can extrapolate the transverse momentum distribution at any cms-energy. Thus the next step is to evaluate the energy evolution of . The at mid-rapidity as a function of cms-energy from world-wide experiments alpha_na3 ; E288 ; E672 ; E331_1 ; PHENIX200 ; ALICE7000 ; CDF1960 ; ISR53 ; ISR30 ; ISR52 is shown in Fig. 6. Also, only part of the world-wide fixed-target data (with p, Be, Li, and C respectively) are used to reduce the cold nuclear matter effects. The versus energy can be fitted by the function form: , where p, q are free parameters. The fit parameters are , with . The estimated from the fit function at 39 and 62.4 GeV are and GeV/c, respectively. With these inputs, the transverse momentum distribution at these two cms-energies can be completely determined.
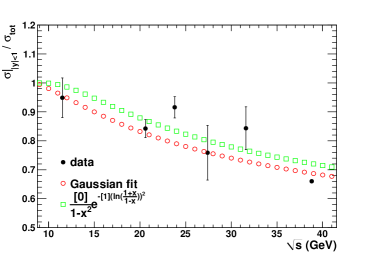
There are rare rapidity distribution measurements in pA collisions at . Therefore, the universal energy scaling parameters of rapidity distributions are determined by the measurements at GeV. Its validity at low energy (200 GeV) range still need to be further investigated. But we do have various distribution measurements of in fix-target experiments IHEP ; E331_1 ; E444 ; E595 ; E705 ; E672 ; E771 ; E789 . Cooperated with the verse curve in Fig. 1 and the transverse momentum distributions obtained using the strategy described in the above section, we can evaluate the rapidity distributions via the distributions measurements in the fix-target experiments to check the validity of the rapidity interpolation method. The ratios of to , which are calculated utilizing the evaluated rapidity distributions in fix-target experiments, verse cms-energy are shown in Fig. 7. The open points plotted in the figure are the estimations using the two fit functions in Fig. 4. In this figure, we can see that our extrapolation strategy also works at low cms-energy range.
IV summary
We study the world-wide data of production and kinematics at GeV. We have developed a strategy to interpolate the cross section, rapidity distribution, and transverse momentum distribution at any cms-energy in GeV. The rapidity and transverse momentum distributions measured in different energies have a universal energy scaling behavior. With this strategy, we predicted that the cross section times branching ratio at 39 and 62.4 GeV in mid-rapidity are , nb, respectively.
V Acknowledgments
We express our gratitude to the STAR Collaboration and the RCF at BNL for their support. This work was supported in part by the U.S. DOE Office of Science under the contract No. DE-SC0012704; authors Wangmei Zha and Chi Yang are supported in part by the National Natural Science Foundation of China under Grant Nos 11005103 and 11005104, China Postdoctoral Science Foundation funded project, and the Fundamental Research Funds for the Central Universities.
References
- (1) P. Braun-Munzinger, J. Stachel, Nature 448, 302 (2007).
- (2) J. Adams et al. (STAR Collab.), Nucl. Phys. A 757, 102 (2005).
- (3) T. Matsui, H. Satz, Phys. Lett. B 178, 416 (1986).
- (4) M.C. Abreu et al., Phys. Lett. B 477, 28 (2000).
- (5) B. Alessandro et al., Eur. Phys. J. C 39, 335 (2005).
- (6) B. Alessandro et al., Eur. Phys. J. C 48, 329 (2006).
- (7) A. Adare et al., Phys. Rev. Lett. 98, 232301 (2007).
- (8) A. Adare et al., Phys. Rev. C 84, 054912 (2011).
- (9) F. Karsch et al. Phys. Lett. B 193, 105 (1987)
- (10) B. Abelev et al., Phys. Rev. Lett. 109, 072301 (2012).
- (11) B. Abelev et al., Phys. Lett. B 734, 314 (2014).
- (12) Phys. Rev. C 88, 067901 (2013).
- (13) J. Badier et al., Z. Phys. C 20, 101 (1983).
- (14) B. Alessandro et al. (NA50 Collab.), Eur. Phys. J. C 33, 31 (2004).
- (15) D. M. Alde et al., Phys. Rev. Lett. 72, 1318 (1994).
- (16) M. J. Leitch et al., Phys. Rev. Lett.84, 3256 (2000).
- (17) I. Abt et al., Eur. Phys. J. C 60, 525 (2009).
- (18) K. A. Olive et al., Chin. Phys. C 38, 090001 (2014).
- (19) A. Bamberger et al., Nucl. Phys. B 134, 1 (1978).
- (20) M. J. Corden et al., Phys. Lett. B 98, 220 (1981).
- (21) Yu. M. antipov et al., Phys. Lett. B 60, 309 (1976).
- (22) K. J. Anderson et al., Phys. Rev. Lett. 36, 237 (1976).
- (23) J. G. Branson et al., Phys. Rev. Lett. 38, 1331 (1977).
- (24) K. J. Anderson et al., Phys. Rev. Lett. 42, 944 (1979).
- (25) L. Antoniazzi et al., Phys. Rev. D 46, 4828 (1992).
- (26) C. Morel et al., Phys. Lett. B 252, 505 (1990).
- (27) H. D. Snyder et al., Phys. Rev. Lett. 36, 1415 (1976).
- (28) E. J. Siskind et al., Phys. Rev. D 21, 628 (1980).
- (29) L. Antoniazzi et al., Phys. Rev. D 46, 4828 (1992).
- (30) M. C. Abreu et al., Phys. Lett. B 444, 516 (1998).
- (31) M. C. Abreu et al., Phys. Lett. B 438, 35 (1998).
- (32) A. Gribushin et al., Phys. Rev. D 62, 012001 (2000).
- (33) T. Alexopoulos et al., Phys. Rev. D 55, 3927 (1997).
- (34) M. H. Schub et al., Phys. Rev. D 52, 1307 (1995).
- (35) E. Nagy et al., Phys. Lett. B 60, 96 (1975).
- (36) A. Adare et al. (PHENIX Collab.), Phys. Rev. Lett. 98, 232002 (2007).
- (37) D. Acosta et al. (CDF Collab.), Phys. Rev. D 71, 032001 (2005).
- (38) B. Abelev et al. (ALICE Collab.), Phys. Lett. B 718, 295 (2012).
- (39) K. Aamodt et al. (ALICE Collab.), Phys. Lett. B 704, 442 (2011).
- (40) R. E. Nelson, R. Vogt, and A. D. Frawley et al., Phys. Rev. C 87, 014908 (2013).
- (41) H. L. Lai et al., Phys. Rev. D 82, 074024 (2010).
- (42) R. Aaij et al. (LHCb Collab.), Eur. Phys. J. C 71, 1645 (2011).
- (43) F. Bossu et al., arXiv:1103.2394 [nucl-ex].
- (44) B. Aubert et al. , Nucl. Phys. B 1421, 29 (1978).
- (45) E. Nagy et al., Phys. Lett. B 60, 96 (1975).
- (46) E. Amaldi et al., Nuovo Cim. 19, 152 (1977).