Galaxy And Mass Assembly (GAMA): A study of energy, mass, and structure (1kpc-1Mpc) at
Abstract
The GAMA survey has now completed its spectroscopic campaign of over 250,000 galaxies (mag), and will shortly complete the assimilation of the complementary panchromatic imaging data from GALEX, VST, VISTA, WISE, and Herschel. In the coming years the GAMA fields will be observed by the Australian Square Kilometer Array Pathfinder allowing a complete study of the stellar, dust, and gas mass constituents of galaxies within the low-z Universe (). The science directive is to study the distribution of mass, energy, and structure on kpc-Mpc scales over a 3billion year timeline. This is being pursued both as an empirical study in its own right, as well as providing a benchmark resource against which the outputs from numerical simulations can be compared. GAMA has three particularly compelling aspects which set it apart: completeness, selection, and panchromatic coverage. The very high redshift completeness (%) allows for extremely complete and robust pair and group catalogues; the simple selection (mag) minimises the selection bias and simplifies its management; and the panchromatic coverage, 0.2m - 1m, enables studies of the complete energy distributions for individual galaxies, well defined sub-samples, and population assembles (either directly or via stacking techniques). For further details and data releases see: http://www.gama-survey.org
1International Centre for Radio Astronomy Research (ICRAR), School of Physics, University of Western Australia, Crawley, Perth, WA 6009, Australia; Simon.Driver@uwa.edu.au
2SUPA, School of Physics and Astronomy, University of St Andrews, North Haugh, St Andrews, Fife, KY16 9SS, UK, spd3@st-and.ac.uk
1 Introduction
Extra-galactic studies, in and around the 21st century, can arguably be broken down into four distinct categories: Focused experiments (e.g., WiggleZ, BOSS, DES, Euclid); high-fidelity studies of well selected sub-samples (e.g., S4G, ATLAS3D, MANGA etc); frontier studies (e.g., HDF, UDF, Frontier’s fields); and open-ended legacy studies (e.g., 2MASS, SDSS, COSMOS, GEMS, CANDLES). These distinct approaches are all important and highly complementary. The Galaxy And Mass Assembly survey (GAMA; Driver et al. 2011), very much fits into the latter category, by providing a broad legacy resource to the community, with a key focus on being comprehensive and complete. GAMA, like its predecessors the SDSS and 2MASS, is now forming the basis for high-fidelity follow-on studies (e.g., SAMI/IFU, ASKAP/DINGO, Euclid Legacy Science), and even frontier studies (e.g., HST lens sample, JWST usage of GAMA groups as probes to ). Internally the GAMA team now consists of over 100 scientists studying the distribution and evolution of mass, energy, and structure with data also flowing through to external teams fueling collaborative projects.
2 Galaxy And Mass Assembly
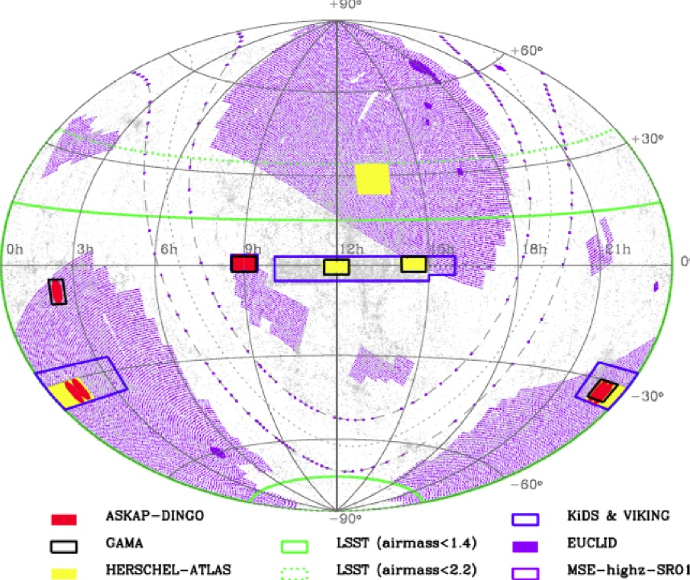
The GAMA survey covers four 60 sq deg regions (3 equatorial, 1 southern), plus an additional 20 sq deg region (i.e., 260sq deg in total), see Fig. 1 & 2. The three primary equatorial blocks: G09, G12 and G15 lie within the SDSS Main survey providing the key input catalogue to the spectroscopic campaign. The input cat for the G02 region is CFHTLS-W1 and the input cat for the southern block (G23) is provided by VST KiDS. In due course all regions will be covered by VST KiDS to comparable depth. Details on the equatorial sample selection are provided in Baldry et al. (2010) and essentially rely on size and flux cuts augmented by near-IR colours used to recoup compact systems.
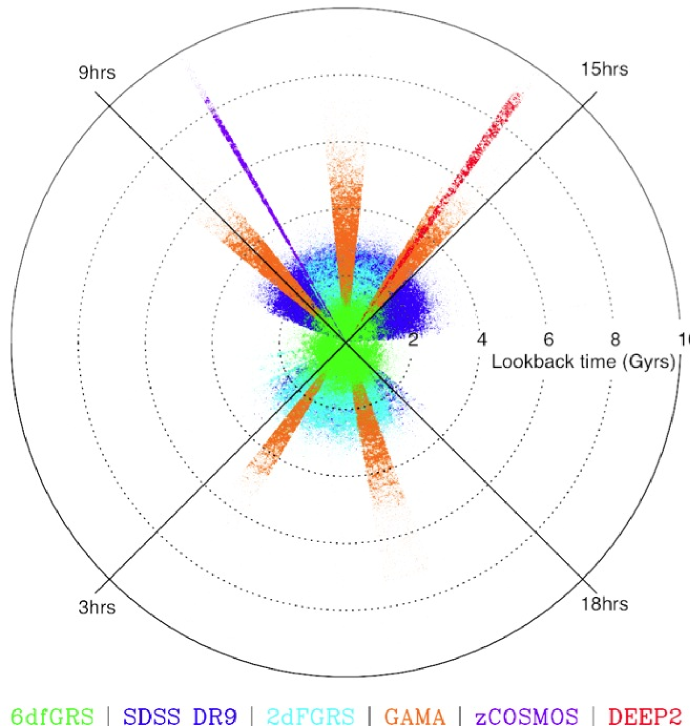
The spectroscopic observations were conducted over a period of 210 nights spanning 5years using the AAOmega spectrographs coupled to the 2dF fibre-optic positioning system (, 400 fibres, 3700-9000Å) mounted on the Anglo-Australia Telescope. Details of the observing strategy, spectroscopic reduction pipeline, and data releases are described in Robotham et al. (2010), Hopkins et al. (2013), Driver et al. (2011) and Liske et al. (2015). The current catalogue comprises a sample of over 250,000 galaxies with % spectroscopic completeness (r.f., SDSS, 85% and zCOSMOS, 60%). Fig. 2 highlights the portion of the Universe surveyed by GAMA, extending 5Gyrs outwards in lookback time in the five distinct regions. Also shown on Fig. 2 are the other surveys one can consider as complete (i.e., unbiased selections).
3 Stellar Masses and Galaxy Groups
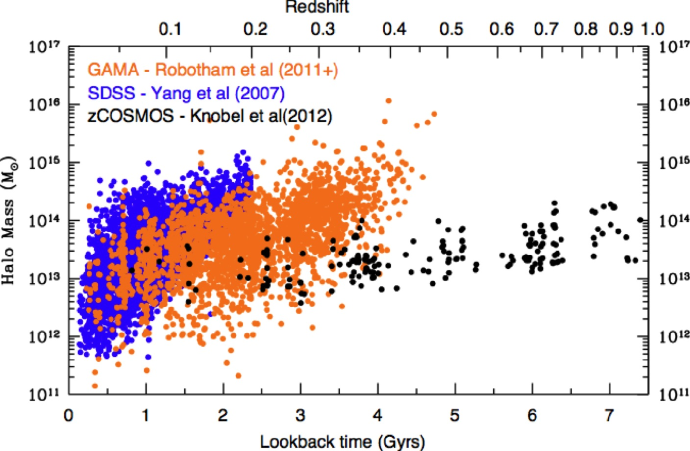
Two of the key GAMA catalogues produced to date are the stellar mass catalogue (Taylor et al. 2013), and the galaxy group and pair catalogue (Robotham et al. 2011). Fig. 3 shows the halo mass-redshift plane sampled by the GAMA group catalogue compared to those derived from SDSS and zCOSMOS. GAMA complements both surveys helping to bridge the gap between the very near and very far Universe. Both the stellar mass and group catalogues have been central in a number of defining studies including the best current estimate of the local galaxy stellar mass function (Baldry et al. 2012), the galaxy stellar-mass function subdivided by morphological type (Kelvin et al. 2013), the recalibration of the local mass-size relations (Lange et al. 2015), the construction of filament and tendril catalogues (Alpaslan et al. 2014a,b), the identification of local group analogues (Robotham et al. 2014), the measurement of the low-z merger rate (Robotham et al. 2014), and the propensity for major and minor mergers to induce/suppress star-formation (Davies et al. 2015). In the near future the group catalogue will be used to provide the definitive measurement of the halo mass function; a key test of the dark-matter paradigm with the potential to constrain the particle mass to keV scales. High mass compact groups at intermediate redshifts provide the optimal gravitational probes of the very high-z Universe, and guaranteed-time observations of selected GAMA groups are planned with the James Webb Space Telescope.
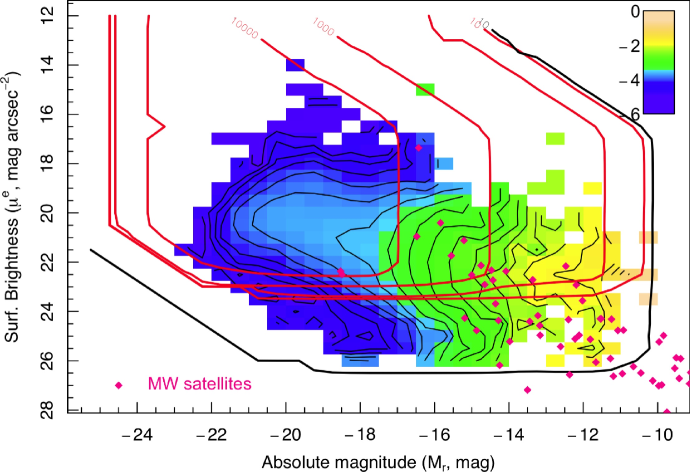
One current limitation of GAMA is its dependency on SDSS for the input catalogue definition, introducing a bright surface brightness selection limit mag/sq arcsec. Fig. 4 shows the space-density of galaxies in the luminosity-surface brightness plane (unpublished). This plane is critical for managing and assessing the selection boundaries dictated by the flux limit, surface brightness limit, sky smoothing, and spatial sampling (see Driver 1999 and Driver et al. 2005 for details). The red lines on Fig. 4 indicate iso-volume contours outside of which we cannot be certain that our sample is complete. We see from Fig. 4 that GAMA (and similarly for all other local surveys) hits the selection boundaries at the giant-dwarf boundary (i.e., ballpark LMC luminosity/mass). In fact only a very small portion of the parameter space over which galaxies are known to exist is well sampled in a cosmologically representative manner. Extending these boundaries is critical. VST KiDS is currently surveying the GAMA regions and will extend the low surface brightness boundary to mag/sq arcsec (Fig. 4, black line), very much opening our observing window into the luminous low surface brightness Universe. Extending to very low luminosities/masses is however trickier, and one of the goals of the next generation WAVES survey (Driver et al. 2015).
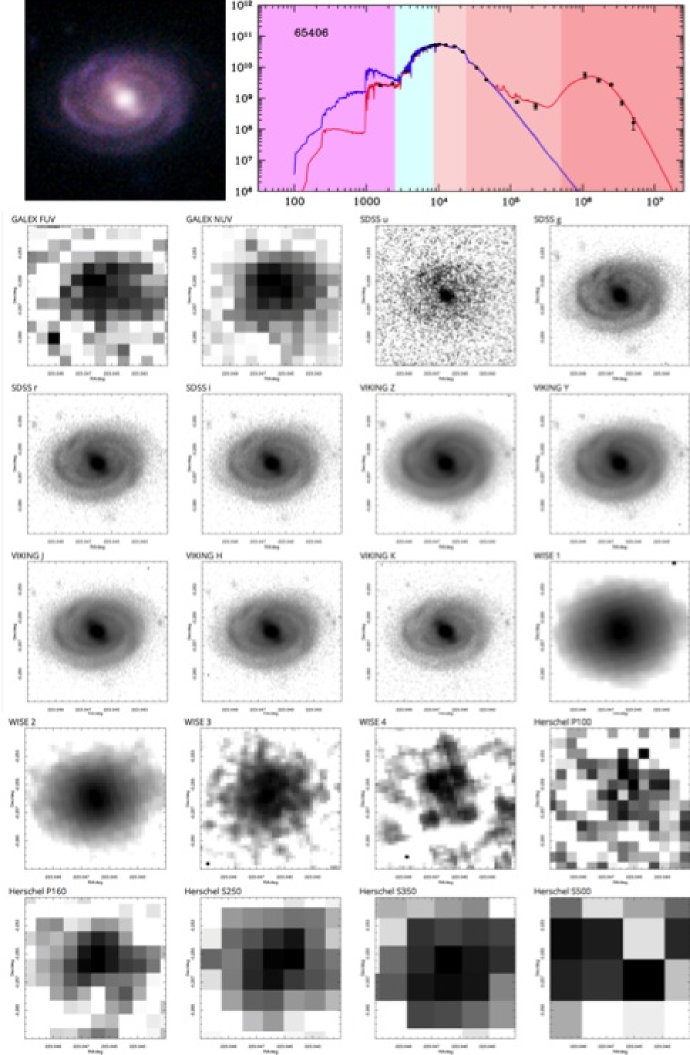
We finish by once again highlighting the remarkable panchromatic coverage of GAMA. Fig. 5 shows an example of the 21-band photometry for just one of the 250k galaxies in our sample, along with a MAGPHYS fit to the data. In the near future the GAMA fields will be surveyed with the Australian Square Kilometer Array providing crucial insight into the neutral gas domain and continuum emission from 20-40cm.
4 Summary
GAMA is now reaching maturity by providing high quality data products for direct empirical studies, from which well defined sample can be drawn and against which numerical models can be tested. Moreover GAMA is now poised to move forward into new territory pushing the selection boundaries back in a comprehensive, complete and systematic manner. Data releases (DR1, DR2 and PDR) are available via http://www.gama-survey.org or feel free to contact us via gama@eso.org.
References
Alpaslan M., et al., 2014a, MNRAS, 440, 106 Alpaslan M., et al., 2014b, MNRAS, 438,177 Baldry I.K., et al., 2010, MNRAS, 404, 86 Baldry I.K., et al., 2012, MNRAS, 421, 621 Davies L., et al., 2015, MNRAS, submitted Driver S.P., et al., 2011, MNRAS, 413, 971 Driver S.P., 1999, ApJ, 526, 69 Driver S.P., 2005, MNRAS, 360, 81 Driver S.P., 2015, ASSP, in press Lange R., et al., 2015, MNRAS, 447, 2603 Liske J., et al., 2015, MNRAS, in press Hopkins A., et al., 2013, 430, 2047 Kelvin L., et al., 2014, MNRAS, 444, 1647 Robotham A.S.G., et al., 2010, PASA, 27, 76 Robotham A.S.G., et al., 2011, MNRAS, 416, 2640 Robotham A.S.G., et al., 2012, MNRAS, 416, 2640 Robotham A.S.G., et al., 2013, MNRAS, 416, 2640 Taylor E. et al., et al., 2013, MNRAS, 418, 1587
Acknowledgments
GAMA is a joint European-Australasian project based around a spectroscopic campaign using the Anglo-Australian telescope. The GAMA input catalogue is based on data taken from the Sloan Digital Sky Survey and the UKIRT Infrared Deep Sky Survey.