A Two-ribbon White-light Flare Associated with a Failed Solar Eruption Observed by ONSET, SDO, and IRIS
Abstract
Two-ribbon brightenings are one of the most remarkable characteristics of an eruptive solar flare and are often used for predicting the occurrence of coronal mass ejections (CMEs). Nevertheless, it was called in question recently whether all two-ribbon flares are eruptive. In this paper, we investigate a two ribbon-like white-light (WL) flare that is associated with a failed magnetic flux rope (MFR) eruption on 2015 January 13, which has no accompanying CME in the WL coronagraph. Observations by Optical and Near-infrared Solar Eruption Tracer and Solar Dynamics Observatory reveal that, with the increase of the flare emission and the acceleration of the unsuccessfully erupting MFR, two isolated kernels appear at the WL 3600 Å passband and quickly develop into two elongated ribbon-like structures. The evolution of the WL continuum enhancement is completely coincident in time with the variation of Fermi hard X-ray 26–50 keV flux. Increase of continuum emission is also clearly visible at the whole FUV and NUV passbands observed by Interface Region Imaging Spectrograph. Moreover, in one WL kernel, the Si IV, C II, and Mg II h/k lines display significant enhancement and non-thermal broadening. However, their Doppler velocity pattern is location-dependent. At the strongly bright pixels, these lines exhibit a blueshift; while at moderately bright ones, the lines are generally redshifted. These results show that the failed MFR eruption is also able to produce a two-ribbon flare and high-energy electrons that heat the lower atmosphere, causing the enhancement of the WL and FUV/NUV continuum emissions and chromospheric evaporation.
Subject headings:
Sun: flares — Sun: photosphere — Sun: transition region — Sun: UV radiation1. Introduction
Solar flares are one of the most energetic phenomena that take place in the solar atmosphere. The induced emission displays a sudden and rapid increase over the whole electromagnetic spectrum from decameter radio waves to rays at 100 MeV (Benz, 2008). In the standard flare model (Sturrock, 1966; Hirayama, 1974; Kopp & Pneuman, 1976), magnetic reconnection is believed to be a fundamental energy release mechanism and is capable of efficiently converting magnetic free energy stored in the corona into thermal energy, kinematic energy, and particles acceleration (Priest & Forbes, 2002).
Magnetic flux rope (MFR), a set of magnetic field lines wrapping around its central axis, is another important structural component in reconnection-involved eruption scenario (Cheng et al., 2011b). This kind of helically coherent magnetic structure may exist prior to the eruption as seen in the high-temperature passbands of the Atmospheric Imaging Assembly (AIA; Lemen et al., 2012) on board Solar Dynamics Observatory (SDO; Zhang et al., 2012; Cheng et al., 2013a; Patsourakos et al., 2013; Li & Zhang, 2013a, b; Chen et al., 2014; Yang et al., 2014; Song et al., 2015). The rapid eruption of the MFR drives the formation of a coronal mass ejection (CME), facilitating and in turn being promoted by the fast flare reconnection (Cheng et al., 2013a, b). The newly reconnected field lines initially manifest as a cusp-shaped structure and subsequently shrink into flare loops. During the flare process, electrons are also accelerated and then quickly stream down along the flare loops, heating the chromosphere and producing enhanced flare emission at the footpoints that form two elongated ribbons if the reconnection develops above a sequence of flare arcades (Forbes & Priest, 1995).
| Telescope | Spatial resolution | Cadence | Wavelength coverage | Spectral resolution |
| [″] | [s] | [Å] | [km s-1] | |
| ONSET | 1.0 | 20 | 10830, 6563, 3600, and 4250 | - |
| SDO-AIA | 1.2 | 12 | 131, 94, 335, 193, 211, 171, 304, 1600, 1700, 4500 | - |
| SDO-HMI | 1.0 | 45 | 6173 | - |
| IRIS | 0.4 | 10 | 1332-1358, 1389-1407, and 2783-2835 | 1 |
If flares are strong enough, continuum emissions at the visible wavelengths may present an enhancement. This kind of flares is also called white-light flares (WLFs; Švestka, 1966; Neidig et al., 1993; Fang & Ding, 1995). Machado et al. (1986) classified all WLFs into two different types (I and II). For the type I WLFs, the WL emission coincides temporally with the peak of the hard X-ray (HXR) emission, and the Balmer lines are very broad (e.g., Fang & Ding, 1995); while for the type II WLFs, the situation is different (Ding et al., 1999a, b). Recent studies further reveal that the WL brightening in the type I WLFs often appears as discrete kernels and displays the characteristics: (1) the locations of the WL kernels are cospatial with those of the HXR sources (Hudson et al., 1992; Metcalf et al., 2003; Chen & Ding, 2005, 2006; Jess et al., 2008; Krucker et al., 2011; Kerr & Fletcher, 2014), and (2) the source size of the WL kernels gradually decreases with the increase of the atmospheric depth (Xu et al., 2012). These results suggest that the WL emission enhancement of type I WLFs is associated with energetic electrons that heat the chromosphere directly and the photosphere indirectly through radiative backwarming (Ding et al., 2003).
It is thought that in most cases, two-ribbon flares are closely associated with the successful eruption of MFRs (Chen, 2011). Nevertheless, it is recently noticed that a failed MFR eruption is also able to produce a two-ribbon flare, whose characteristics are qualitatively similar to that of CME-associated flares. However, it is still unclear how much quantitative difference, in particular in the WL emission, exists in these two kinds of flares. Here, we investigate a CME-less flare that shows a continuum enhancement in the 3600 Å passband. In Sections 2 and 3, we display observations of the failed eruption of the MFR and the two-ribbon flare in WL, respectively. In Section 4, we present the spectroscopic features of a flare kernel. Summary and discussion are given in Section 5.
2. Unsuccessful Eruption of the MFR
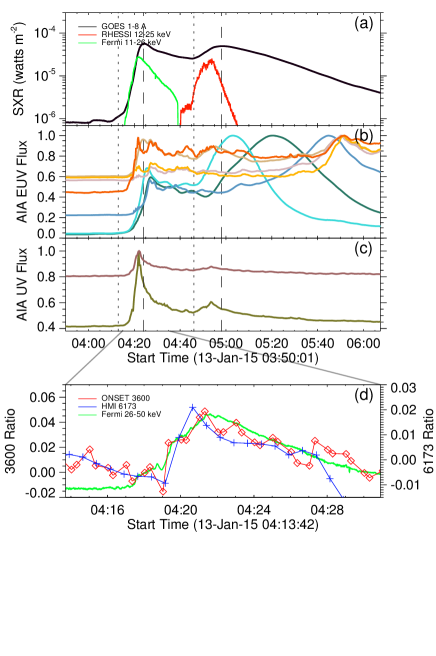
On 2015 January 13, a major flare consisting of two energy release episodes (episode I and episode II) occurred at the heliographic coordinates N06W70. The corresponding GOES soft X-ray (SXR) flux starts to increase at 04:13 UT and peaks at 04:24 UT. After a decay of 22 minutes, the SXR flux increases again and reaches the maximum at 04:58 UT (Figure 1a). The two peaks in the SXR flux are also visible in the lightcurve of the total EUV and UV emissions of the flare region (Figure 1b and 1c). It is seen that the UV emissions at the 1600 and 1700 Å passbands (Figure 1c), which mostly originate in the lower atmosphere, mainly appears in episode I, while the EUV emissions, which are from the corona, primarily appear in episode II.
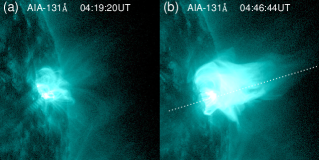
The emission in episode II is mainly associated with the descending motion of a hot structure, which is most likely to be an MFR (Cheng et al., 2011b; Patsourakos et al., 2013; Song et al., 2014). It commences when the erupting MFR catches up with the overlying field and starts to go down (Figure 2a–2c and attached movie). The absence of a CME in the WL coronagraph LASCO/C2 also proves that the eruption of the MFR is unsuccessful. The AIA 131 and 94 Å images show that the MFR starts to rise up at 04:10 UT. However, it starts to go down from 04:46 UT. At the same time, the flare emission in episode II starts to increase and the unsuccessfully erupting MFR is further heated.
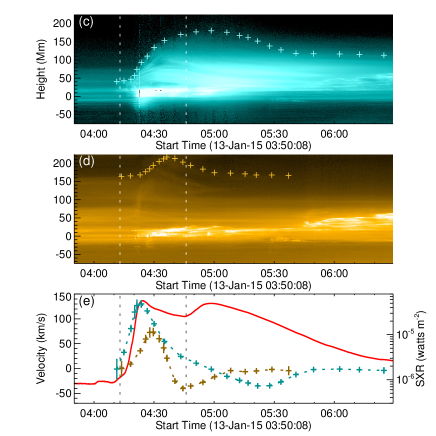
We put a slice along the direction of the MFR eruption and make the slice-time plots of the AIA 131 and 171 Å passbands. One can clearly see an ascending motion followed by a descending one of the MFR and overlying field (Figure 2c and 2d). Using the slice-time plots, we measure the heights of the MFR and overlying field (pluses in Figure 2c and 2d). Applying the first order numerical derivative, we calculate the velocities. The results are shown in Figure 2e. We find that the MFR is rapidly accelerated in the rising phase of the flare episode I. The velocity increases to 150 km s-1 at the peak of the GOES SXR flux (04:23 UT). After that, probably due to the strong strapping effect of the overlying field, the MFR starts to be decelerated. At 04:30 UT, the decelerating MFR and accelerating overlying field come to the same velocity (70 km s-1). Then, the overlying field starts to speed down. At 04:35 UT, it turns to move downward. When the descending velocity reaches the maximum (–70 km s-1), the flare episode II starts. Subsequently, both of the MFR and the overlying field move downward. Note that, the descending velocity of the MFR is smaller that that of the overlying field, implying that a collision between them may happen.
3. WL Emission of the Flare Ribbons
Although the MFR eruption is not successful, there still appear two elongated ribbon-like flare brightenings even at the WL passbands that are well observed by the Optical and Near-infrared Solar Eruption Tracer (ONSET; Fang et al., 2013) of Nanjing University with a field of view of 10 arcmin. The ONSET is installed at a new solar observing site (E102.57∘, N24.38∘) near Fuxian Lake in Yunnan Province, southwest China, where the seeing is generally stable and better than 1″, thus guaranteeing the high quality of data (Hao et al., 2012). It routinely images the photosphere at 3600 Å and 4250 Å with a wavelength bandpass of 15 Å. It also images the upper chromosphere using the H (6562.8 Å) line with a bandpass of 0.25 Å. Generally, users can directly use the Level-1 images111http://sdac.nju.edu.cn, which have been pre-processed with the calibration of the flat-field and dark current. Table 1 presents the capabilities of various telescopes that observe this WLF. One can see that the ONSET has a high temporal resolution. On 2015 January 13, the seeing near Fuxian Lake is pretty good, and the spatial resolution of ONSET approaches the upper limit, i.e., better than 1″(the pixel size is 0.24″), which is comparable with that of the AIA.
Figure 1d shows the evolution of the WL continuum enhancement, which is derived by averaging the intensity over the pixels showing WL enhancement with the background subtracted. We find that the evolution of the WL enhancement at the passbands 3600 Å (ONSET) and 6173 Å, which is from the Helioseismic and Magnetic Imager (HMI; Schou et al., 2012) on board SDO, is well coincident with the variation of Fermi HXR 26–50 keV flux.
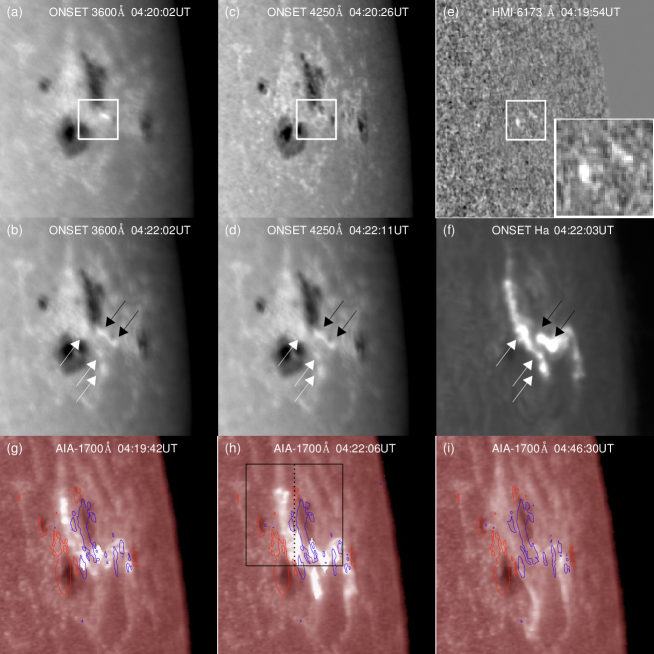
Moreover, we find an evolution of the WL brightening from the two isolated kernels to two well-shaped ribbons. At 04:20 UT, 7 minutes after the flare occurrence, two WL kernels appear at the edge of the sunspot penumbra (Figure 3a and 3b). The base-difference image of the HMI 6173.34 Å continuum intensity also confirms the appearance of the two WL kernels (Figure 3e). With the flare development, the left WL kernel extends toward the north, while the right one extends toward the southwest. At 04:22 UT, the WL brightening makes up two well-shaped ribbon-like structures, which are almost parallel to the polarity inversion line (PIL) of the active region (Figure 3c and 3d). As compared with two elongated ribbons in H and 1700 Å (Figure 3f–3i), the WL ribbons are shorter and thinner. These results indicate that this flare is a type I WLF, and the increase of the WL emission is associated with high-energy electrons, which are accelerated by the flare reconnection in the corona and then may sequentially heat the chromoshpere and even below along the direction of the PIL, finally forming two well-shaped WL ribbons.
4. Spectroscopic Analysis of the Flare Ribbons
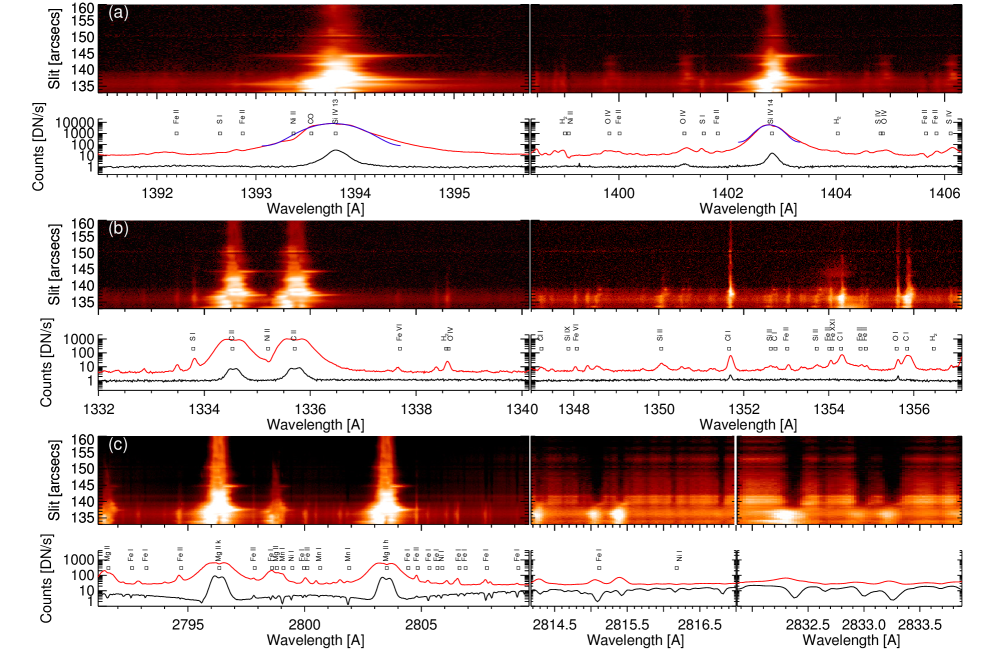
The continuum enhancement of the flare is also observed by the recently launched Interface Region Imaging Spectrograph (IRIS; De Pontieu et al., 2014), which acquires spectra in the passbands 1332–1358 Å (FUV1), 1389–1407 Å (FUV2), and 2783–2834 Å (NUV) that include three doublet bright lines, the C II 1334/1335 ( K) and Si IV 1394/1403 ( K) lines forming in the transition region and the Mg II h/k ( K) line in the chromosphere. At 04:22 UT, the slit of IRIS is positioned crossing the left WL kernel (Figure 3h). The corresponding spectrogram and average profiles of the spectral lines at the WL kernel are displayed in Figure 4, together with the profiles at the quiet region for comparison. It can be clearly seen that the continuum enhancement appears at the whole FUV (NUV) passbands as expected. At the FUV (NUV) passbands, the continuum enhancement is as large as 10 (5) times the background, respectively.
Besides the continuum enhancement, IRIS also discloses some spectral features of the WLF (Figure 4a–4c). First, the average profiles of the Si IV, C II, and Mg II h/k lines display an extremely large peak enhancement and significant non-thermal broadening (bottom panel of Figure 4a). By applying the single Gaussian fitting, the non-thermal velocity of the Si IV line is found to be 40–60 km s-1. Second, those lines like H2 1338.57 Å, Cl I 1347.2397 Å, and Fe II 1353.023 Å etc (Kelly, 1987), that are very weak and even invisible at the quiet region, get obviously enhanced when the WL enhancement appears. Third, some absorption lines near the far wing of Mg II h/k, which are thought to be possibly from the lower chromosphere and photosphere with the formation temperature of K (De Pontieu et al., 2014), turn to emission. These observations also support the scenario of high-energy electron bombardment, which heat the upper chromosphere and lead to the FUV/NUV enhancement and non-thermal line broadening. Change of the lines from absorption to emission implies a heating even lower in the lower chromosphere and photosphere. High-energy electrons cannot precipitate directly to these layers, which are most probably heated through the radiative backwarming effect (Machado et al., 1989; Metcalf et al., 1990; Ding et al., 2003; Liu et al., 2001)
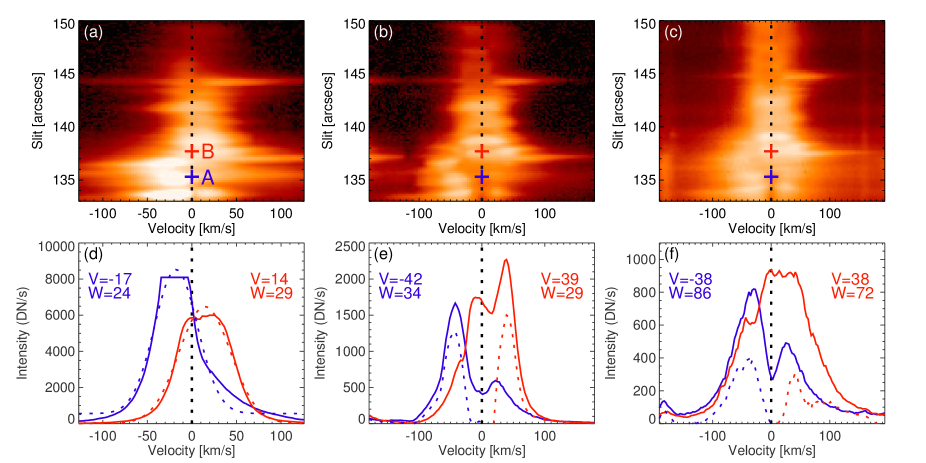
Carefully inspecting the spectrogram in the WL kernel, we further find that the Doppler shift pattern is quite location-dependent: at the strongly bright (saturated) pixels, the Si IV, C II, and Mg II h/k lines mostly display a blueshift; in contrast, at the moderately bright pixels, the lines are redshifted (Figure 5a–5c). Usually, the blueshifts are thought to be produced by chromospheric evaporation, while the redshifts are caused by chromospheric condensation (downward moving compression front). The time scale and magnitudes of both upward and downward velocities depend on the energy input rate and also the atmospheric environment. The facts that adjacent pixels witnessing different dynamic phenomena can mainly be due to the different energy injection rates, as reflected by the different line intensities. Note that, the centers of the C II and Si IV lines are calibrated by assuming that the nearby O I 1355.5977 and Fe II 1405.608 Å lines have a zero velocity. The reference center of the Mg II line is taken as that of the average profile in the quiet region (Cheng et al., 2015).
Furthermore, we quantify the Doppler and non-thermal velocity at two adjacent pixels (A and B) in the WL kernel. Pixel A corresponds to the strongly bright region, and B is at the moderately bright region. The profiles of the Si IV 1402.77 Å, C II 1335.7077 Å, Mg II k 2796.347 Å lines at A and B are shown in Figure 5d–5f. One can see that the profiles of the Si IV line are nearly Gaussian. The most obvious difference is that the center of the profile at A is blueshifted, while that at B is redshifted. The single Gaussian fitting gives the Doppler velocity of –17 and 14 km s-1 and non-thermal velocity of 23 and 28 km s-1 for A and B, respectively. As for the C II and Mg II k lines, the profiles generally deviate from Gaussian and show a self-absorption in the line center due to the optically thick effect of the lines (Leenaarts et al., 2013a, b). It is usually hard to get a velocity value causing the line asymmetries. A simple and approximate way is to subtract the relatively less perturbed wing from the more perturbed wing. The shift of the peak in the residual profile is then regarded as the velocity of the plasma producing the excess emission (Cheng et al., 2015). In this way, the Doppler velocities of the C II and Mg II k lines are –42 and –38 km s-1 at A, while 39 and 38 km s-1 at B, respectively.
5. Summary and Discussion
In this Letter, we investigate a CME-less two ribbon-like WLF that experiences two episodes of energy release. The first episode begins with the eruption of the MFR and produces a ribbon-like WL brightening; while the second one starts when the MFR catches up with the overlying field. The two energy release episodes provide a possible scenario that is related to the origin of the later phase of flares, which is defined as a second emission peak in the warm coronal lines (e.g., Fe XVI 33.5 nm; Woods et al., 2011). In the second energy release episode, the reconnection can continuously release energy for plasma heating, though in a lower rate, and produce the EUV late phase (e.g., Dai et al., 2013; Sun et al., 2013; Li et al., 2014; Liu et al., 2015). Energy release in episode II is also evidenced by appearance of a big fire ball with a temperature up to 10 MK corresponding to the unsuccessfully erupted MFR (also see; Song et al., 2014).
A two-ribbon flare is usually believed only associated with a successful eruption of the MFR or CME. Nevertheless, from this event, we find that a failed eruption is also able to generate a two-ribbon flare even at the WL passband. Generally speaking, events of such a kind are very few in observations. However, it is noticed that a recent active region (NOAA 12192) produces tens of two-ribbon flares, but none of them is associated with the CME. Two possible reasons have been proposed for CME-less flares: one is that the non-potentiality of the erupting core field is too weak, the other is that the corresponding overlying field is too strong (Ji et al., 2003; Guo et al., 2010; Cheng et al., 2011a; Sun et al., 2015; Thalmann et al., 2015; Chen et al., 2015).
Moreover, the two-ribbon flare is also visible at 3600 Å. Comparing with the HMI, which only observes the two isolated kernels, the ONSET successfully captures not only the two isolated kernels but also their development into two elongated ribbons in detail thanks to the high temporal and good enough spatial resolution. The evolution of the WL continuum emission is almost synchronous with the variation of Fermi HXR 26–50 keV flux. The IRIS observations of a WL kernel reveal an apparent increase of the continuum emission at the whole FUV (NUV) passbands, as well as an extremely large enhancement and significant non-thermal broadening of the Si IV, C II, and Mg II h/k lines. Many weak lines, including some absorption lines before the flare, also present a strong emission when the flare occurs. These results can be interpreted in terms of the well-adopted scenario: the flare reconnection produces high-energy electrons that heat the chromosphere, giving rise to the enhancement of the FUV (NUV) continuum emission, as well as non-thermal line broadening of the lines forming there. However, because the electrons with energies 200 keV are hardly possible to reach and directly heat the lower chromosphere and even the photosphere (Vernazza et al., 1981; Ding et al., 2003), an indirect heating through radiative backwarming is usually used for interpreting the WL continuum enhancement and the photospheric absorption lines turning to emission.
Owing to the unprecedented high spatial and spectral resolution of IRIS, we find that the Doppler shift pattern of the spectral lines is quite location-dependent. At the strongly bright pixels, all lines are prone to be blueshifted; in contrast, at the moderately bright pixels, they tend to be redshifted. This could be due to the different heating rates in different places that produce different magnitudes and time scales, and possibly even different signs, of the velocities in the chromospheric evaporation (condensation) process. Different patterns of evaporations have also been reported by Li & Ding (2011) for, however, well separated flare kernels. Previous observations also showed that for a specific site, the hotter coronal lines are usually blueshifted while the cooler chromospheric and transition region lines are in more cases redshifted (Tian et al., 2014, 2015), and that there appears a transition from blueshift to redshift for the same line with the flare development (Milligan & Dennis, 2009; Chen & Ding, 2010)
References
- Benz (2008) Benz, A. O. 2008, Living Reviews in Solar Physics, 5, 1
- Chen et al. (2014) Chen, B., Bastian, T. S., & Gary, D. E. 2014, ApJ, 794, 149
- Chen & Ding (2010) Chen, F., & Ding, M. D. 2010, ApJ, 724, 640
- Chen et al. (2015) Chen, H., Zhang, J., Ma, S., Yang, S., Li, L., Huang, X., & Xiao, J. 2015, ArXiv e-prints
- Chen (2011) Chen, P. F. 2011, Living Reviews in Solar Physics, 8, 1
- Chen & Ding (2005) Chen, Q. R., & Ding, M. D. 2005, ApJ, 618, 537
- Chen & Ding (2006) —. 2006, ApJ, 641, 1217
- Cheng et al. (2015) Cheng, X., Ding, M. D., & Fang, C. 2015, ApJ, 804, 82
- Cheng et al. (2011a) Cheng, X., Zhang, J., Ding, M. D., Guo, Y., & Su, J. T. 2011a, ApJ, 732, 87
- Cheng et al. (2013a) Cheng, X., Zhang, J., Ding, M. D., Liu, Y., & Poomvises, W. 2013a, ApJ, 763, 43
- Cheng et al. (2013b) Cheng, X., Zhang, J., Ding, M. D., Olmedo, O., Sun, X. D., Guo, Y., & Liu, Y. 2013b, ApJ, 769, L25
- Cheng et al. (2011b) Cheng, X., Zhang, J., Liu, Y., & Ding, M. D. 2011b, ApJ, 732, L25
- Dai et al. (2013) Dai, Y., Ding, M. D., & Guo, Y. 2013, ApJ, 773, L21
- De Pontieu et al. (2014) De Pontieu, B., et al. 2014, Sol. Phys., 289, 2733
- Ding et al. (1999a) Ding, M. D., Fang, C., Yin, S. Y., & Chen, P. F. 1999a, A&A, 348, L29
- Ding et al. (1999b) Ding, M. D., Fang, C., & Yun, H. S. 1999b, ApJ, 512, 454
- Ding et al. (2003) Ding, M. D., Liu, Y., Yeh, C.-T., & Li, J. P. 2003, A&A, 403, 1151
- Fang & Ding (1995) Fang, C., & Ding, M. D. 1995, A&AS, 110, 99
- Fang et al. (2013) Fang, C., et al. 2013, Research in Astronomy and Astrophysics, 13, 1509
- Forbes & Priest (1995) Forbes, T. G., & Priest, E. R. 1995, ApJ, 446, 377
- Guo et al. (2010) Guo, Y., Ding, M. D., Schmieder, B., Li, H., Török, T., & Wiegelmann, T. 2010, ApJ, 725, L38
- Hao et al. (2012) Hao, Q., Guo, Y., Dai, Y., Ding, M. D., Li, Z., Zhang, X. Y., & Fang, C. 2012, A&A, 544, L17
- Hirayama (1974) Hirayama, T. 1974, Sol. Phys., 34, 323
- Hudson et al. (1992) Hudson, H. S., Acton, L. W., Hirayama, T., & Uchida, Y. 1992, PASJ, 44, L77
- Jess et al. (2008) Jess, D. B., Mathioudakis, M., Crockett, P. J., & Keenan, F. P. 2008, ApJ, 688, L119
- Ji et al. (2003) Ji, H., Wang, H., Schmahl, E. J., Moon, Y.-J., & Jiang, Y. 2003, ApJ, 595, L135
- Kelly (1987) Kelly, R. L. 1987, Journal of Physical and Chemical Reference Data, 16
- Kerr & Fletcher (2014) Kerr, G. S., & Fletcher, L. 2014, ApJ, 783, 98
- Kopp & Pneuman (1976) Kopp, R. A., & Pneuman, G. W. 1976, Sol. Phys., 50, 85
- Krucker et al. (2011) Krucker, S., Hudson, H. S., Jeffrey, N. L. S., Battaglia, M., Kontar, E. P., Benz, A. O., Csillaghy, A., & Lin, R. P. 2011, ApJ, 739, 96
- Leenaarts et al. (2013a) Leenaarts, J., Pereira, T. M. D., Carlsson, M., Uitenbroek, H., & De Pontieu, B. 2013a, ApJ, 772, 89
- Leenaarts et al. (2013b) —. 2013b, ApJ, 772, 90
- Lemen et al. (2012) Lemen, J. R., et al. 2012, Sol. Phys., 275, 17
- Li & Zhang (2013a) Li, L. P., & Zhang, J. 2013a, A&A, 552, L11
- Li & Zhang (2013b) Li, T., & Zhang, J. 2013b, ApJ, 770, L25
- Li & Ding (2011) Li, Y., & Ding, M. D. 2011, ApJ, 727, 98
- Li et al. (2014) Li, Y., Ding, M. D., Guo, Y., & Dai, Y. 2014, ApJ, 793, 85
- Liu et al. (2015) Liu, K., Wang, Y., Zhang, J., Cheng, X., Liu, R., & Shen, C. 2015, ApJ, 802, 35
- Liu et al. (2001) Liu, Y., Ding, M. D., & Fang, C. 2001, ApJ, 563, L169
- Machado et al. (1989) Machado, M. E., Emslie, A. G., & Avrett, E. H. 1989, Sol. Phys., 124, 303
- Machado et al. (1986) Machado, M. E., et al. 1986, in The lower atmosphere of solar flares, p. 483 - 488, ed. D. F. Neidig, 483–488
- Metcalf et al. (2003) Metcalf, T. R., Alexander, D., Hudson, H. S., & Longcope, D. W. 2003, ApJ, 595, 483
- Metcalf et al. (1990) Metcalf, T. R., Canfield, R. C., & Saba, J. L. R. 1990, ApJ, 365, 391
- Milligan & Dennis (2009) Milligan, R. O., & Dennis, B. R. 2009, ApJ, 699, 968
- Neidig et al. (1993) Neidig, D. F., Kiplinger, A. L., Cohl, H. S., & Wiborg, P. H. 1993, ApJ, 406, 306
- Patsourakos et al. (2013) Patsourakos, S., Vourlidas, A., & Stenborg, G. 2013, ApJ, 764, 125
- Priest & Forbes (2002) Priest, E. R., & Forbes, T. G. 2002, A&A Rev., 10, 313
- Schou et al. (2012) Schou, J., et al. 2012, Sol. Phys., 275, 229
- Song et al. (2015) Song, H. Q., Zhang, J., Chen, Y., Cheng, X., Li, G., & Wang, Y. M. 2015, ApJ, 803, 96
- Song et al. (2014) Song, H. Q., Zhang, J., Cheng, X., Chen, Y., Liu, R., Wang, Y. M., & Li, B. 2014, ApJ, 784, 48
- Sturrock (1966) Sturrock, P. A. 1966, Nature, 211, 695
- Sun et al. (2013) Sun, X., Hoeksema, J. T., Liu, Y., Aulanier, G., Su, Y., Hannah, I. G., & Hock, R. A. 2013, ApJ, 778, 139
- Sun et al. (2015) Sun, X., et al. 2015, ApJ, 804, L28
- Thalmann et al. (2015) Thalmann, J. K., Su, Y., Temmer, M., & Veronig, A. M. 2015, ApJ, 801, L23
- Tian et al. (2014) Tian, H., Li, G., Reeves, K. K., Raymond, J. C., Guo, F., Liu, W., Chen, B., & Murphy, N. A. 2014, ApJ, 797, L14
- Tian et al. (2015) Tian, H., Young, P. R., Reeves, K. K., Chen, B., Liu, W., & McKillop, S. 2015, ArXiv e-prints
- Švestka (1966) Švestka, Z. 1966, Space Sci. Rev., 5, 388
- Vernazza et al. (1981) Vernazza, J. E., Avrett, E. H., & Loeser, R. 1981, ApJS, 45, 635
- Woods et al. (2011) Woods, T. N., et al. 2011, ApJ, 739, 59
- Xu et al. (2012) Xu, Y., Cao, W., Jing, J., & Wang, H. 2012, ApJ, 750, L7
- Yang et al. (2014) Yang, S., Zhang, J., Liu, Z., & Xiang, Y. 2014, ApJ, 784, L36
- Zhang et al. (2012) Zhang, J., Cheng, X., & Ding, M.-D. 2012, Nature Communications, 3, 747