Traffic-driven epidemic spreading in correlated networks
Abstract
In spite of the extensive previous efforts on traffic dynamics and epidemic spreading in complex networks, the problem of traffic-driven epidemic spreading on correlated networks has not been addressed. Interestingly, we find that the epidemic threshold, a fundamental quantity underlying the spreading dynamics, exhibits a non-monotonic behavior in that it can be minimized for some critical value of the assortativity coefficient, a parameter characterizing the network correlation. To understand this phenomenon, we use the degree-based mean-field theory to calculate the traffic-driven epidemic threshold for correlated networks. The theory predicts that the threshold is inversely proportional to the packet-generation rate and the largest eigenvalue of the betweenness matrix. We obtain consistency between theory and numerics. Our results may provide insights into the important problem of controlling/harnessing real-world epidemic spreading dynamics driven by traffic flows.
pacs:
89.75.Hc, 05.70.Ln, 05.60.-kI Introduction
Both epidemic spreading 1 ; 2 ; 3 ; 4 ; 5 ; 6 ; 7 ; 8 ; 9 ; 10 ; 11 and traffic transportation 12 ; 13 ; 14 ; 15 ; 16 ; 17 ; 18 are two types of fundamental dynamical processes on complex networks. The past fifteen years have witnessed a great deal of effort in exploring and understanding these processes. Intuitively, spreading should be greatly affected by the transportation dynamics as the traffic flows determine the paths along which a virus or information can propagate. Nevertheless, for a long time, the two types of dynamical processes were studied separately. The first series of works to incorporate traffic dynamics into epidemic spreading were done using the metapopulation model m1 ; m2 ; m3 ; m4 ; m4.1 ; m5.0 ; m5 . In particular, consider a spatially extended system of a large number of individuals. In a metapopulation model, all the individuals are grouped into a number of spatially structured subpopulations interacting with each other in a manner that can be described as a network. The links in the network represent the traveling paths of individuals across different subpopulations. An infected individual can infect other individuals in the same subpopulation. The metapopulation model has been used to simulate the spread of human and animal diseases (such as SARS and H1N1) among different cities. In 2009, Meloni et al. proposed another traffic-driven epidemic spreading model Meloni , where each node corresponds to a router (e.g., in a computer network) and the virus can spread among nodes through the transmission of packets. A susceptible node will be infected with certain probability every time it receives a packet from an infected neighboring node. This model is quite suitable for studying computer virus propagation.
The model of Meloni et al. Meloni has become a prototypical framework to address a variety of issues in traffic-driven epidemic spreading. For traffic flow dynamics on complex networks, an essential ingredient is the routing strategy. In the model, one can demonstrate that epidemic spreading can be modulated or controlled through a proper choice of the local routing strategy yang1 or global routing protocol yang3 . For a fixed routing strategy, the network structure can also affect the spreading dynamics. For example, by increasing the average network connectivity, one can effectively delay epidemic outbreaks yang4 . Furthermore, the epidemic threshold can be enhanced by deliberately removing a subset of links associated with the large-degree nodes or the edges with the largest algorithmic betweenness yang5 .
In previous studies of traffic-driven epidemic spreading, the networks were assumed to be uncorrelated. In such a network, the average degree of the neighboring nodes is uniform across nodes. However, many real-world networks display various degrees of mixing patterns newman . Qualitatively, a network is assortatively (disassortatively) mixing if high-degree nodes tend to connect with high-degree (low-degree) nodes. Quantitatively, degree mixing can be characterized by the assortativity coefficient newman :
| (1) |
where , are the degrees of the nodes at the ends of the th edge, is the number of edges in the network, and . For standard network models such as the Erdös-Rényi random graphs er and the Barabási-Albert scale-free networks BA , the assortativity coefficient is zero, indicating complete lack of degree correlation. For many social networks, the assortativity coefficient is positive. However, technological and biological networks tend to be disassortative with negative values of .
In this paper, we study quantitatively how degree mixing, the most pronounced feature of correlated networks, affects traffic-driven epidemic spreading. Interestingly, we find a non-monotonic behavior in that the threshold can be minimized for some critical value of the assortativity coefficient. To understand this phenomenon, we employ a degree-based mean-field theory, which allows us to calculate the traffic-driven epidemic threshold in correlated networks. We find that the threshold is inversely proportional to the packet-generation rate - a key parameter characterizing the traffic dynamics, as well as the largest eigenvalue of the betweenness matrix. Moreover, the epidemic threshold is negatively correlated with the maximum algorithmic betweenness. Our theory predicts the existence of a critical value of the assortativity coefficient at which the epidemic threshold reaches its minimum, which agrees with the results from direct numerical simulations.
II Correlated scale-free network and traffic-driven epidemic spreading models
Construction of scale-free networks with tunable assortativity coefficient.
We first generate an ensemble of scale-free networks according to the uncorrelated configuration model UCM . The steps are: (i) assign to each node , in a set of initially disconnected nodes, a number of stubs, where is drawn from the probability distribution and subject to the constraints (here we set and ) and being even, and (ii) generate a network by randomly choosing stubs and connecting them to form edges, taking into account the preassigned degrees and avoiding multiple and self-connections. We then use the algorithm in Ref. xs to obtain networks with desired degree mixing patterns. Specifically, in order to obtain an assortative network, at each step we randomly choose two different edges with four different ends, and then purposefully swap the two edges by linking the vertices with higher degrees and lower degrees, respectively. Repeating this procedure while forbidding multiple connections and disconnected components, we generate a network with certain degree assortativity without altering the degree distribution of the original network. Through the opposite operation that one edge links the highest and the lowest nodes and the other edge connects the two remaining nodes, we can obtain networks with disassortative mixing. When the assortativity coefficient of a network reaches some expected value, we stop the edge-swapping process.
Traffic-driven epidemic spreading model.
Following the pioneering work of Meloni et al. Meloni , we incorporate the traffic dynamics into the standard susceptible-infected-susceptible epidemic spreading model SIS , as follows. At each time step, new packets are generated with randomly chosen source and destination nodes, and each node can deliver at most packets toward their destinations. (For simplicity, we set to be infinite.) Packets are forwarded according to a given routing algorithm (we use the shortest-path routing scheme). The queue length of each node is assumed to be unlimited, to which the first-in-first-out principle is applied. Each newly generated packet is placed at the end of the queue of its source node. Once a packet reaches its destination, it is removed from the system. A node can be in two discrete states: susceptible or infected. After a transient time, the total number of delivered packets at each time step will reach a steady value. Subsequently, an initial fraction of nodes is set to be infected (we choose in numerical experiments). Differing from the conventional spreading dynamics where there is a certain probability that a node can be infected if one or more of its neighboring nodes are infected, here the infection spreads in the network through packet exchanges. In particular, all packets queuing at an infected node are infected, while all packets at a susceptible node are uninfected. A susceptible node has the probability of being infected every time it receives an infected packet from any infected neighboring nodes. With probability , the virus in an infected packet will be cleaned by some anti-virus software (say, in a computer network) in the susceptible node. The infected nodes are recovered at the rate (we set ).
III Numerical results and mean-field theory

Numerical results of the dependence of the epidemic threshold on the assortativity coefficient.
A useful quantity to characterize correlated networks is the average degree of the nearest neighbors, denoted as . Figure 1 shows as a function of degree for different values of the assortativity coefficient . From Fig. 1, one can see that is almost independent of when . For assortative (disassortative) networks, is an increasing (decreasing) function of , indicating that large-degree nodes tend to connect with large(small)-degree nodes.
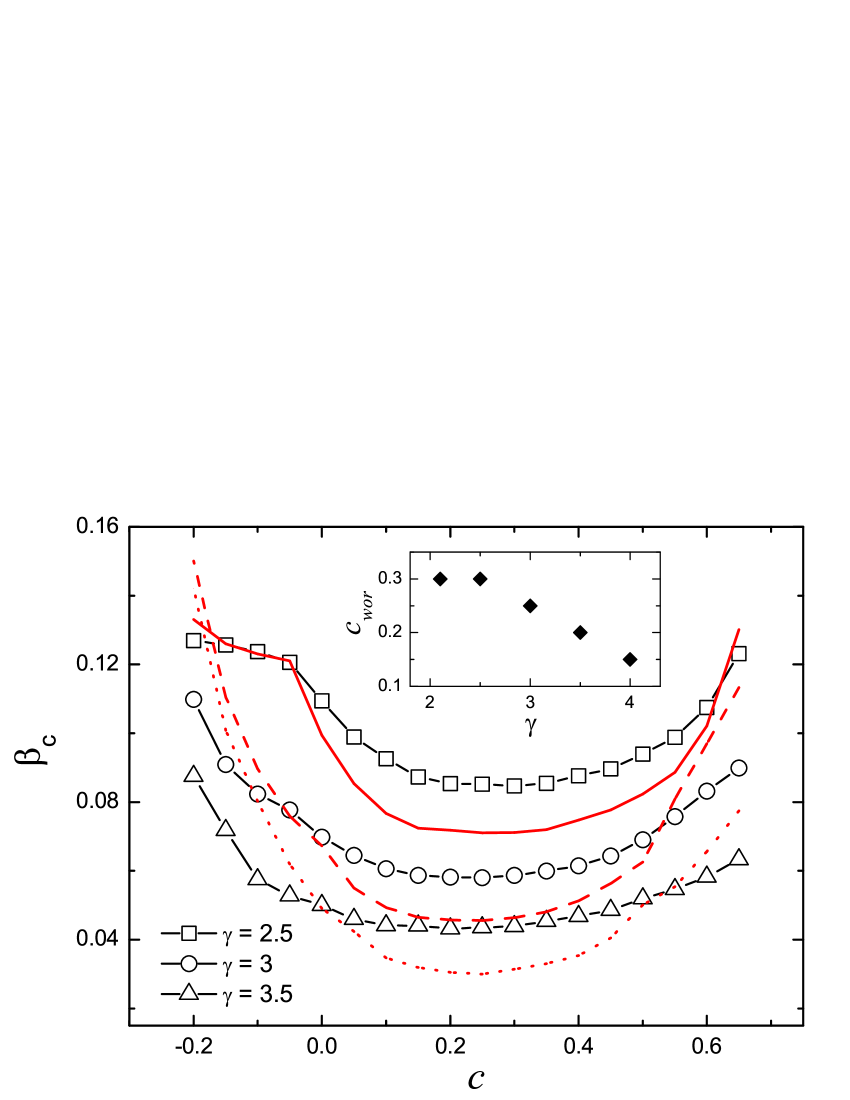
A fundamental quantity in SIS dynamics is the epidemic threshold , below which the epidemic dies off asymptotically threshold1 ; threshold2 . Figure 2 shows versus the assortativity coefficient for different values of the scale-free degree exponent . We see a non-monotonic behavior. Especially, for each value of simulated, there exists a critical value of , denoted as , at which the epidemic threshold is minimized. The inset of Fig. 2 shows that decreases from 0.3 to 0.15 as increases from 2.1 to 4.
Mean-field analysis of epidemic threshold for correlated networks.
We seek to understand the counterintuitive behavior exemplified in Fig. 2. The base of our analysis is the standard degree-based mean-field theory theory1 for complex networks. First, we write the dynamical rate equations for the traffic-driven SIS model as
| (2) |
where is the density of the infected nodes of degree , is the conditional probability that a node of degree is connected to a node of degree , and is the algorithmic betweenness theory2 of a directed edge from a node of degree to a node of degree . The first term in Eq. (2) is the recovery rate of the infected nodes, and the second term takes into account the probability that a node of degree belongs to the susceptible class of fraction and gets infected via packets from some infected nodes. The algorithmic betweenness of a directed edge, , is the number of packets passing from node to its neighboring node each time if the packet-generation rate is . For an undirected network, we have . For the shortest-path routing protocol, the algorithmic betweenness of a directed edge can be calculated through
| (3) |
where is the total number of the shortest paths going from node to , and is the number of shortest paths going from to and passing from node to its neighboring node . The algorithmic betweenness of a node is given by , where the summation runs over the nearest neighbor set of node .
For small values of , we can linearize Eq. (2) to obtain
| (4) |
where the Jacobian matrix element is
| (5) |
and is the Kronecker delta function. The solution will be unstable if there exists at least one positive eigenvalue of the Jacobian matrix L. The endemic phase () will thus take place for , where is the largest eigenvalue of the betweenness matrix C with its elements given by
| (6) |
The element gives the number of packets that a node of degree receives from all neighboring nodes of degree at each time step when the packet-generation rate . Since C is non-negative and irreducible, the Perron-Frobenius theorem theory4 stipulates that its largest eigenvalue is real and positive. The endemic state then occurs for
| (7) |
For uncorrelated networks, we can use two approximations: () , and () , where the latter allows us to identify the key parameters of the underlying dynamics. Under these approximations, the element of the betweenness matrix can be reduced to
which has a unique non-zero eigenvector with the eigenvalue . The epidemic threshold for uncorrelated networks can then be obtained as
| (8) |
where represents the algorithmic betweenness of a node. This result was obtained previously by a slightly different version of the mean-field theory (heterogeneous mean-field theory) Meloni .
To validate our theoretical results [Eq. (7)], we compare them with numerically calculated dependence of on the assortativity coefficients . As shown in Fig. 2, the theoretical and numerical results are consistent.
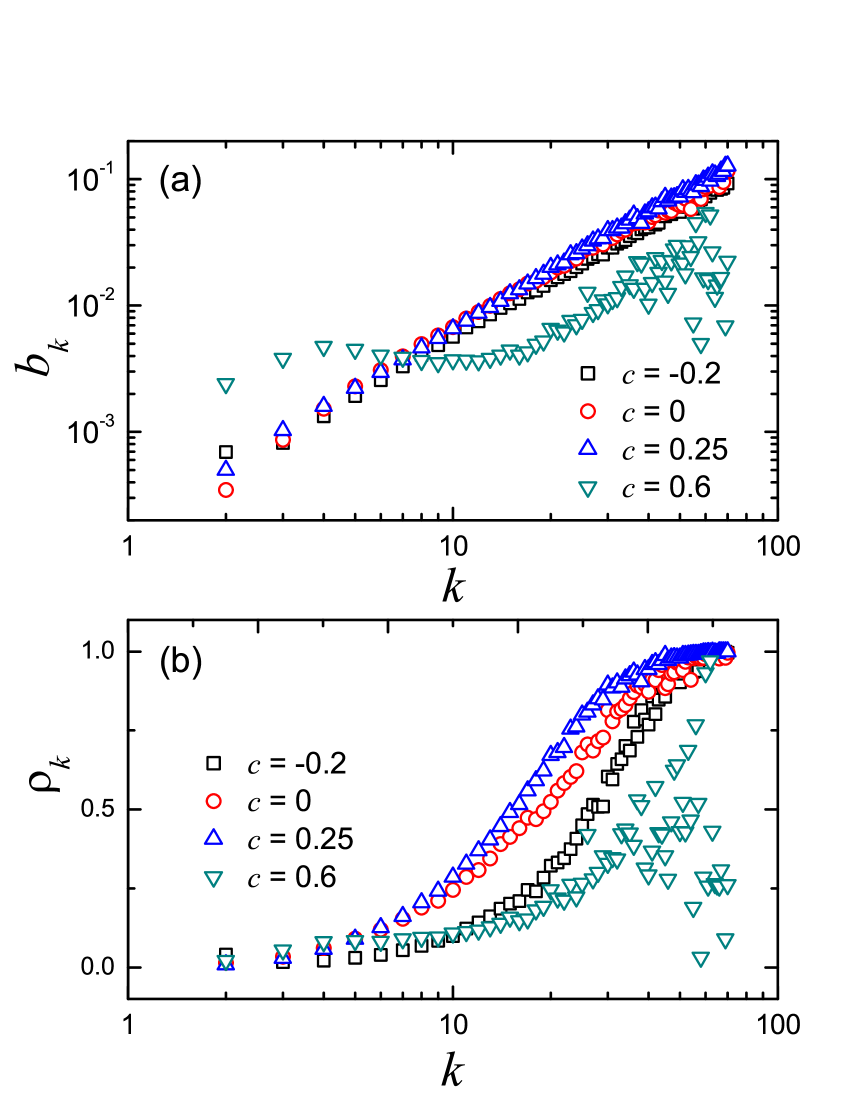
How degree mixing affects the algorithmic betweenness and the infection probability for nodes of different degrees? The nodal algorithmic betweenness within the degree class is defined as , where is the number of nodes within each degree class and the summation runs over all nodes of degree . Figure 3(a) shows the dependence of on degree . We see that for dissortative (e.g., ), uncorrelated (), and weakly assortative (e.g., ) networks, increases with , and the scaling of with follows a power law. However, for strongly assortative (e.g., ) networks, the scaling is not as straightforward in that the values of for large-degree nodes are not necessarily high but instead spread in a relatively wide range. (Similar phenomena were observed previously in some real-world networks bjk .) The density of the infected nodes within the degree class is , where and are the numbers of nodes and of infected nodes within the degree class, respectively. From Fig. 3(b), we see that for dissortative (e.g., ), uncorrelated (), and weakly assortative (e.g., ) networks, increases with . However, for strongly assortative (e.g., ) networks, the value of for large-degree nodes can assume relatively small values.

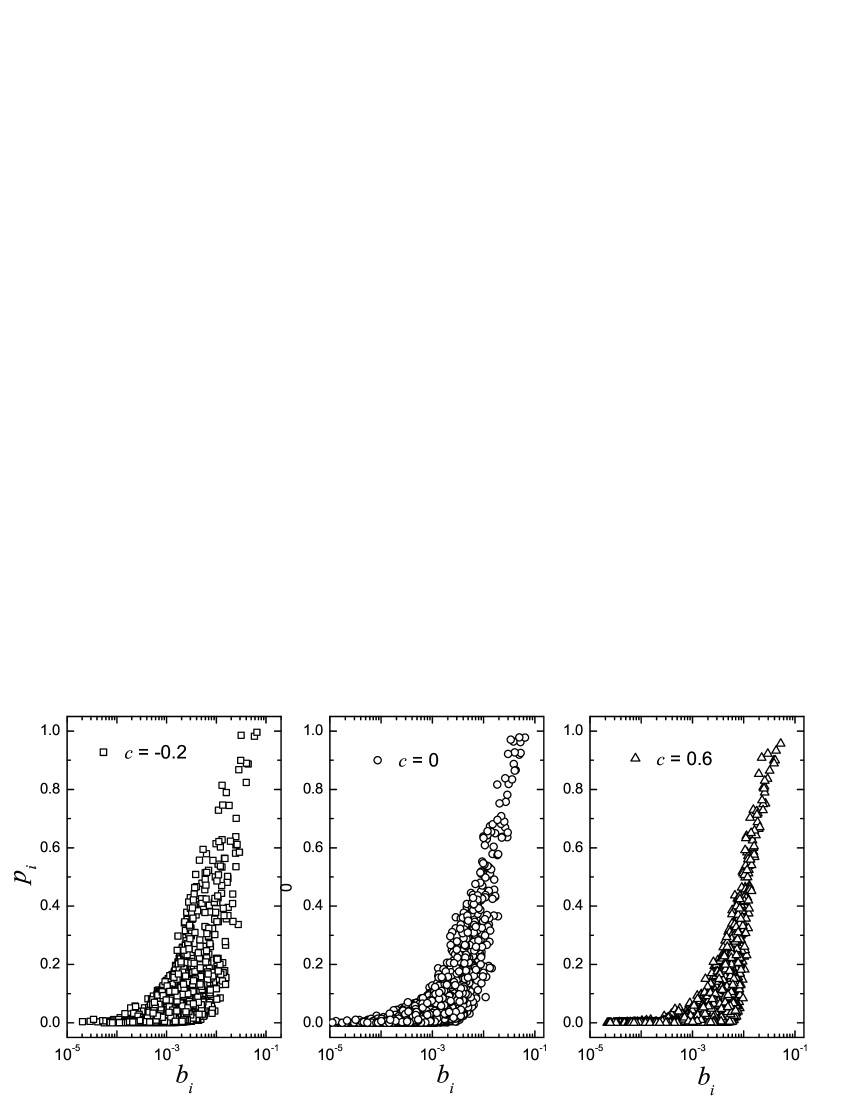
Combining Figs. 3(a) and 3(b), we deduce that the algorithmic betweenness of a node is positively correlated with the probability of its being infected. We define the infection probability of a node as , where is the total time lapse and is the number of time steps at which node is infected (here we set ). In Fig. 4, we plot the dependence of on for different values of . We see that, as a general trend, increases with and the largest corresponds to the highest value of , regardless of the value of .
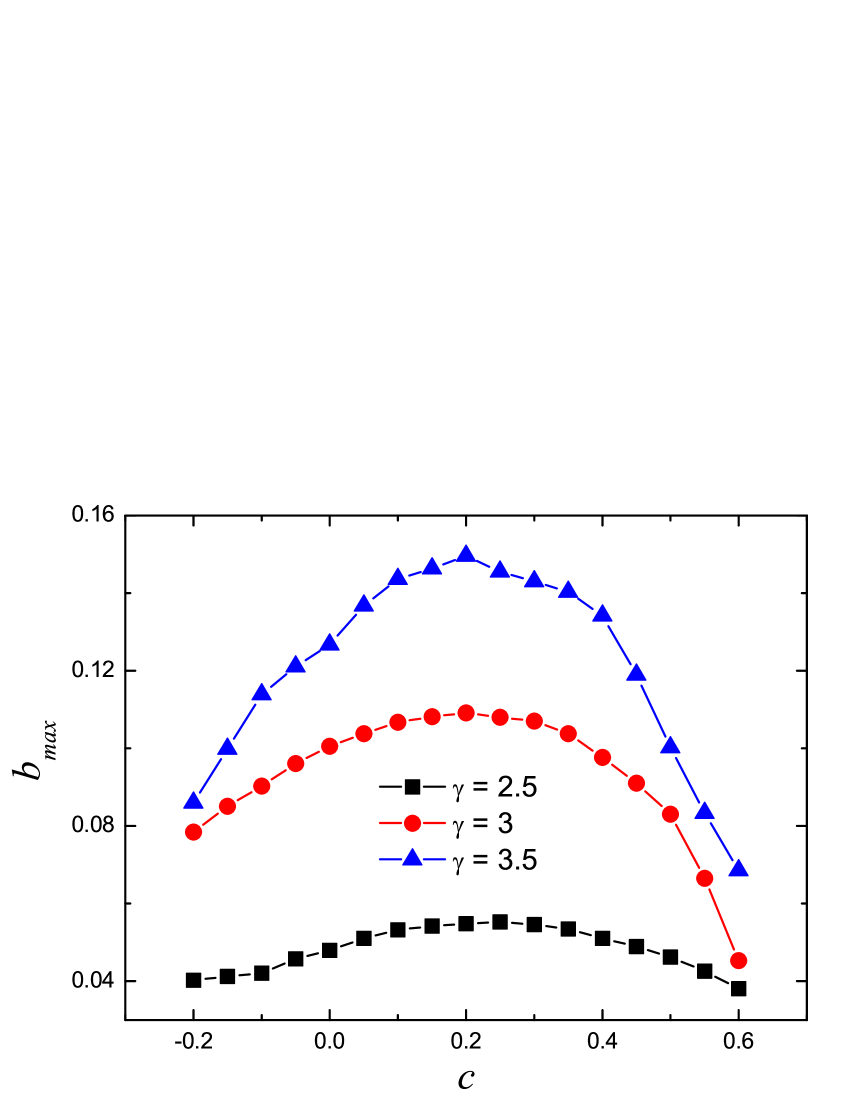
Since the node having the maximum algorithmic betweenness is most likely to be infected, it plays a crucial role in determining the traffic-driven epidemic threshold. In particular, only when the spreading rate is large enough to successfully infect the node with will the epidemic spreading be able to sustain. To confirm this, we calculate the dependence of on the assortativity coefficient for networks with different values of the degree exponent , as shown in Fig. 5. We see that, for each value of , peaks at some moderate value of . Comparing with the results in Fig. 2, we see that the versus behavior is opposite to that of versus , implying that increasing causes to decrease. The critical value of leading to the maximum is in fact indistinguishable from the value that minimizes . As a by-product, the phenomenon shown in Fig. 5 suggests a relationship between the maximum algorithmic betweenness and the largest eigenvalue of the betweenness matrix, for which a mathematical understanding is not yet available.
Finally, we study the epidemic threshold as a function of the packet-generation rate for different values of the assortativity coefficient . The results are shown in Fig. 6. We see that scales inversely with for each value of , as predicted by our mean-field theory [Eq. (7)]. This is intuitively correct, as an increase in the traffic flow generally facilitates epidemic outbreak.
IV Conclusions
To summarize, our investigation of traffic-driven epidemic spreading in correlated scale-free networks reveals the existence of a critical level of network correlation for which the outbreak of epidemic is maximally promoted. We use an extended degree-based mean-field theory, taking into account the traffic flow dynamics, to account for the phenomenon. In addition, we find that nodes with larger algorithmic betweenness are more likely to be infected. We note that in traditional epidemic spreading where infections are transmitted as a reactive process from nodes to all neighbors, the epidemic threshold is largely determined by the nodes with the largest degree Castellano . Our results reveal, however, that for traffic-driven epidemic spreading, the threshold mainly depends on the node with the maximum algorithmic betweenness. In particular, the threshold tends to decrease with the value of the maximum algorithmic betweenness. While for uncorrelated or disassortative networks, the largest-degree node typically has the maximum algorithmic betweenness, this is not the case for assortative networks. Our results indicate that in traffic-driven spreading dynamics, the structural properties of the network can have a significant effect on epidemic spreading and outbreak, providing a potential mechanism to control various spreading dynamics in real-world situations.
Acknowledgements.
This work was supported by the National Science Foundation of China (Grants No. 61403083 and No. 91324002), and the Natural Science Foundation of Fujian Province, China (Grant No. 2013J05007). YCL was supported by the Army Research Office (ARO) under Grant No. W911NF-14-1-0504.References
- (1) R. Pastor-Satorras, C. Castellano, P. V. Mieghem, and A. Vespignani, arXiv:1408.2701v1 (2014).
- (2) M. E. J. Newman, Phys. Rev. E 66, 016128 (2002).
- (3) M. Barthélemy, A. Barrat, R. Pastor-Satorras, and A. Vespignani, Phys. Rev. Lett. 92, 178701 (2004).
- (4) M. Kitsak, L. K. Gallos, S. Havlin, F. Lijeros, L. Muchnik L, H. E. Stanley, and H. A. Makse, Nat. Phys. 6, 888 (2010).
- (5) R. Parshani, S. Carmi, and S. Havlin, Phys. Rev. Lett. 104, 258701 (2010).
- (6) B. Karrer and M. E. J. Newman, Phys. Rev. E 84, 036106 (2011).
- (7) S. Gómez, J. Gómez-Gardeñes,, Y. Moreno, and A. Arenas, Phys. Rev. E 84, 036105 (2011).
- (8) C. Castellano and R. Pastor-Satorras, Sci. Rep. 2, 372 (2012).
- (9) M. Dickison, S. Havlin, and H. E. Stanley, Phys. Rev. E 85, 066109 (2012).
- (10) C. Granell, S. Gómez, and A. Arenas, Phys. Rev. Lett. 111, 128701 (2013).
- (11) C. Granell, S. Gomez, and A. Arenas, Phys. Rev. E 90, 012808 (2014).
- (12) A. Arenas, A. Díaz-Guilera, and R. Guimerà, Phys. Rev. Lett. 86, 3196 (2001).
- (13) P. Echenique, J. Gómez-Gardeñes, and Y. Moreno, Phys. Rev. E 70, 056105 (2004).
- (14) W.-X. Wang, B.-H. Wang, C.-Y. Yin, Y.-B. Xie, and T. Zhou, Phys. Rev. E 73, 026111 (2006).
- (15) S. Meloni, J. Gómez-Gardeñes, V. Latora, and Y. Moreno, Phys. Rev. Lett. 100, 208701 (2008).
- (16) M. Tang and T. Zhou, Phys. Rev. E 84, 026116 (2011).
- (17) H.-X. Yang, W.-X. Wang, Y.-B. Xie, Y.-C. Lai, and B.-H. Wang, Phys. Rev. E 83, 016102 (2011).
- (18) R. G. Morris and M. Barthélemy, Phys. Rev. Lett. 109, 128703 (2012).
- (19) V. Colizza, A. Barrat, M. Barthélemy, and A. Vespignani, Proc. Natl Acad. Sci. USA 103, 2015 (2006).
- (20) V. Colizza and A. Vespignani, Phys. Rev. Lett. 99, 148701 (2007).
- (21) M. Tang, L. Liu, and Z. Liu, Phys. Rev. E 79, 016108 (2009) .
- (22) D. Balcan and A. Vespignani, Nat. Phys. 7, 581 (2011).
- (23) S. Meloni, N. Perra, A. Arenas, S. Gómez, Y. Moreno, and A. Vespignani, Sci. Rep. 1, 62 (2011).
- (24) Z. Ruan, M. Tang, and Z. Liu, Phys. Rev. E 86, 036117 (2012).
- (25) Z. Ruan, P. Hui, H. Lin, and Z. Liu, Eur. Phys. J. B 86, 13 (2013).
- (26) S. Meloni, A. Arena, and Y. Moreno, Proc. Natl Acad. Sci. USA 106, 16897 (2009).
- (27) H.-X. Yang, W.-X. Wang, Y.-C. Lai, Y.-B. Xie, B.-H. Wang, Phys. Rev. E 84, 045101 (2011).
- (28) H.-X. Yang and Z.-X. Wu, J. Stat. Mech. P03018 (2014).
- (29) H.-X. Yang, W.-X. Wang, and Y.-C. Lai, Chaos 22, 043146 (2012).
- (30) H.-X. Yang, Z.-X. Wu, and B.-H. Wang, Phys. Rev. E 87, 064801 (2013).
- (31) M. E. J. Newman, Phys. Rev. Lett. 89, 208701 (2002).
- (32) P. Erdös and A. Rényi, Publ. Math. Debrecen 6, 290 (1959).
- (33) A.-L. Barabási and R. Albert, Science 286, 509 (1999).
- (34) M. Catanzaro, M. Boguñá, and R. Pastor-Satorras, Phys. Rev. E 71, 027103 (2005).
- (35) R. Xulvi-Brunet and I. M. Sokolov, Phys. Rev. E 70, 066102 (2004).
- (36) N. T. J. Bailey, (Griffin, London, 1975).
- (37) R. Pastor-Satorras and A. Vespignani, Phys. Rev. Lett. 86, 3200 (2001).
- (38) M. Boguñá, C. Castellano, and R. Pastor-Satorras, Phys. Rev. Lett. 111, 068701 (2013).
- (39) M. Boguñá and R. Pastor-Satorras, Phys. Rev. E 66, 047104 (2002).
- (40) R. Guimerà, A. Díaz-Guilera, F. Vega-Redondo, A. Cabrales, and A. Arenas, Phys. Rev. Lett. 89, 248701 (2002).
- (41) F. R. Gantmacher, (Chelsea Publishing Company, New York, 1974).
- (42) K.-I. Goh, E. Oh, B. Kahng, and D. Kim, Phys. Rev. E 67, 017101 (2003).
- (43) C. Castellano and R. Pastor-Satorras, Phys. Rev. Lett. 105, 218701 (2010).