Initial state fluctuations from mid-peripheral to ultra-central collisions in a event-by-event transport approach
Abstract
We have developed a relativistic kinetic transport approach that incorporates initial state fluctuations allowing to study the build up of elliptic flow and high order harmonics , and for a fluid at fixed . We study the effect of the ratio and its T dependence on the build up of the for two different beam energies: RHIC for Au+Au at and LHC for at . We find that for the two different beam energies considered the suppression of the due to the viscosity of the medium have different contributions coming from the cross over or QGP phase. Our study reveals that only in ultra-central collisions () the have a stronger sensitivity to the T dependence of in the QGP phase and this sensitivity increases with the order of the harmonic n. Moreover, the study of the correlations between the initial spatial anisotropies and the final flow coefficients shows that at LHC energies there is more correlation than at RHIC energies. The degree of correlation increases from peripheral to central collisions, but only in ultra-central collisions at LHC, we find that the linear correlation coefficient for and . This suggests that the final correlations in the (,) space reflect the initial correlations in the (,) space.
pacs:
12.38.Aw,12.38.MhI Introduction
The experimental results accumulated in these years in the ultra relativistic heavy ion collisions (uRHICs) first in the experiments conducted at RHIC and more recently at the LHC has shown that the elliptic flow , is the largest ever observed in HIC Adams et al. (2005); Aamodt et al. (2010). The elliptic flow is a measurement of the momentum anisotropy of the emitted particles and it is an observable that encodes information about the transport properties of the matter created in these collisions. Theoretical calculations within viscous hydrodynamics Romatschke and Romatschke (2007); Song and Heinz (2008) and in the recent years also calculation performed within transport approach Ferini et al. (2009); Xu and Greiner (2009); Plumari and Greco (2012) have shown that this large value of is consistent with a matter with a very low shear viscosity to entropy density ratio close to the conjectured lower bound for a strongly interacting system, Kovtun et al. (2005).
While early studies have been focused on elliptic flow generated by the global almond shape of the fireball for non central collisions. In the recent years the possibility to measure experimentally the event-by-event angular distribution of emitted particle has made possible to go beyond such a simplified picture accessing the fluctuating shape that encodes higher order harmonics generating non zero flows Adare et al. (2011); Richardson (2012); Aad et al. (2012). Hence most of the research activity has been now focused on the study of the effects of the fluctuations in the initial geometry due to the fluctuations of the position of the nucleons in the overlap region of the collision Petersen et al. (2010); Qin et al. (2010); Holopainen et al. (2011); Schenke et al. (2012); Gale et al. (2013); Bravina et al. (2014). Such fluctuations in the initial geometry are sources for momentum anisotropies of any n-th order harmonics and in particular of the triangular flow , that especially in ultra-central collisions appears as the largest one Abelev et al. (2013); Aad et al. (2012); Chatrchyan et al. (2014).
The comparison between event-by-event viscous hydrodynamical calculations and the experimental results for seems to confirm a finite but not too large value of Schenke et al. (2012); Gale et al. (2013). However, small values of is not an evidence of the creation of a QGP phase. A phenomenological estimation of its temperature dependence could give information if the matter created in these collisions undergoes a phase transition Csernai et al. (2006); Lacey et al. (2007); Plumari et al. (2013a). Information about a temperature dependence of can be achieved studying the and the high order harmonic in a wider range of energies. Similar studies have been performed using a transport approach but only for the elliptic flow in an approach not incorporating event-by-event fluctuations Plumari et al. (2013a); Plumari et al. (2014). In this paper we extend this analysis to high order harmonics studying the role of the on the build up of using for the first time a cascade approach with initial state fluctuations.
There are several theoretical indications that should have a particular behavior with the temperature Csernai et al. (2006); Lacey et al. (2007); Prakash et al. (1993); Chen et al. (2007); Meyer (2007); Das and Alam (2011). As an example in Fig.1 it is shown a collection of theoretical results about the temperature dependence of . Fig.1 shows that in general should have a typical behavior of phase transition with a minimum close to the critical temperature Csernai et al. (2006); Lacey et al. (2007); Plumari et al. (2013a); Plumari et al. (2014).
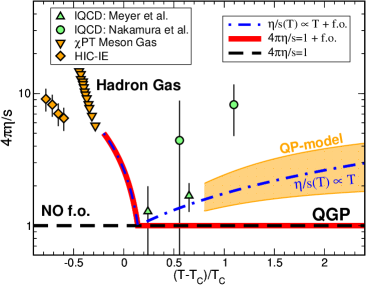
On one hand at low temperature estimates of in the chiral perturbation theory for a meson gas Prakash et al. (1993); Chen et al. (2007), have shown that in general is a decreasing function with the temperature, see down-triangles in Fig.1. Similar results for have been extrapolated from heavy-ion collisions at intermediate energies, see HIC-IE diamonds in Fig.1. On the other hand at higher temperature lQCD calculation have shown that in general becomes an increasing function with the temperature Meyer (2007); Nakamura and Sakai (2005), see up-triangles and circles in Fig.1, but due to the large error bars in the lQCD results for it is not possible to infer a clear temperature dependence in the QGP phase. The analysis at different energies of and the extension to high order harmonics can give further information about the T dependence of . In this paper we study and discuss the build-up of anisotropic flows in ultra-relativistic HIC treating the system as a fluid with some . This is achieved by mean of a transport approach with initial state fluctuations. The paper is organized as follows. In Section II, we introduce the transport approach at fixed shear viscosity to entropy density . In Section III, we discuss the initial conditions and in particular the implementation of the initial state fluctuations in the transport approach. In Section IV, we study the time evolution of the anisotropic flows and the effect of the on the differential . Finally in Section V we study the correlations between the initial asymmetry in coordinate space measured by the coefficients and the final anisotropy in momentum space measured by the anisotropic flows . In this paper we will show results on for and for the two different systems at and at at different centralities.
II Kinetic approach at fixed shear viscosity to entropy density ratio
In this work we employ the kinetic transport theory to study the evolution of the fireball created in relativistic heavy-ion collisions. We perform such simulations using a relativistic transport code developed in these years to perform studies of the dynamics of heavy-ion collisions at both RHIC and LHC energies Ferini et al. (2009); Plumari and Greco (2012); Plumari et al. (2013b); Plumari et al. (2012); Ruggieri et al. (2013, 2014). The evolution of the phase-space distribution function is given by solving the Relativistic Boltzmann Transport (RBT) equation:
| (1) |
where is the Boltzmann-like collision integral. In the result shown in this paper we have considered only the processes and for one component system can be written as,
| (2) |
where and denotes the transition amplitude for the elastic processes which is directly linked to the differential cross section with the Mandelstam invariant. Numerically we solve the RBT equation using the so called test particle method and the collision integral is solved by using Monte Carlo methods based on the stochastic interpretation of transition amplitude Xu and Greiner (2005); Ferini et al. (2009); Plumari et al. (2012).
In the standard use of the transport theory one fixes the microscopical details of the scattering like matrix element or cross sections of the processes to study the effect of the microscopical details on the observables. This is however not our aim we exploit the cross section as a tool to determine the of the system. As shown in Plumari et al. (2015) in the hydrodynamic limit observables like or spectra don’t depend on the microscopic details encoded in . In agreement with the implicit assumption of hydrodynamics. In such an approach it is possible to study directly the impact of on observables like the anisotropic flows which is the main focus of this paper. Compared with the viscous hydrodynamic calculations a kinetic approach at fixed has manly two advantages: first in this approach we start from a description in terms of instead of starting from and it is possible to include initial non equilibrium effects (see Ruggieri et al. (2013, 2014)). Second, this approach is not based on an ansatz for the viscous corrections for the phase-space distribution function with the limitation in the transverse momentum range in order to ensure that . Also this approach provides a tool to study the effect of on the observables in a wider range of and in transverse momentum . Notice also that the kinetic freeze-out can be determined self-consistently with an increasing that determines a smooth switching-off of the scattering rates. A more detailed discussion can be found in previous papers, see Ferini et al. (2009); Ruggieri et al. (2013, 2014). The disadvantage of the present approach is that hadronization has not yet been included. A more general disadvantage is that RBT converge to viscous hydrodynamics with the relaxation time typical of a kinetic theory. However viscous hydrodynamics with relaxation times of kinetic theory have been shown to be in quite good agreement with experimental data.
In order to study the dynamical evolution of the fireball with a certain we determine locally in space and time the total cross section needed to have the wanted local viscosity. As shown in Plumari et al. (2012) the Chapmann-Enskog theory correctly describes the relation between providing a good agreement with the results obtained using the Green-Kubo correlator. In the Chapmann-Enskog theory and for a pQCD inspired cross section, typically used in parton cascade approaches Zhang et al. (1999); Molnar and Gyulassy (2002); Ferini et al. (2009); Greco et al. (2008); Plumari et al. (2010); Xu and Greiner (2005, 2009), , the is given by the following expression:
| (3) |
where , with being the screening mass regulating the angular dependence of the cross section, while is the proper function accounting for the pertinent relaxation time associated to the shear transport coefficient and it is given by:
| (4) |
where -s are the Bessel functions and the function relate the transport cross section to the total cross section with .
In order to study the role of the ratio and its temperature dependence we consider three different cases: one with a constant during all the evolution of the system dashed line in Fig.1 another one with at higher temperature in the QGP phase and an increasing in the cross over region towards the estimated value for hadronic matter Chen et al. (2007); Demir and Bass (2009) shown by solid line in Fig.1. Such an increase of in the cross over region allows for a smooth realistic realization of the kinetic freeze-out. This is because at lower temperature, according to the formula Eq.(3) i.e. the increase of towards the estimated value for the hadronic matter implies the total cross section decrease and this permits to achieve in a self-consistent way the kinetic freeze-out. In the following discussion the term f.o. means to take into account the increase of at low temperature. The third one is shown in Fig.1 by the dot dashed line. In this case we consider the increase of at higher temperature with a linear temperature dependence and a minimum close to the critical temperature with a temperature dependence similar to that expected from general considerations as shown in Fig.1.
III Initial conditions
The main novelty in the present paper is the implementation of initial state fluctuations in a transport cascade approach. We will consider two systems at different centralities: collisions at produced at RHIC and collisions at at LHC. In particular in this section we discuss the implementation of the initial state fluctuations in the above transport approach. In order to generate an event by event initial profile we use the Monte-Carlo Glauber model. In this model the Woods-Saxon distribution is used to sample randomly the positions of the nucleons in the two colliding nucleus and . In this way a discrete distribution for these nucleons is generated. We employ the geometrical method to determine if the two nucleons one from the nucleus and the other one from the nucleus are colliding. Within this method two nucleons collide each other if the relative distance in the transverse plane is where is the nucleon-nucleon cross section. In our calculation we have used for RHIC and for LHC. and are given by counting the number of collisions and the number of participating nucleons for each event. The next step is the conversion of the discrete distribution for the nucleons into a smooth one by assuming for each nucleon a gaussian distribution centered in the nucleon position. In our model we choose to convert the information of the nucleon distribution into the density in the transverse plane which is given by the following sum
| (5) |
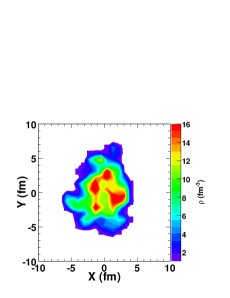
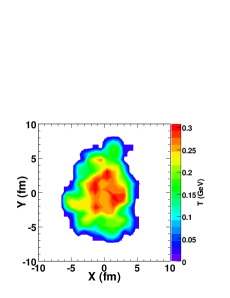
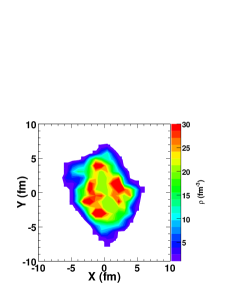
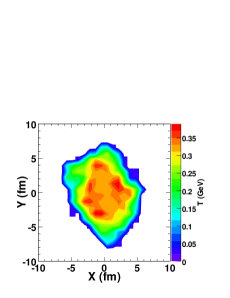
where is an overall normalization factor fixed by the longitudinal distribution while is the Gaussian width which regulates the smearing of the fluctuations and in the following calculations it has been fixed to . In our calculation we have assumed initially a longitudinal boost invariant distribution from to . In the first column of Fig.2 it is shown the contour plot of the initial transverse density at mid rapidity for a given event with impact parameter . The upper panel refers to the system at and the lower panel to at .
The transverse density fixes the initial anisotropy in coordinate space that is quantified in terms of the following coefficients :
| (6) |
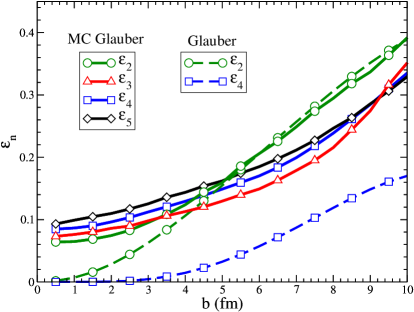
where and is the polar coordinate in the transverse plane. In Fig.3 it is shown the initial spatial anisotropies and as a function of the impact parameter. The second coefficient shows a stronger dependence with the impact parameter with respect to the other coefficients because it acquires a contribution due to the global almond shape of the fireball while the other harmonics have most of their origin in the fluctuations of the positions of the nucleons. For more central collisions the is even smaller than the other harmonics because when the effect of the elliptic overlap region disappears it becomes more difficult to have fluctuations of the positions of the nucleons along only one preferential direction.
For the initialization in momentum space at RHIC (LHC) energies we have considered for partons with transverse momentum () a thermalized spectrum in the transverse plane. Assuming the local equilibrium the initial local temperature in the transverse plane is evaluated by using the standard thermodynamical relation with with and . In the right column of Fig.2 it is shown the corresponding initial local temperature in transverse plane. As shown in the central region of the fireball for mid peripheral collision we can reach temperature at RHIC and at LHC. While for partons with we have assumed the spectrum of non-quenched minijets according to standard NLO-pQCD calculations with a power law shape Greco et al. (2003a, b). In coordinate space the partons with have been distribuited according the binary collisions. The initial transverse momentum of the particles is distributed uniformly in the azimuthal angle. We fix the initial time of the simulation to for RHIC and for LHC.
In the following discussion, we will consider two different types of initial conditions. One consisting in a fixed initial distribution by using the standard Glauber model as used in previous works, see Ferini et al. (2009); Plumari and Greco (2012); Plumari et al. (2013b, a). The second one consisting of an initial profile changing event by event according to the MC Glauber model as discussed before.
In our simulations we have used events for each centrality class. This number is enough to get solid results for the spectra, differential elliptic flow and high order flow coefficients . For the study of the correlations between the initial and the final that will be shown in the next section we have extended this analysis to events. The inclusion of the initial state fluctuations introduce a further difficulties because in order to get stable results we need to have a good sampling of the initial geometry event by event and this is controlled by the total number of test particles . Furthermore an irregular initial profile need a good calculation grid resolution. We have checked the convergency of our results for , and with the lattice spacing of the calculation grid and . We found the convergency for a grid with a transverse area of the cell and as total number of test particles per event.
The elliptic flow and the high order harmonics , and have been calculated as
| (7) |
where the momentum space angles are given by
| (8) |
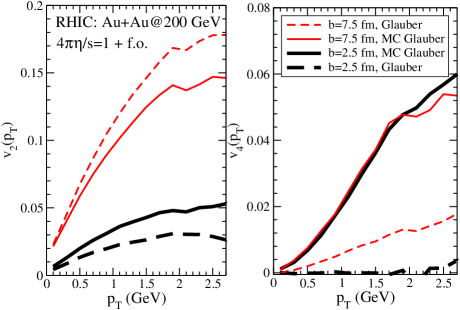
In this section first we discuss the comparison between the Glauber model w/o initial fluctuations with the MC Glauber with fluctuations. Without initial state fluctuations only even harmonics can be generated therefore we will consider here only and . In the left panel of Fig.4 we compare the differential elliptic flow obtained with an initial state that changes event by event according to the MC Glauber model (solid lines) as discussed in details the previous section with the one obtained for the case with an averaged initial profile (dashed lines). These results are for collisions at and for centrality class. In these calculations we have considered at high temperature and an increasing at lower temperature as shown by the red solid line in Fig.1. As shown for mid peripheral collision (with ) the effect of the fluctuations in the initial geometry is to reduce the of about , despite the same initial eccentricity in Glauber and MC Glauber, see green solid and dashed lines in Fig.3. The reduced efficiency in building up the is related to the fact that for an irregular geometry in the transverse plane the pressure gradients generate also a small counter-flow towards the inner part of the fireball reducing the azimuthal anisotropy in momentum space due to the global almond shape. The introduction of the fluctuations in the initial geometry play the role to generate the higher order harmonics in particular the odd harmonics which were absent by symmetry in the averaged initial configuration. In the right panel of Fig.4 we show the same comparison for the quadrangular flow . We observe an opposite behaviour: the initial state fluctuations increase the final by a factor of . This result is related to the fact that the fluctuations introduce about a factor larger initial as shown by the comparison between blue solid and dashed lines in Fig.3. In other words for mid peripheral collisions most of comes from the global almond shape while comes normally from the initial fluctuations. In fact as shown by the black thick solid and dashed lines in the left panel of Fig.3 the effect of the fluctuations is to produce a larger . From the comparison between thick black solid and dashed line in the right panel of Fig.3 we observe a non zero that was absent in the averaged initial profile where the initial (see blue dashed line in Fig.3). Moreover we observe a low sensitivity of with the centrality similarly to the experimental data at RHIC energies Richardson (2012). Such a behaviour would be impossible to explain without initial state fluctuations.
IV Effects of on the
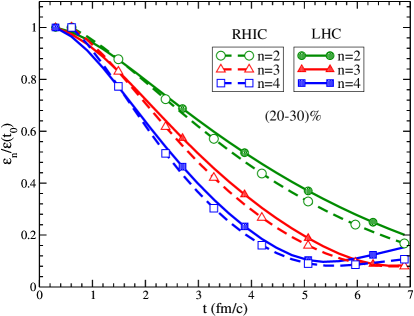
In the first part of this section we discuss the time evolution of the eccentricities and the anisotropic flows coefficients for collisions at (solid lines) and for collisions at In Fig.5 we plot the time evolution of the normalized to the initial eccentricity for RHIC and for LHC. At very early times the small deformation of the fireball in the transverse plane decrease linearly with time and at first order of this deformation we have that . This gives the ordering in the time evolution of shown in Fig.5. the time evolution of is faster for larger .
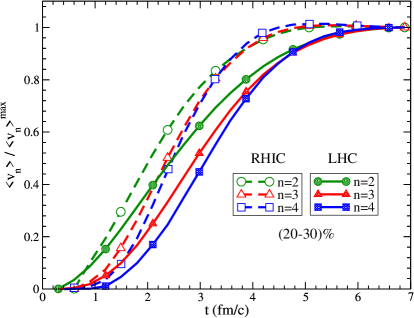
On contrary show an opposite behaviour during the early times of the expansion of the fireball. In Fig.6 it shown the average normalized to its maximum value at the end of the expansion. The appear later for larger and their development is flatter at early times for larger . Similar results have been obtained in a transport approach where considerations on the early times evolution of the fireball give that Alver et al. (2010); Gombeaud and Ollitrault (2008).
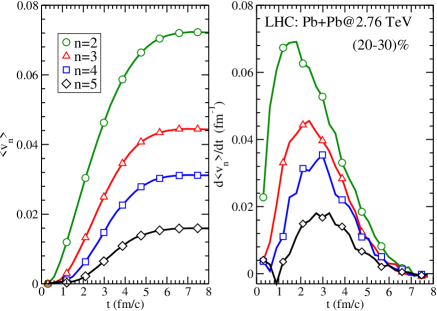
As shown in left panel of Fig.7 we observe that in the time evolution of the different harmonics the ordering is present also at late times. In right panel of Fig.7 it is shown the production rate for the different harmonics and as shown different harmonics have different production rates. In particular, we observe that at very early time the second harmonic has a non zero value for at variance with higher harmonics for which . This different behaviour could be the origin of the stronger correlation between the final elliptic flow and its initial eccentricity that becomes weaker between the final and the initial for higher harmonics (), see Section V.
Differential flow coefficients are observables that carry out more information about the fireball created in the heavy ion collisions in particular because they are sensitive to the transport properties of the medium like the ratio. In the following discussion we will study the effect of the on the build up of the elliptic flow and on the high order harmonics , and . With we mean the root mean square as it has been done in experimental data using the event plane method. In the upper panel of Fig.8 it is shown the elliptic flow (green thick lines) and the (blue thin lines) at mid rapidity and for centrality for both RHIC at (left panel) and LHC at (right panel). In general in agreement with what has been obtained in viscous hydrodynamical calculations, the increase of the viscosity of the medium has the effect to reduce both and .
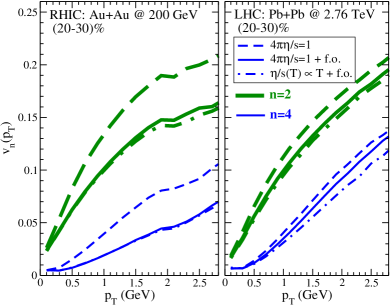
As we can see at RHIC energies comparing the thick dashed lines with the solid ones, in the left panel of Fig.8, the is sensitive to the increase of the at lower temperature close to the cross over region. In particular the effect is a reduction of the elliptic flow of about . A similar trend were observed for the 4-th harmonic where we have a reduction due to the increase of at lower temperature but the effect in this case is about a factor two larger then the previous one, i.e. about . The different sensitivity to the can be attributed to their different formation time, Greco et al. (2008). As shown in Fig.6 each harmonics start to develop at different times. In particular has its maximum development approximatively at while the at . This means that different harmonics probe mainly different temperatures and different value of the ratio. Assuming that the first few of the expanding fireball are dominated by the 1D longitudinal expansion Ruggieri et al. (2013) where approximatively we have that when has its maximum development at about the temperature is at RHIC and at LHC. In other words this tell us that at RHIC energies mainly develops closer to the cross over region where should increase.
On the other hand at LHC energies, left panel of Fig.8, the scenario is different, the elliptic flow is almost unaffected by the increase of ratio at low temperature (in the hadronic phase) as we can see comparing the green thick dashed line with the solid one. Instead we observe that the increase of at lower temperature has a more sensitive effect on the with a reduction of about , see blue solid and dashed lines. Again this different sensitivity to the in the cross over region between and at LHC are consistent with the results obtained at RHIC energies and depends on the different formation time of the harmonics in relation to the initial T of the system. The greater sensitivity at RHIC energies of both and to the at low temperature is related to the different life time of the fireball. In fact the life time of the fireball at LHC is greater than that at RHIC, 8-10 at LHC against 4-5 at RHIC. In general this means that at RHIC energies the have not enough time to fully develop in the QGP phase. While at LHC energies we have that the develops almost completely in the QGP phase and therefore it is less sensitive to the dynamics in the cross-over and hadronic region. This result were firstly found w/o initial state fluctuation in refs.Plumari and Greco (2012); Plumari et al. (2013b); Niemi et al. (2012) but remain similar also with fluctuations. The last however allow to study for the first time a similar effect also on .
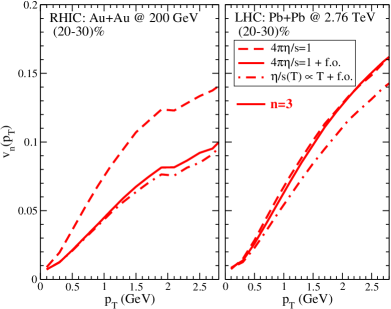
In Fig.8 it is shown the effect of an in the QGP phase. In the comparison between the solid lines and the dot dashed ones the only difference is in the linear temperature dependence of for while at lower temperature we have the same dependence (see dot dashed lines in Fig.1). As we can see the at LHC is sensitive to the change of at higher temperature while at RHIC energies the is completely unaffected by this change. In the lower panel of Fig.8 it is shown the triangular flow (red lines) at mid rapidity for centrality and for both RHIC at (left panel) and LHC at (right panel). In agreement with what has been obtained for the even harmonics and , we observe at RHIC energies a reduction of due to the increase of the at low temperature with a reduction of about , while at LHC it is almost insensitive to the change of in the cross over region. However we observe that at LHC the third and fourth harmonics are more sensitive to the change of with respect to the elliptic flow with a deviation of about for and against a less for . Still it has be noted that such a sensitivity is quite small to hoping a determination of the T dependence of from the .
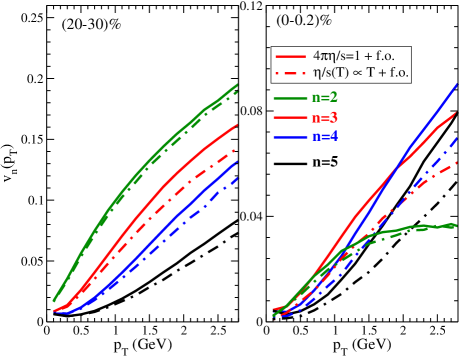
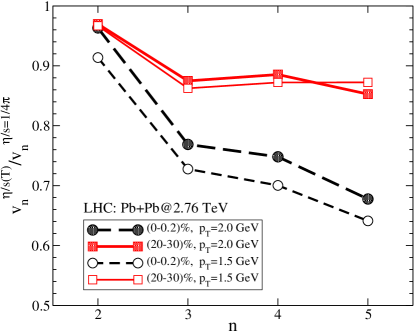
Very recently it has been possible to access also experimentally to the ultra-central collisions. The ultra-central collisions are interesting because the initial come completely from the fluctuations in the initial geometry rather than by global geometric overlap region. In Fig.9 it is shown the comparison of produced in at collisions for different centralities: left panel for mid-peripheral collisions and right panel for central collisions. Different colors are for different harmonics. Solid lines refer to the case with in the QGP phase and the increase at low temperature as shown in Fig.1 by red solid lines while the dot-dashed lines refer to the case with in the QGP phase and the increase at low temperature as shown in Fig.1 by blue dot dashed lines. From the comparison we observe that at low both centralities the are much flatter for larger . This results is in agreement with that obtained in hydrodynamic calculations where Hatta et al. (2014). On the other hand at hight for ultra-central collisions we observe that the elliptic flow shows a saturation while for increase linearly with . This is in qualitative agreement with what has been observed experimentally, but a quantitative comparison would require the inclusion of hadronization that however would not affect the sensitivity to . In particular the sensitivity to the value of in the QGP phase increase with the increasing the order of the harmonics in agreement with the fact that viscous corrections to increase with the harmonics Plumari et al. (2015). Furthermore we observe that reduction of due to the increase of in the QGP phase (dot dashed lines) is strongly enhanced for ultra-central collisions. As shown in Fig.10 for the reduction for central collisions is about against a reduction of about for mid peripheral collisions. It is indeed remarkable that a effect is determined by a slowly linear rising of with T as the one considered and depicted in Fig.1. In particular in central collisions higher harmonics acquire a larger sensitivity to the value of the viscosity in the QGP phase. Therefore our study suggest that to have information about one should focus on ultra-central collisions. This point is further strenghtened by the study of the correlations between and the initial eccentricities that we discuss in the next section.
V Correlations between and
In recent years, the correlation between integrated and high order harmonics with the initial asymmetry in coordinate space and have been studied in the event-by-event ideal and viscous hydrodynamics framework Gardim et al. (2012); Chaudhuri et al. (2013); Niemi et al. (2013). In general it has been shown that the elliptic flow is strongly correlated with initial eccentricity while a weaker correlation has been found for higher harmonics with and . One explanation for the weak correlation observed between and is that for final there is also a correlation with the initial . In particular in Gardim et al. (2012) has been shown that it possible to have a good linear correlation between and a linear combination of the initial and .
In this section we discuss these correlations within an event by event transport approach with initial state fluctuations. A measure of the linear correlation is given by the correlation coefficient given by the following expression:
| (9) |
where and are the values of and corresponding to the given event and evaluated according Eq.s (6) and (7). corresponds to a strong linear correlation between the initial and the final .
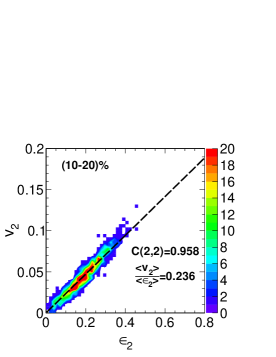
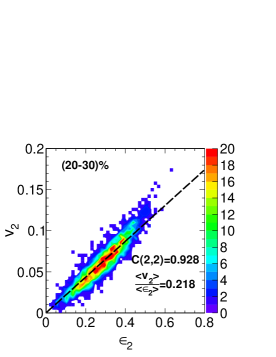
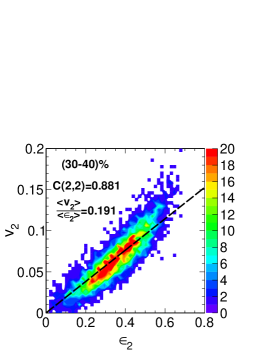
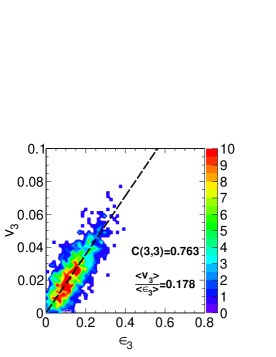
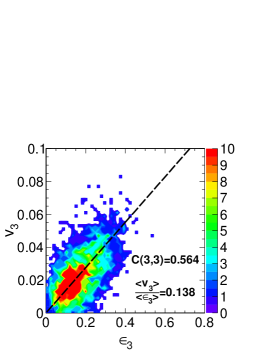
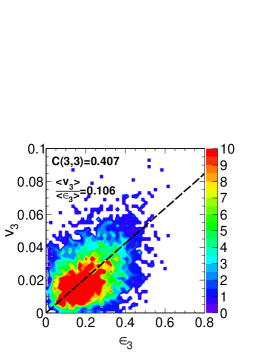
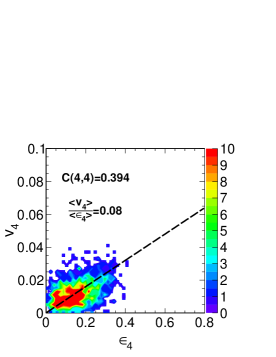
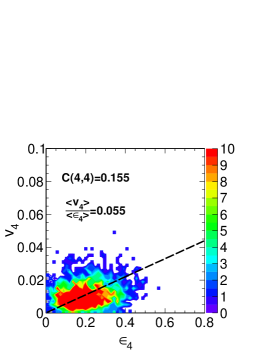
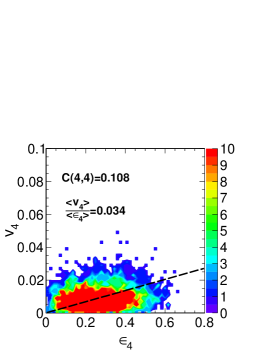
The results shown in this section have been obtained with events for each centrality class a total number of test particle per event . In Fig.11, it is shown the two-dimensional plots of the integrated flow coefficients as a function of the corresponding initial for each event. The results shown are for collisions at and for three different centralities , and . The viscosity has been fixed to plus a kinetic f.o. realized by the increase in as in Fig.1. As shown in the upper panel we observe a stronger linear correlation between and for mid central collisions with a linear correlation coefficient that shows a monotonic behaviour with the collision centrality from for to for . Qualitatively the results are in agreement with the one obtained within a 2+1D viscous hydrodynamics, see Niemi et al. (2013). In general we observe a slightly smaller degree of correlation probably induced by the fact that we simulate a 3+1D expansion that can be expected to contribute to the decorrelation. In the middle and lower panel of Fig.11 we have shown similar plots for the third and fourth harmonics. We observe again a reduction of the correlation coefficient with the centrality of the collision similarly to and . We obtain that the correlation between and for all the collision centralities is weaker with respect to that obtained for the elliptic flow. Furthermore the fourth harmonic flow shows a weak correlation with the initial in particular for mid-peripheral collisions where the linear correlation coefficient is quite weak . Furthermore we observe that the ratio (see dashed lines in Fig.11) decreases when decreases the correlation coefficient , i.e. for more peripheral collisions.
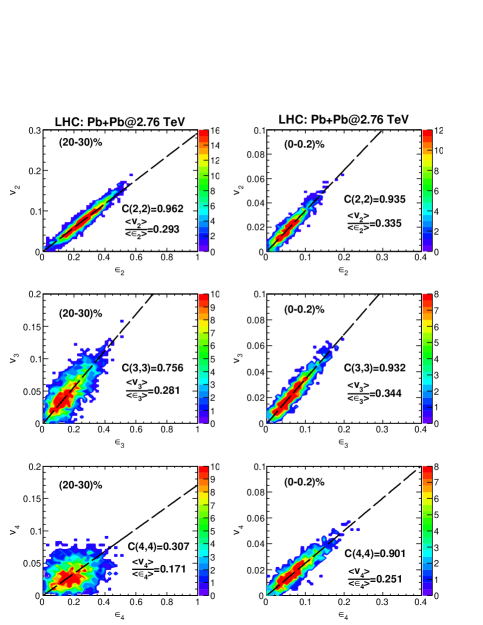
A similar behaviour for the linear correlation coefficient is observed at LHC energies for collisions at . In Fig.12 it is shown the comparison between ultra-central and mid-peripheral collision at LHC energies at . In ultra-central collisions the are more correlated to the initial than at peripheral collisions and very interesting differences emerge looking also at higher harmonics.
In order to better visualize and discuss such differences we have plot in Fig.13 the as a function of the impact parameter for both RHIC (dashed lines) and LHC energies (solid lines).
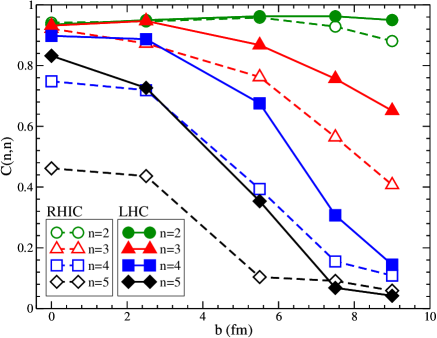
As shown the linear correlation coefficient is a decreasing function of the impact parameter for all the harmonics. However, as we can see comparing the dashed and solid lines show, at LHC energies there is a stronger correlation between and for all with respect to RHIC energies. We observe that and have the same degree of correlation for both RHIC and LHC energies while a lower degree of correlation it is shown for higher harmonics and . More interesting is the fact that for ultra-central collisions at LHC the linear correlation coefficient remains above for and even the shows large . This can be visualized also in the right panel of Fig.12 where the (,) correlation plot is shown in mid-peripheral () collisions (left panel) and in ultra-central collisions () (right panels).
The strong correlation observed for ultra-central collisions means that the value obtained for and its dependence with the harmonics for those collisions is strongly related to the value of the initial asymmetry measure . In particular this could imply that the structure of the at LHC where carry out information about the initial geometry of the fluctuations. This joined to the observation that for ultra-central collisions the sensitivity of to is increased by about a factor of 2-3 strongly suggests to focus the experimental efforts at LHC highest energy and ultra-central collisions.
To study the effect of the viscosity and its possible temperature dependence on the correlation we have studied how change the correlation coefficient with the different parametrizations for . In Table 1 we show the results for for the two energies RHIC and LHC for centrality class. In general for this centrality we observe that at LHC energies and for all the viscosities considered the degree of correlation between and is greater than the one at RHIC energies. Moreover we obtain that at LHC the correlation coefficient is not sensitive to the change of the viscosity both at low and high temperature. A slight different behaviour we have at RHIC energies where the effect of the kinetic freeze out is to reduce the degree of correlation between the initial and the final .
| + f.o. | + f.o. | |||
|---|---|---|---|---|
| 2 | 0.95 | 0.94 | 0.93 | |
| RHIC | 3 | 0.70 | 0.58 | 0.65 |
| 4 | 0.30 | 0.28 | 0.31 | |
| 2 | 0.96 | 0.96 | 0.96 | |
| LHC | 3 | 0.78 | 0.78 | 0.74 |
| 4 | 0.39 | 0.38 | 0.38 |
Furthermore, we have computed the non diagonal components for the linear correlation coefficient . We found that and for all the range of centralities explored which means that there is no linear correlation between and and and . A different behaviour we observe for which is seen to be an increasing function with the centrality for central collision () and about at . This means that in more peripheral collisions the 4th harmonic has some contamination of and it is not driven only by as already suggested in Gardim et al. (2012).
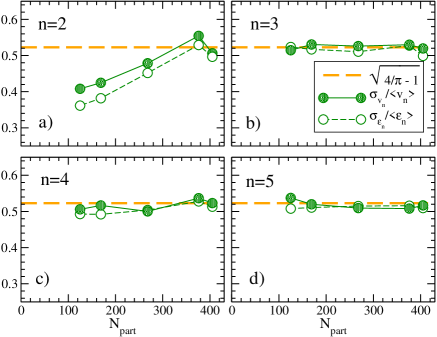
Some interesting properties of the distributions can be inferred by studying the centrality dependence of the relative fluctuations . In Fig.14a) it is shown the dependence of the ratios and where and are the standard deviation respectively for and . As shown for we observe a strong dependence of the relative fluctuations with the centrality of the collision with for . For more central collisions this ratio approaches the value expected for a 2D Gaussian distribution where Aad et al. (2013), shown by dashed line in Fig.14. For higher harmonic and as shown from Fig.14b) to Fig.14d) the values of are approximatively the same of the ones of the initial geometry with and they are almost independent of the collision centrality and for all the centralities studied they are very close to the the value shown by the dashed lines. These results imply that the distributions of and for all the centrality range studied are consistent with the fluctuation-only scenario discussed in Aad et al. (2013) and these fluctuations are related to the fluctuations of the initial geometry. On the other hand, the distribution of is close to this limit for most central collisions while for mid-peripheral collisions there is a contribution coming from the global average geometry.
VI Conclusions
Using an event-by-event transport approach we have investigated the build up of the anisotropic flows for and . In particular we have studied the effect of ratio on for two different beam energies: at RHIC for collisions at and at LHC for collisions at . We have found that at RHIC the are more affected by the value of at low temperature () and the sensitivity increases with the order of the harmonics. At LHC we get a different effect, all the develop in the QGP phase at and are not affected by the value of in the cross-over region. However the sensitivity to the T dependence of the is quite weak, more specifically a constant or an induce differences in the of at most a and of about a in . The novel result from our analysis is that such a scenario changes for ultra-central collisions where found an enhancement of the sensitivity of the that for reaches about a . We have also studied the correlation between the initial asymmetry in coordinate space, measured by , and the final asymmetry in momentum space given by . We have found that larger is the collision energy larger is the degree of correlation between and . At LHC there is significantly more correlation than at RHIC. For both collision energies considered and in all the range of impact parameter studied the is strongly correlated with the with the linear correlation coefficient . The degree of correlation between and the corresponding decrease for higher harmonics. Moreover, in ultra-central collisions we found that for and which imply that the and they carry out the information about the initial geometry of the fireball. These results joined with the fact that in ultra central collisions the have a large sensitivity to the ratio strongly suggest to focus the experimental effort to these collision centrality where it is possible to get better constraint on the value of in the QGP phase and having a new insight on the initial state fluctuations.
VII Acknowledgments
V.Greco, S. Plumari, F. Scardina and G.L. Guardo acknowledge the support of the ERC-StG Grant under the QGPDyn project.
References
References
- Adams et al. (2005) J. Adams et al. (STAR Collaboration), Nucl.Phys. A757, 102 (2005), eprint nucl-ex/0501009.
- Aamodt et al. (2010) K. Aamodt et al. (ALICE Collaboration), Phys.Rev.Lett. 105, 252302 (2010), eprint 1011.3914.
- Romatschke and Romatschke (2007) P. Romatschke and U. Romatschke, Phys.Rev.Lett. 99, 172301 (2007), eprint 0706.1522.
- Song and Heinz (2008) H. Song and U. W. Heinz, Phys.Rev. C78, 024902 (2008), eprint 0805.1756.
- Ferini et al. (2009) G. Ferini, M. Colonna, M. Di Toro, and V. Greco, Phys.Lett. B670, 325 (2009), eprint 0805.4814.
- Xu and Greiner (2009) Z. Xu and C. Greiner, Phys.Rev. C79, 014904 (2009), eprint 0811.2940.
- Plumari and Greco (2012) S. Plumari and V. Greco, AIP Conf.Proc. 1422, 56 (2012), eprint 1110.2383.
- Kovtun et al. (2005) P. Kovtun, D. Son, and A. Starinets, Phys.Rev.Lett. 94, 111601 (2005), eprint hep-th/0405231.
- Adare et al. (2011) A. Adare et al. (PHENIX Collaboration), Phys.Rev.Lett. 107, 252301 (2011), eprint 1105.3928.
- Richardson (2012) E. Richardson (PHENIX Collaboration), PoS QNP2012, 146 (2012), eprint 1206.3501.
- Aad et al. (2012) G. Aad et al. (ATLAS), Phys. Rev. C86, 014907 (2012), eprint 1203.3087.
- Petersen et al. (2010) H. Petersen, G.-Y. Qin, S. A. Bass, and B. Muller, Phys.Rev. C82, 041901 (2010), eprint 1008.0625.
- Qin et al. (2010) G.-Y. Qin, H. Petersen, S. A. Bass, and B. Muller, Phys.Rev. C82, 064903 (2010), eprint 1009.1847.
- Holopainen et al. (2011) H. Holopainen, H. Niemi, and K. J. Eskola, Phys.Rev. C83, 034901 (2011), eprint 1007.0368.
- Schenke et al. (2012) B. Schenke, S. Jeon, and C. Gale, Phys.Rev. C85, 024901 (2012), eprint 1109.6289.
- Gale et al. (2013) C. Gale, S. Jeon, B. Schenke, P. Tribedy, and R. Venugopalan, Phys.Rev.Lett. 110, 012302 (2013), eprint 1209.6330.
- Bravina et al. (2014) L. Bravina, B. Brusheim Johansson, G. K. Eyyubova, V. Korotkikh, I. Lokhtin, et al., Eur.Phys.J. C74, 2807 (2014), eprint 1311.7054.
- Abelev et al. (2013) B. Abelev et al. (ALICE), Phys. Lett. B719, 18 (2013), eprint 1205.5761.
- Chatrchyan et al. (2014) S. Chatrchyan et al. (CMS), JHEP 02, 088 (2014), eprint 1312.1845.
- Csernai et al. (2006) L. P. Csernai, J. Kapusta, and L. D. McLerran, Phys.Rev.Lett. 97, 152303 (2006), eprint nucl-th/0604032.
- Lacey et al. (2007) R. A. Lacey, N. Ajitanand, J. Alexander, P. Chung, W. Holzmann, et al., Phys.Rev.Lett. 98, 092301 (2007), eprint nucl-ex/0609025.
- Plumari et al. (2013a) S. Plumari, V. Greco, and L. Csernai (2013a), eprint 1304.6566.
- Plumari et al. (2014) S. Plumari, V. Greco, and L. Csernai, Nuovo Cim. C037, 68 (2014).
- Prakash et al. (1993) M. Prakash, M. Prakash, R. Venugopalan, and G. Welke, Phys.Rept. 227, 321 (1993).
- Chen et al. (2007) J.-W. Chen, Y.-H. Li, Y.-F. Liu, and E. Nakano, Phys.Rev. D76, 114011 (2007), eprint hep-ph/0703230.
- Meyer (2007) H. B. Meyer, Phys.Rev. D76, 101701 (2007), eprint 0704.1801.
- Das and Alam (2011) S. K. Das and J.-e. Alam, Phys.Rev. D83, 114011 (2011), eprint 1011.4181.
- Plumari et al. (2011) S. Plumari, W. M. Alberico, V. Greco, and C. Ratti, Phys.Rev. D84, 094004 (2011), eprint 1103.5611.
- Nakamura and Sakai (2005) A. Nakamura and S. Sakai, Phys.Rev.Lett. 94, 072305 (2005), eprint hep-lat/0406009.
- Plumari et al. (2013b) S. Plumari, A. Puglisi, M. Colonna, F. Scardina, and V. Greco, J.Phys.Conf.Ser. 420, 012029 (2013b), eprint 1209.0601.
- Plumari et al. (2012) S. Plumari, A. Puglisi, F. Scardina, and V. Greco, Phys.Rev. C86, 054902 (2012), eprint 1208.0481.
- Ruggieri et al. (2013) M. Ruggieri, F. Scardina, S. Plumari, and V. Greco, Phys.Lett. B727, 177 (2013), eprint 1303.3178.
- Ruggieri et al. (2014) M. Ruggieri, F. Scardina, S. Plumari, and V. Greco, Phys.Rev. C89, 054914 (2014), eprint 1312.6060.
- Xu and Greiner (2005) Z. Xu and C. Greiner, Phys.Rev. C71, 064901 (2005), eprint hep-ph/0406278.
- Plumari et al. (2015) S. Plumari, G. L. Guardo, V. Greco, and J.-Y. Ollitrault, Nucl. Phys. A941, 87 (2015), eprint 1502.04066.
- Zhang et al. (1999) B. Zhang, M. Gyulassy, and C. M. Ko, Phys.Lett. B455, 45 (1999), eprint nucl-th/9902016.
- Molnar and Gyulassy (2002) D. Molnar and M. Gyulassy, Nucl.Phys. A697, 495 (2002), eprint nucl-th/0104073.
- Greco et al. (2008) V. Greco, M. Colonna, M. Di Toro, and G. Ferini, Prog.Part.Nucl.Phys. (2008), eprint 0811.3170.
- Plumari et al. (2010) S. Plumari, V. Baran, M. Di Toro, G. Ferini, and V. Greco, Phys.Lett. B689, 18 (2010), eprint 1001.2736.
- Demir and Bass (2009) N. Demir and S. A. Bass, Phys.Rev.Lett. 102, 172302 (2009), eprint 0812.2422.
- Greco et al. (2003a) V. Greco, C. Ko, and P. Levai, Phys.Rev.Lett. 90, 202302 (2003a), eprint nucl-th/0301093.
- Greco et al. (2003b) V. Greco, C. Ko, and P. Levai, Phys.Rev. C68, 034904 (2003b), eprint nucl-th/0305024.
- Alver et al. (2010) B. H. Alver, C. Gombeaud, M. Luzum, and J.-Y. Ollitrault, Phys.Rev. C82, 034913 (2010), eprint 1007.5469.
- Gombeaud and Ollitrault (2008) C. Gombeaud and J.-Y. Ollitrault, Phys.Rev. C77, 054904 (2008), eprint nucl-th/0702075.
- Niemi et al. (2012) H. Niemi, G. Denicol, P. Huovinen, E. Molnar, and D. Rischke, Phys.Rev. C86, 014909 (2012), eprint 1203.2452.
- Hatta et al. (2014) Y. Hatta, J. Noronha, G. Torrieri, and B.-W. Xiao, Phys.Rev. D90, 074026 (2014), eprint 1407.5952.
- Gardim et al. (2012) F. G. Gardim, F. Grassi, M. Luzum, and J.-Y. Ollitrault, Phys.Rev. C85, 024908 (2012), eprint 1111.6538.
- Chaudhuri et al. (2013) A. Chaudhuri, M. R. Haque, V. Roy, and B. Mohanty, Phys.Rev. C87, 034907 (2013), eprint 1211.2040.
- Niemi et al. (2013) H. Niemi, G. Denicol, H. Holopainen, and P. Huovinen, Phys.Rev. C87, 054901 (2013), eprint 1212.1008.
- Aad et al. (2013) G. Aad et al. (ATLAS Collaboration), JHEP 1311, 183 (2013), eprint 1305.2942.