Untangling the Recombination Line Emission from HII Regions with Multiple Velocity Components
Abstract
H II regions are the ionized spheres surrounding high-mass stars. They are ideal targets for tracing Galactic structure because they are predominantly found in spiral arms and have high luminosities at infrared and radio wavelengths. In the Green Bank Telescope H II Region Discovery Survey (GBT HRDS) we found that of first Galactic quadrant H II regions have multiple hydrogen radio recombination line (RRL) velocities, which makes determining their Galactic locations and physical properties impossible. Here we make additional GBT RRL observations to determine the discrete H II region velocity for all 117 multiple-velocity sources within . The multiple-velocity sources are concentrated in the zone , coinciding with the largest regions of massive star formation, which implies that the diffuse emission is caused by leaked ionizing photons. We combine our observations with analyses of the electron temperature, molecular gas, and carbon recombination lines to determine the source velocities for 103 discrete H II regions ( of the sample). With the source velocities known, we resolve the kinematic distance ambiguity for 47 regions, and thus determine their heliocentric distances.
1 Introduction
H II regions are created by the ionizing radiation from massive stars. Only stars with spectral types of B0 or earlier are capable of producing the ultra-violet photons necessary to appreciably ionize the surrounding interstellar medium (ISM). Such stars only live Myr and therefore H II regions trace star formation at the present epoch. Since H II regions surround massive stars, they trace spiral structure and can be used to understand the structure of our Galaxy. H II region distances are required to turn measured properties (i.e., flux and angular size) into physical properties (i.e., luminosity and physical size). Distances are also essential for using H II regions for studies of Galactic structure and large-scale Galactic star formation.
In the Green Bank Telescope H II Region Discovery Survey (GBT HRDS; Bania et al., 2010; Anderson et al., 2011), we detected radio recombination line (RRL) emission from 448 previously unknown Galactic H II regions at X-band (9 GHz; 3 cm). Of the 448 detected targets, 130 () have multiple RRL velocity components: 106 have two components, 23 have three components, and one has four components. Without knowing the source velocity, it is not possible to compute kinematic distances or to derive physical properties (including electron temperature, e.g., Balser et al., 2015, submitted) for the multiple-velocity HRDS H II regions.
H II regions with multiple RRL components are common in the literature, but their numbers have increased with the greater sensitivity of modern instruments. Of the 462 H II regions detected in RRL emission by Lockman (1989), 17 () have multiple components. In the more recent RRL surveys of ultra-compact H II regions by Araya et al. (2002); Watson et al. (2003); Sewilo et al. (2004), the combined percentage of multiple-component RRL H II regions detected is 12%. That nearly 30% of HRDS sources have multiple line components speaks to the sensitivity of the GBT and its ACS spectrometer, and to our efficient observational setup. Within the 2 GHz bandpass at X-band, we were able to simultaneously measure the emission from seven hydrogen RRLs in two polarizations. This allowed very sensitive measurements in short observations; the average on-target integration was min.
There are at least two explanations for the origin of the multiple RRL velocity components. In previous RRL work on H II regions, most authors have assumed that each velocity component arises from a discrete H II region along the line of sight. By “discrete” H II region we mean RRL and free-free continuum radiation stemming from locations that are spatially well-defined on the sky. This emission is distinct from that emanating from diffuse ionized gas that produces RRLs, but does not have detectable continuum emission above the background.
The spatial density of discrete H II regions is not high enough to explain the HRDS multiple-velocity detections, especially given the small GBT beam at X-band (). Using the WISE Catalog of Galactic H II regions (Anderson et al., 2014), we estimate the fractional sky area covered by H II regions. The WISE catalog contains all known Galactic H II regions, and lists approximate H II region sizes based on their WISE mid-infrared emission. The highest density of multiple-velocity H II regions is found in the zone , (see below). Using the WISE catalog sizes, we find that only 16% of the sky area in this zone is covered by known H II regions with measured ionized gas spectral lines (including “grouped” H II regions in large complexes). Just over 2% of the sky area in this zone is covered by more than one region. Even including H II region candidates with weak expected RRL emission that would not have been detected in the HRDS, these numbers are just 22% and 3%, respectively. Most of these overlap regions are in fact caused by H II regions near the same velocity that therefore cannot be the cause of multiple RRL lines. When computing the fractional sky areas, we factored in the GBT X-band beam size by counting regions closer than as overlapping. For an infinitely small beam these numbers would further decrease. Therefore, it seems highly unlikely that the multiple-velocity H II regions can be caused by confusion along the line of sight from H II regions at different velocities. Furthermore, the spatial morphology of the multiple-component H II region images at infrared and radio wavelengths is the same as that of the single-component HRDS sources. There are no additional radio continuum sources seen in the HRDS data, and no additional WISE sources seen superposed on top of their mid-infrared emission. There is no indication that there are two distinct H II regions along the line of sight. This suggests that some of the additional velocity components are due to diffuse ionized gas; these components would thus stem from the “warm ionized medium” (WIM).
The K WIM contains up to 90% of the ionized mass in the Galaxy (Haffner et al., 2009) and is therefore an important, but poorly understood, component of the ISM. It has alternatively been called the “Diffuse Ionized Medium,” the “Galactic Ridge Emission,” or the “Extended Low-Density Medium,” albeit sometimes with slightly different definitions. It has long been thought that massive stars produce the ionizing photon fluxes necessary to create and sustain the WIM (e.g., Reynolds, 1984; Domgorgen & Mathis, 1994). The WIM detected at radio wavelengths is composed of both “worms” and “chimneys” blown out by supernova remnants or successive generations of O-stars (e.g., Heiles et al., 1996), and also of extended diffuse emission from large star-forming regions (see Murray & Rahman, 2010; Roshi et al., 2012).
Recent results from Murray & Rahman (2010) have confirmed what has been known for some time: H II regions are leaky and a large number of the ionizing photons escape beyond their photo-dissociation regions (see Oey & Kennicutt, 1997). A recent study by Anderson et al. (2015) showed that even for the “perfect bubble” H II region RCW 120, where the photodissociation region is thick and extends completely around the H II region, of the ionizing photons are leaking into the nearby ISM.
We hypothesize that most of the additional velocity components are due to the WIM. Lending support to this hypothesis, the H II regions with multiple velocity components are not evenly distributed in the Galaxy, but are clustered near the locations of large star-forming regions that may be leaking photons into the WIM. For example, Anderson et al. (2011) show that 21 of 23 H II regions within of W43 at =() have multiple velocity components. Of these 21 H II regions, all have one velocity component within 10 of the velocity of W43, 91.6 (Lockman, 1989). Furthermore, the strength of the velocity component within 10 of the velocity of W43 decreases with distance from this nominal central position of W43. This is consistent with the idea that the WIM is created and maintained by leaking photons from large H II regions.
No study has yet proven that the large-scale distribution of the WIM is connected to the emission from the Galactic population of discrete H II regions. In part this is because the WIM has traditionally been studied at optical wavelengths, and most Galactic H II regions are not optically visible. In radio observations of the WIM, Heiles et al. (1996) showed that there were plumes of ionized gas extending above and below the plane, and that these plumes were in some cases related to massive star formation regions in the Galactic plane. Alves et al. (2010, 2012, 2014) discussed low-resolution () studies of the RRL emission in the Galactic plane. At the 1.4 GHz frequency of their observations, the intensity of the emission from low-density plasma is enhanced compared to that of observations at higher frequencies. With their low spatial resolution data, however, it is not possible to disentangle the emission from the diffuse ionized gas and discrete H II regions, or to investigate the connection between them.
Here we make RRL observations toward our HRDS sample of first Galactic quadrant H II regions with multiple RRL velocities. Our goal is to resolve which velocity component arises from the discrete H II region.
2 Observations and Data Analysis
We used the GBT 100 m telescope to observe RRLs in a sample of multiple RRL velocity H II regions from 2011 December through 2013 April. Our spectral line observational setup was identical to that of the HRDS (described in Anderson et al., 2011). Our observations made total-power position-switched 6 min. on-target and 6 min. off-target integrations at X-band (9 GHz; 3 cm), hereafter called “pairs.” The on- and off-target integrations followed the same path on the sky, and we observed a single pair for each position. We simultaneously observed the to transitions. We began each observation by measuring a source of known position and intensity in order to obtain pointing and focus corrections. We made no corrections for atmospheric effects.
We reduce the data with the TMBIDL software (T. M. Bania, 2015, private communication). We average the seven transitions together to improve the RRL signal-to-noise ratio (Balser, 2006) and smooth this average spectrum to a velocity resolution of 1.86. This resolution is more than sufficient to resolve the typical 25 full width-half maximum (FWHM) of hydrogen RRLs (Anderson et al., 2011). We remove a baseline (typically third-order) and fit a Gaussian model to each detected RRL component. From the Gaussian fits we derive the line intensity, LSR velocity, and FWHM for each component.
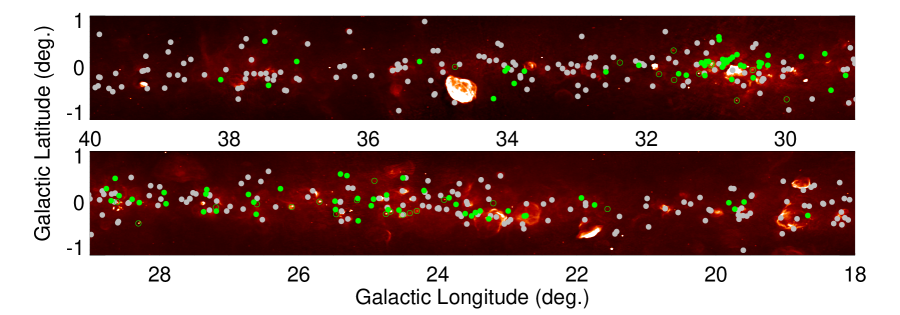
Our source sample consists of all H II regions located within to whose RRL spectra have multiple detected velocity components. We restricted the current study to this longitude range because of the availability of H I data (used in Section 3.2) and the relative accuracy of kinematic distances (see Anderson et al., 2012, Wenger et al., 2015, ins prep.). There are 117 multiple-velocity H II regions within this range: 28 from the literature and 89 from the HRDS. The literature sources were first observed in RRL emission near 5 GHz by Lockman (1989), Lockman et al. (1996), or Sewilo et al. (2004). Figure 1 shows that these multiple-velocity H II regions are not evenly distributed across the Galaxy, but rather are found preferentially in the zone , coinciding with active regions of high mass star formation in the inner Galaxy.
We conduct our observations in two phases. We first observe the 28 literature sources on-target at the nominal peak of the free-free radio continuum intensity to establish X-band (3 cm) line parameters and to verify the measured velocities. We fit Gaussians to each detected line component. In Table Untangling the Recombination Line Emission from HII Regions with Multiple Velocity Components we give the derived RRL peak antenna temperature, LSR velocity, FWHM, and rms noise. The 28 on-target observations resulted in 53 detected lines: 5 observations have one component, 21 have two components, and two have three components. When multiple RRL components are detected, we follow our usual convention and append “a” to the source name of the strongest component, “b” to the source name of the next strongest component, etc. We did not detect multiple velocity components for 5 of these literature H II regions, which could be caused by either a lack of sensitivity in our observations or an error in the original observations.
We next observe, using the same observational setup, positions near all multiple-velocity H II regions (literature and HRDS). The goal of these observations is to identify the discrete H II region source velocities. The WIM is more broadly distributed in the Galactic disk compared to a discrete H II region. Our hypothesis is that observations at positions offset from the multiple-velocity H II regions (“off-target”) will detect only the WIM.
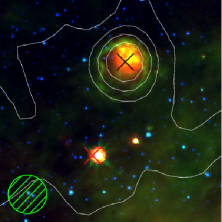
The off-target positions are at least one beam width away from the multiple-velocity H II regions and any other nearby radio continuum sources. A typical separation is a few arcminutes. We determine the off-target positions by examining VGPS 21 cm continuum data (Stil et al., 2006) to identify locations devoid of discrete sources of radio continuum emission (Figure 2). For the 51 cases where the results from the first off-target position do not definitively indicate which line is from the discrete H II region, we observe a second off-target position. In 12 cases, we need a third off-target position and in two cases we need a fourth. Some off-target positions are nearly equidistant between two multiple-velocity H II regions, and single off-target observation can be used for both multiple-velocity regions. In total, we observe 127 off-target positions for the 28 literature and 89 HRDS regions.
The observations of the 127 off-target positions resulted in the detection of 225 hydrogen RRLs, or just fewer than two velocity components per position. We give the derived off-target line parameters in Table Untangling the Recombination Line Emission from HII Regions with Multiple Velocity Components, which lists the Galactic longitude and latitude, the separation from the nearest multiple-velocity H II region, the line intensity, the LSR velocity, the line FWHM, and the rms noise. The final column gives the multiple-velocity H II region(s) that use this off-target position in our subsequent analyses. Line parameter uncertainties in Table Untangling the Recombination Line Emission from HII Regions with Multiple Velocity Components are .
3 Determining Discrete HII Region Velocities and Kinematic Distances
3.1 Discrete HII Region Velocity Criteria
Our goal is to use these observations to identify the velocity of the discrete H II regions. To do this we create a database of 474 X-band RRL line parameters from : 53 lines from the 28 on-target observations of literature H II regions (Table Untangling the Recombination Line Emission from HII Regions with Multiple Velocity Components), 225 lines from the 127 off-target positions (Table Untangling the Recombination Line Emission from HII Regions with Multiple Velocity Components), and 196 lines from the 89 multiple-velocity HRDS sources (Anderson et al., 2011). In order to determine which velocity components are from the discrete H II regions, we use pairs of on- and off-target spectra from this database to search for velocity components with substantially different intensities.
To search for lines that decrease in intensity at the off-target locations, we must associate on-target and off-target velocity components. Due to motions within the ISM, the fact that we are not sampling the same column of diffuse plasma, and measurement error, we cannot expect the line velocities of the on-target and off-target RRL parameters to be identical. We associate a velocity component from an on-target spectrum with a component from an off-target spectrum if their velocities are within 10 of each other. Sometimes there are two components in an off-target spectrum that are both within 10 of a single component in an on-target spectrum. In such cases, we associate both of these components with the single on-target component.
We examine six independent criteria to determine the discrete
H II region velocities:
-
1.
We check if only one line was detected in our on-target observations of the literature sources. As mentioned previously, this may be caused by incorrect line parameters in the literature or by different beam areas for the two sets of observations. For these sources the discrete H II region velocity is unambiguous.
-
2.
We identify HRDS sources that have a negative velocity for one component. For the longitude range of our sources, a negative RRL velocity requires the emitting plasma to be outside the Solar circle. Models of ionized gas in the Galaxy (e.g., Taylor & Cordes, 1993) show a very low density outside the Solar circle. Our observations probably lack the sensitivity to detect such low density ionized gas. Detected negative velocity RRLs in the first Galactic quadrant are therefore likely to be from discrete H II regions.
-
3.
We examine the difference in intensity between the on- and off-target observations for each associated velocity component. A large decrease in line intensity off-target for one component is a clear indication that this velocity is associated with the discrete H II region (explained in detail below).
-
4.
We use the derived electron temperatures for each RRL component to determine which on-target line results in an electron temperature within the range found in previous studies of Galactic H II regions (explained in detail below).
-
5.
We use the association of each on-target RRL component with molecular gas emission. These molecular data come from two sources: the spectroscopic and morphological analysis of H II regions in data from the Galactic Ring Survey Jackson et al. (2006) by Anderson et al. (2009), and the svelocities compiled in the WISE catalog of Galactic H II regions (Anderson et al., 2014, Version 1.3). Molecular gas is associated with massive star formation, but not with the WIM. If molecular gas is only associated with one of the velocity components, this is most likely the discrete H II region velocity.
-
6.
We examine whether a carbon RRL is associated with one of the RRL velocity components. Carbon RRLs are created in the PDRs of H II regions, and therefore the carbon RRLs should be strongest near the discrete H II region velocity. Observations of the WIM do contain carbon RRLs (e.g., Roshi et al., 2002), but to date these have only been detected at low frequencies ( GHz). We use the carbon RRL parameters for the HRDS sources from Wenger et al. (2013); this analysis is not possible for the literature sources because there is no comparable carbon RRL catalog.
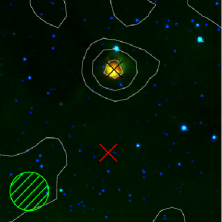
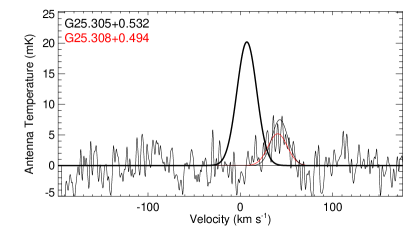
The RRL component intensity difference between the on- and off-target spectra (the third metric above) allows us to discriminate between the discrete and diffuse velocity components. In Figure 3 we show example spectra that have differences in line intensity between the on- and off-target positions. The magnitude of the intensity decrease between on- and off-target RRL spectra must be empirically set. The brightest diffuse emission detected in our observations is mK (see below). Therefore, any line that decreases in intensity by 50 mK between on- and off-target positions is likely to be from the discrete H II region. We find that our derminations of the discrete H II region velocity based on line intensity differences of 20 mK agree with those determined using other criteria. We therefore take decreases of 20 mK to be a reliable criterion, although we assume that it is less reliable than decreases of 50 mK. Lines that decrease by 10 mK, however, show considerably worse agreement with other criteria, and therefore we do not use 10 mK as an intensity difference criterion.
We naively would not expect to detect large decreases in the diffuse RRL intensity with small changes in position, and therefore the 50 mK criterion is rather conservative (which is why we included the 20 mK criterion as well). Our experiment does show, however, that for some sight lines multiple RRL component intensities decrease by up to 50 mK. This implies either that the diffuse ionized gas is quite clumpy, that a single discrete region is causing both lines, or that there are somehow two discrete H II regions that cannot be separated even in the high resolution MIR data. Regardless of the reason that both lines decrease significantly in intensity for some directions, the 50 mK criterion is justifiably conservative. The median line intensity in the HRDS was mK, and therefore the 20 mK criterion is also rather conservative.
Galactic H II regions have a rather narrow range of electron temperatures, , ranging from K to K (e.g., Quireza et al., 2006). The of a discrete H II region plasma should lie within this observed range. We thus can use the electron temperature (fourth metric above) to assess which on-target RRL component gives the most reasonable value, and thus determine the source velocity.
In local thermodynamic equilibrium (LTE), the electron temperature can be derived from observable quantities:
| (1) |
where is the observing frequency, is the peak continuum-to-line intensity ratio, is the Hn RRL line width, and is the helium ionic abundance ratio, . Each multiple-velocity H II region has a single value, but multiple and line width values, leading to a different for each RRL. This allows us to determine which lines produce values outside the nominal range. Following Balser et al., (2015, submitted), who used the same observational configuration, we use 8.9 GHz for , and assume (Quireza et al., 2006). We must assume a value for the helium ionic abundance ratio here because, for the integration times we used, 4He+ is too weak to measure for these sources. In fact, for the range of observed in Galactic H II regions the electron temperature does not depend strongly on this quantity (Balser et al., 2011).
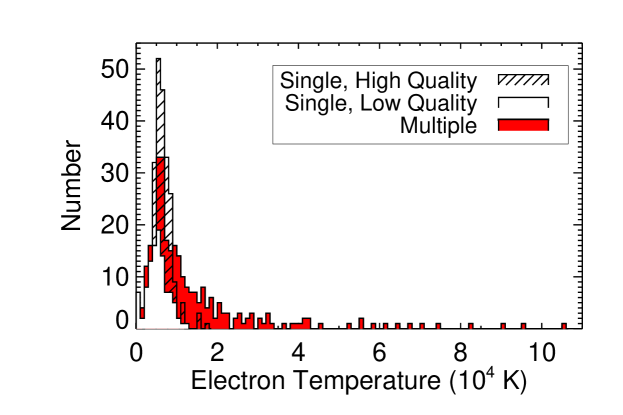
As for the line intensity metric, we must empirically determine a reasonable range of values. We define this range using the single-velocity H II region data from Anderson et al. (2011). We further divide the single-velocity population into “high quality” and “low quality” to investigate the effects of data quality on the derived values of . These high quality sources have a simple radio continuum profile (complex flag equal to zero in Anderson et al., 2011) and a continuum intensity of more than mK. We compare the single-velocity values with that of the multiple-velocity H II regions, computed using the on-target RRL parameters from the present work and the measurements of from Anderson et al. (2011).
We show in the top panel of Figure 4 the electron temperature distribution for all HRDS sources. The spread in electron temperature values for multiple-velocity H II regions is clearly greater than that of the single-velocity H II regions. We expect the derived electron temperature for the diffuse RRL components to be overestimated in general since and the diffuse line intensity is low. No single-velocity HRDS source has a value greater than K. The derived electron temperatures for multiple-velocity H II regions are on average over twice as large as those of the single-velocity H II regions. The averages for the high-quality single-velocity, low-quality single-velocity, and multiple-velocity samples are K, K, and K, respectively.
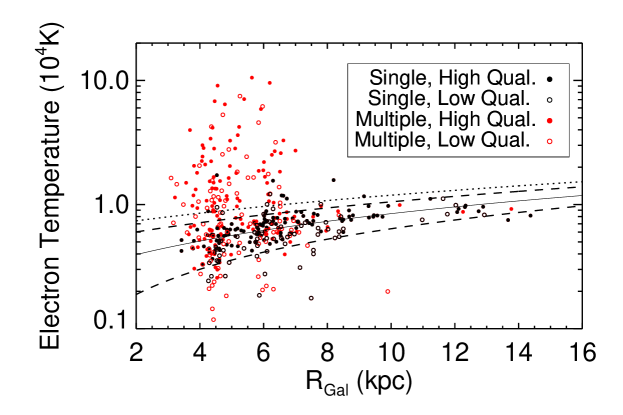
Because metals are the main coolants of the H II region plasma, the electron temperature gradient is a proxy for the metallicity radial gradient (Shaver et al., 1983). The electron temperature is the lowest toward the Galactic center, where the ISM has been enriched by multiple generations of stars (high metallicity), and is highest in the outer reaches of the Milky Way, where there have been fewer stellar generations (low metallicity). The electron temperature Galactocentric radial gradient is apparent in the bottom panel of Figure 4, which shows the electron temperature of HRDS sources within as a function of Galactocentric radius. The solid curve is a fit to the high-quality single-velocity H II regions (filled black points) of the form , where K and K kpc-1. It is important to note that this fit characterizes the sample well enough for our purposes, but is unreliable for the study of electron temperature gradients themselves because we have not accounted for the relatively poor data quality of some sources. A complete treatment of the electron temperature distribution of HRDS sources is given by Balser et al. (2015, submitted) and Wenger et al. (2015, in prep.).
We define two zones of acceptable values that contain at least 90% of all single-velocity H II regions: one zone for high-quality sources and one for low-quality. Within the area defined by changes to the y-intercept of (dashed curves in bottom panel of Figure 4; and K.) lie 91 % of all high-quality single-velocity sources. This area defines acceptable electron temperatures for high-quality sources. Within an area below a change to the y-intercept of (dotted curve; K) are 95 % of all low-quality single-velocity sources. This area defines acceptable electron temperatures for low-quality sources. We do not use a change of to the y-intercept to define the area. The large number of low-quality single-velocity H II regions with very low values (apparent in both panels of Figure 4) indicates that this would not lead to a reliable criterion. For multiple-velocity H II regions, lines that imply values within these acceptable zones are likely from discrete H II regions, while those outside of the zones are more likely to be from diffuse gas.
Using the above analyses, we refine the 6 metrics to develop the criteria used for the determination of the discrete H II region velocities: 1) only one on-target velocity component was detected (literature sources only); 2) one on-target velocity component has a negative LSR velocity; 3a) the intensity of one off-target line component is at least 50 mK less than that of the on-target position; 3b) the intensity of one off-target line component is between 20 mK and 50 mK less than that of the on-target position (the former being the more reliable criterion); 4a) the electron temperature derived from only one line component is within the reasonable range, for high quality sources; 4b) the electron temperature derived from only one line component is within the reasonable range, for low quality sources; 5a) Anderson et al. (2009) find CO emission matching the source morphology at only at one velocity (their quality factors of “A” or “B”); 5b) dense molecular gas, compiled in the WISE catalog of Galactic H II regions (Anderson et al., 2014), is only found at one velocity; 6) a carbon RRL is found at only one of the RRL velocities.
These criteria allow us to identify the discrete H II region velocity component for 103 of the 117 multiple-velocity H II regions (88 %). If two criteria give conflicting results, we do not assign any velocity; this applies to only 2 sources. For the sources for which we observed multiple off-target positions, we require that most positions give the same answer (i.e., both if there are two off-target position or two if there are three). We summarize the efficacy of our criteria in Table Untangling the Recombination Line Emission from HII Regions with Multiple Velocity Components, which lists the number of sources that the criterion applies to, and the percentage of all sources that this represents. Since multiple criteria can be used for a given source, the percentages do not add to 100%. Table Untangling the Recombination Line Emission from HII Regions with Multiple Velocity Components shows that the most useful criteria are from the off-target observations (54% of all sources), and the next most useful are from the electron temperature analysis (46% of all sources). We use multiple criteria for of all H II regions, and 58% of all determinations. Because we require that all criteria be in agreement in order to determine the source velocity, and because we have no objective measure of reliability, we cannot evaluate the accuracy of the individual criteria.
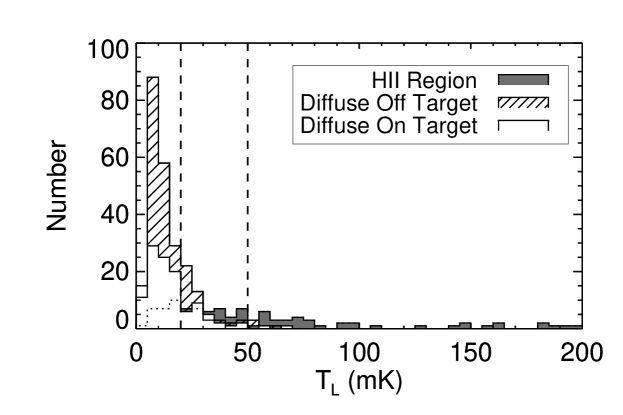
In Figure 5 we show that the discrete H II region RRL intensities are greater on average than those of the more diffuse gas. The average peak line intensity for the discrete H II regions is 59.7 mK (with a large dispersion), whereas it is 14.9 mK for the more diffuse gas. For 91 of the 103 regions (88%), the discrete H II region velocity is the brightest of the multiple lines detected. As expected, the distributions of on- and off-target diffuse line parameter intensities are similar. The vertical lines in Figure 5 show the intensity criteria of 20 mK and 50 mK. The fact that the diffuse line intensities are generally lower than these values lends some support to these choices of intensity criteria. More than 98% of the diffuse line intensities are less than 50 mK, and 80% are less than 20 mK.
3.2 Kinematic Distances
Using the derived H II region velocities we can compute kinematic distances using a Galactic rotation curve model. Here, we use the Brand & Blitz (1993) rotation curve. In the inner Galaxy there are two possible kinematic distances for each positive velocity, a problem known as the kinematic distance ambiguity (KDA). We make a kinematic distance ambiguity resolution (KDAR) using H I absorption, in the same manner as Anderson & Bania (2009) and Anderson et al. (2012). To resolve the KDA we examine H I on- and off-source spectra. The difference of these two spectra shows absorption of background 21 cm radio continuum emission from the H II region by foreground H I. If absorption only occurs up to the H II region velocity, the source must lie at the near distance. If absorption is detected between the H II region velocity and the tangent point velocity, the source must lie at the far distance. If a source velocity is within 10 of the tangent point velocity, we use the tangent point distance. As in previous work, the off-target spectrum was taken at a position as close to the source as possible so we can sample a similar column of hydrogen. We assign each KDAR a quality factor based on our qualitative assessment of our confidence in the KDAR: “A” is very certain, “B” is less certain, and “C” means we cannot resolve the KDAR. Of the 86 inner Galaxy H II regions for which we know the source velocity, and that do not lie at the tangent point, we derive a KDAR for 47 (). This percentage is lower than that of the HRDS (67% if tangent-point sources are excluded; Anderson et al., 2012).
We give the results of our analysis of the discrete H II regions in Table Untangling the Recombination Line Emission from HII Regions with Multiple Velocity Components, which lists the source LSR velocity, the near, far, and tangent point kinematic distances, the KDAR, the quality factor for the KDAR, the Galactocentric radius, the heliocentric distance, the height above the plane, and the criteria used to determine the H II region velocity.
4 Summary
We identify the discrete H II region velocity for 103 () H II regions whose radio recombination line (RRL) spectra show multiple velocity components. We do this by using new Green Bank Telescope (GBT) observations, analyzing the derived electron temperature for each velocity component, and searching for the molecular emission or carbon recombination lines associated with one RRL component.
Our sample contains all multiple-velocity H II regions in the zone . The multiple-velocity regions are concentrated in the zone , spatially coincident with some of the largest regions of massive star formation in the Milky Way. This suggests that the additional velocity components along these sight lines may be due to leaked photons from large massive star formation complexes. We thus interpret these additional components as stemming from diffuse gas ionized by photons from these energetic regions.
Prior to our analyses, it was not possible to derive distances to these regions, or to derive their physical properties. We derive kinematic distances for 62 H II regions, 15 at the tangent point distance and 47 for which we resolved the kinematic distance ambiguity. This population of H II regions can now be used for large-scale Galactic studies involving H II regions, including studies of Galactic structure (Bania et al., 2015, in prep.), metallicity (Balser et al., 2015, submitted; Wenger et al., 2015, in prep.), and the star formation rate (Anderson et al., 2015, in prep.)
Finally, our analysis leads naturally to the creation of a large database of diffuse RRL line parameters. Unlike most previous low angular resolution radio investigations of the diffuse RRL emission in our Galaxy, these data sample only the diffuse RRL component, and are uncontaminated by discrete H II regions. We will investigate this rich database in a future paper.
Facility: Green Bank Telescope
References
- Alves et al. (2014) Alves, M. I. R., Calabretta, M., Davies, R. D., Dickinson, C., Staveley-Smith, L., Davis, R. J., Chen, T., & Barr, A. 2014, ArXiv e-prints
- Alves et al. (2012) Alves, M. I. R., Davies, R. D., Dickinson, C., Calabretta, M., Davis, R., & Staveley-Smith, L. 2012, MNRAS, 422, 2429
- Alves et al. (2010) Alves, M. I. R., Davies, R. D., Dickinson, C., Davis, R. J., Auld, R. R., Calabretta, M., & Staveley-Smith, L. 2010, MNRAS, 405, 1654
- Anderson & Bania (2009) Anderson, L. D., & Bania, T. M. 2009, ApJ, 690, 706
- Anderson et al. (2014) Anderson, L. D., Bania, T. M., Balser, D. S., Cunningham, V., Wenger, T. V., Johnstone, B. M., & Armentrout, W. P. 2014, ApJS, 212, 1
- Anderson et al. (2011) Anderson, L. D., Bania, T. M., Balser, D. S., & Rood, R. T. 2011, ApJS, 194, 32
- Anderson et al. (2012) —. 2012, ApJ, 754, 62
- Anderson et al. (2009) Anderson, L. D., Bania, T. M., Jackson, J. M., Clemens, D. P., Heyer, M., Simon, R., Shah, R. Y., & Rathborne, J. M. 2009, ApJS, 181, 255
- Anderson et al. (2015) Anderson, L. D., et al. 2015, ApJ, 800, 101
- Araya et al. (2002) Araya, E., Hofner, P., Churchwell, E., & Kurtz, S. 2002, ApJS, 138, 63
- Balser (2006) Balser, D. S. 2006, AJ, 132, 2326
- Balser et al. (2011) Balser, D. S., Rood, R. T., Bania, T. M., & Anderson, L. D. 2011, ApJ, 738, 27
- Bania et al. (2010) Bania, T. M., Anderson, L. D., Balser, D. S., & Rood, R. T. 2010, ApJ, 718, L106
- Brand & Blitz (1993) Brand, J., & Blitz, L. 1993, A&A, 275, 67
- Domgorgen & Mathis (1994) Domgorgen, H., & Mathis, J. S. 1994, ApJ, 428, 647
- Haffner et al. (2009) Haffner, L. M., et al. 2009, Reviews of Modern Physics, 81, 969
- Heiles et al. (1996) Heiles, C., Reach, W. T., & Koo, B.-C. 1996, ApJ, 466, 191
- Jackson et al. (2006) Jackson, J. M., et al. 2006, ApJS, 163, 145
- Lockman (1989) Lockman, F. J. 1989, ApJS, 71, 469
- Lockman et al. (1996) Lockman, F. J., Pisano, D. J., & Howard, G. J. 1996, ApJ, 472, 173
- Murray & Rahman (2010) Murray, N., & Rahman, M. 2010, ApJ, 709, 424
- Oey & Kennicutt (1997) Oey, M. S., & Kennicutt, Jr., R. C. 1997, MNRAS, 291, 827
- Quireza et al. (2006) Quireza, C., Rood, R. T., Bania, T. M., Balser, D. S., & Maciel, W. J. 2006, ApJ, 653, 1226
- Reynolds (1984) Reynolds, R. J. 1984, ApJ, 282, 191
- Roshi et al. (2002) Roshi, D. A., Kantharia, N. G., & Anantharamaiah, K. R. 2002, A&A, 391, 1097
- Roshi et al. (2012) Roshi, D. A., Plunkett, A., Rosero, V., & Vaddi, S. 2012, ApJ, 749, 49
- Sewilo et al. (2004) Sewilo, M., Watson, C., Araya, E., Churchwell, E., Hofner, P., & Kurtz, S. 2004, ApJS, 154, 553
- Shaver et al. (1983) Shaver, P. A., McGee, R. X., Newton, L. M., Danks, A. C., & Pottasch, S. R. 1983, MNRAS, 204, 53
- Stil et al. (2006) Stil, J. M., et al. 2006, AJ, 132, 1158
- Taylor & Cordes (1993) Taylor, J. H., & Cordes, J. M. 1993, ApJ, 411, 674
- Watson et al. (2003) Watson, C., Araya, E., Sewilo, M., Churchwell, E., Hofner, P., & Kurtz, S. 2003, ApJ, 587, 714
- Wenger et al. (2013) Wenger, T. V., Bania, T. M., Balser, D. S., & Anderson, L. D. 2013, ApJ, 764, 34
| Source | rms | ||||||||
|---|---|---|---|---|---|---|---|---|---|
| deg. | deg. | ||||||||
| G021.5580.112 | 21.558 | 0.112 | 24.9 | 0.3 | 115.1 | 0.2 | 23.0 | 0.5 | 2.2 |
| G023.200+0.000 | 23.200 | 0.000 | 13.4 | 0.4 | 89.5 | 0.5 | 33.0 | 1.5 | 2.3 |
| G023.909+0.066a | 23.909 | 0.066 | 49.0 | 0.3 | 38.4 | 0.1 | 24.5 | 0.3 | 2.2 |
| G023.909+0.066b | 23.909 | 0.066 | 33.0 | 0.6 | 107.9 | 0.2 | 26.6 | 0.5 | 2.2 |
| G024.3000.149a | 24.300 | 0.149 | 70.0 | 0.5 | 56.8 | 0.1 | 17.5 | 0.1 | 2.4 |
| G024.3000.149b | 24.300 | 0.149 | 30.1 | 0.5 | 95.0 | 0.1 | 19.1 | 0.3 | 2.4 |
| G024.4000.190a | 24.400 | 0.190 | 45.1 | 0.6 | 101.0 | 0.2 | 21.8 | 0.4 | 2.4 |
| G024.4000.190b | 24.400 | 0.190 | 11.9 | 0.6 | 54.7 | 0.7 | 27.9 | 1.7 | 2.4 |
| G024.5070.222a | 24.507 | 0.222 | 232.4 | 1.6 | 96.3 | 0.1 | 23.7 | 0.2 | 8.5 |
| G024.5070.222b | 24.507 | 0.222 | 25.3 | 1.8 | 42.2 | 0.6 | 17.2 | 1.4 | 8.5 |
| G024.6800.160a | 24.680 | 0.160 | 421.1 | 0.5 | 110.3 | 0.1 | 23.4 | 0.1 | 2.1 |
| G024.6800.160b | 24.680 | 0.160 | 44.9 | 0.6 | 43.6 | 0.1 | 13.1 | 0.2 | 2.1 |
| G024.7440.206a | 24.744 | 0.206 | 162.7 | 0.8 | 82.6 | 0.1 | 19.5 | 0.1 | 2.9 |
| G024.7440.206b | 24.744 | 0.206 | 24.6 | 1.0 | 44.0 | 0.3 | 13.5 | 0.6 | 2.9 |
| G024.7440.206c | 24.744 | 0.206 | 17.1 | 0.4 | 122.6 | 0.2 | 17.8 | 0.6 | 2.9 |
| G024.909+0.432a | 24.909 | 0.432 | 28.8 | 0.7 | 108.6 | 0.3 | 18.2 | 0.6 | 2.6 |
| G024.909+0.432b | 24.909 | 0.432 | 13.9 | 0.5 | 135.1 | 0.8 | 27.4 | 1.9 | 2.6 |
| G025.160+0.059a | 25.160 | 0.059 | 66.3 | 0.4 | 45.5 | 0.1 | 25.1 | 0.2 | 2.4 |
| G025.160+0.059b | 25.160 | 0.059 | 9.2 | 0.4 | 107.7 | 0.5 | 24.8 | 1.5 | 2.4 |
| G025.4600.210a | 25.460 | 0.210 | 56.6 | 0.4 | 117.3 | 0.1 | 30.5 | 0.2 | 2.2 |
| G025.4600.210b | 25.460 | 0.210 | 15.4 | 0.4 | 62.5 | 0.4 | 31.6 | 0.9 | 2.2 |
| G025.700+0.030a | 25.700 | 0.030 | 195.4 | 0.9 | 52.7 | 0.1 | 21.3 | 0.1 | 2.9 |
| G025.700+0.030b | 25.700 | 0.030 | 49.6 | 1.2 | 124.2 | 0.2 | 13.2 | 0.4 | 2.9 |
| G025.700+0.030c | 25.700 | 0.030 | 19.8 | 0.4 | 83.4 | 0.4 | 20.7 | 1.6 | 2.9 |
| G026.1000.071a | 26.100 | 0.071 | 77.2 | 0.6 | 30.7 | 0.1 | 27.4 | 0.3 | 2.3 |
| G026.1000.071b | 26.100 | 0.071 | 25.6 | 0.6 | 103.4 | 0.3 | 30.0 | 0.8 | 2.3 |
| G026.5990.019a | 26.599 | 0.019 | 33.3 | 0.5 | 19.4 | 0.2 | 25.7 | 0.4 | 2.1 |
| G026.5990.019b | 26.599 | 0.019 | 10.9 | 0.4 | 102.3 | 0.6 | 33.5 | 1.4 | 2.1 |
| G027.1890.079a | 27.189 | 0.079 | 20.0 | 0.3 | 27.8 | 0.2 | 22.8 | 0.5 | 1.9 |
| G027.1890.079b | 27.189 | 0.079 | 10.6 | 0.3 | 86.9 | 0.4 | 34.7 | 1.1 | 1.9 |
| G028.3030.388 | 28.303 | 0.388 | 148.7 | 0.5 | 76.9 | 0.1 | 21.2 | 0.1 | 2.9 |
| G028.609+0.021a | 28.609 | 0.021 | 161.2 | 0.6 | 96.6 | 0.1 | 20.5 | 0.1 | 3.3 |
| G028.609+0.021b | 28.609 | 0.021 | 10.0 | 0.6 | 40.3 | 0.5 | 15.4 | 1.1 | 3.3 |
| G029.9810.607 | 29.981 | 0.607 | 45.1 | 0.4 | 90.9 | 0.1 | 19.6 | 0.2 | 1.9 |
| G030.4700.040a | 30.470 | 0.040 | 62.9 | 0.7 | 42.7 | 0.1 | 22.1 | 0.3 | 2.6 |
| G030.4700.040b | 30.470 | 0.040 | 33.8 | 0.5 | 101.4 | 0.3 | 32.3 | 0.6 | 2.6 |
| G030.6980.628a | 30.698 | 0.628 | 19.0 | 0.4 | 87.8 | 0.3 | 16.5 | 0.9 | 2.0 |
| G030.6980.628b | 30.698 | 0.628 | 8.6 | 0.4 | 110.2 | 0.8 | 20.1 | 2.4 | 2.0 |
| G031.054+0.088a | 31.054 | 0.088 | 95.3 | 0.7 | 20.1 | 0.1 | 28.2 | 0.2 | 2.9 |
| G031.054+0.088b | 31.054 | 0.088 | 33.0 | 0.6 | 97.8 | 0.4 | 36.1 | 1.0 | 2.9 |
| G031.070+0.050a | 31.070 | 0.050 | 109.5 | 0.6 | 35.4 | 0.1 | 29.0 | 0.2 | 2.9 |
| G031.070+0.050b | 31.070 | 0.050 | 39.8 | 0.5 | 98.6 | 0.2 | 34.6 | 0.5 | 2.9 |
| G031.2400.110a | 31.240 | 0.110 | 155.6 | 0.9 | 26.5 | 0.1 | 29.5 | 0.2 | 3.0 |
| G031.2400.110b | 31.240 | 0.110 | 18.1 | 0.5 | 90.3 | 0.5 | 29.5 | 1.5 | 3.0 |
| G031.6000.232a | 31.600 | 0.232 | 35.6 | 0.4 | 40.8 | 0.1 | 19.6 | 0.3 | 2.5 |
| G031.6000.232b | 31.600 | 0.232 | 12.6 | 0.4 | 100.9 | 0.3 | 20.0 | 0.7 | 2.5 |
| G031.607+0.334a | 31.607 | 0.334 | 44.9 | 0.4 | 24.4 | 0.1 | 24.3 | 0.2 | 2.6 |
| G031.607+0.334b | 31.607 | 0.334 | 6.1 | 0.4 | 96.4 | 0.9 | 28.8 | 2.2 | 2.6 |
| G031.8160.121a | 31.816 | 0.121 | 38.8 | 0.5 | 36.3 | 0.1 | 20.8 | 0.3 | 2.6 |
| G031.8160.121b | 31.816 | 0.121 | 11.6 | 0.5 | 104.3 | 0.4 | 21.6 | 1.1 | 2.6 |
| G032.379+0.102 | 32.379 | 0.102 | 15.2 | 0.3 | 47.3 | 0.3 | 25.8 | 0.7 | 1.9 |
| G034.750+0.020a | 34.750 | 0.020 | 36.0 | 0.5 | 86.1 | 0.1 | 20.2 | 0.3 | 2.7 |
| G034.750+0.020b | 34.750 | 0.020 | 25.4 | 0.5 | 52.0 | 0.2 | 21.0 | 0.5 | 2.7 |
& 4 Single velocity on-target 2 5 4 One component negative velocity 3a 31 26 50mK decrease 3b 33 28 20mK decrease 4a 37 32 High-quality 4b 17 14 Low-quality 5a 9 8 CO morphology 5b 33 28 Other molecular lines 6 6 5 Carbon RRL 1 Criterion 47 40 2 Criteria 39 33 Criteria 17 15 Total Resolved 103 88