Why Haven’t Many of the Brightest Radio Loud Blazars Been Detected in Gamma-Rays by Fermi ?
Abstract
We use the complete MOJAVE 1.5 Jy sample of active galactic nuclei (AGN) to examine the gamma-ray detection statistics of the brightest radio-loud blazars in the northern sky. We find that 23% of these AGN were not detected above 0.1 GeV by the Fermi LAT during the 4-year 3FGL catalog period partly because of an instrumental selection effect, and partly due to their lower Doppler boosting factors. Blazars with synchrotron peaks in their spectral energy distributions located below Hz also tend to have high-energy peaks that lie below the 0.1 GeV threshold of the LAT, and are thus less likely to be detected by Fermi. The non-detected AGN in the 1.5 Jy sample also have significantly lower 15 GHz radio modulation indices and apparent jet speeds, indicating that they have lower than average Doppler factors. Since the effective amount of relativistic Doppler boosting is enhanced in gamma-rays (particularly in the case of external inverse-Compton scattering), this makes them less likely to appear in the 3FGL catalog. Based on their observed properties, we have identified several bright radio-selected blazars that are strong candidates for future detection by Fermi.
Subject headings:
galaxies: active — galaxies: jets — quasars: general — radio continuum: galaxies — gamma rays: galaxies
1. INTRODUCTION
The Fermi space telescope is a powerful broad-band gamma-ray facility that has continuously scanned the entire sky every 3 hours since 2008. One of its major discoveries has been that away from the galactic plane, the gamma-ray sky is dominated by the blazar class of active galactic nuclei (AGN) (Abdo et al., 2010a). These relatively rare AGN harbor powerful jets of relativistically-moving plasma that are oriented close to our line of sight. Their overall spectral energy distribution (SED) tends to be dominated by relativistically boosted emission from the jet, and typically consists of two broad peaks in a plot of log versus log , where is the observed flux density at frequency (Abdo et al., 2010e). The lower frequency peak is associated with synchrotron emission from relativistic electrons in the jet plasma, while the high frequency peak is widely believed to be created by inverse-Compton (IC) up-scattering of photons from the jet, accretion disk and/or broad line region (e.g., Dermer & Schlickeiser, 1993; Sikora et al., 1994).
Since the same population of jet electrons is responsible for these two peaks, we might expect the synchrotron and gamma-ray emission from individual blazars to be correlated, and this has proven to be the case. Many studies have found statistical correlations between the radio/sub-mm band and the GeV time-averaged fluxes measured by the Fermi LAT instrument (e.g., Kovalev et al., 2009; Ackermann et al., 2011; Lister et al., 2011; Giommi et al., 2012; Fuhrmann et al., 2014; Mufakharov et al., 2015). Mahony et al. (2010) have also shown that the fraction of radio-loud AGN detected by Fermi steadily increases with increasing 20 GHz flux density.
Despite these well-established correlations, it is still not fully understood why a substantial fraction of the brightest, most compact blazars in the GHz band have not been detected at energies above 0.1 GeV, despite the four years of continuous observations included in the most recent Fermi catalog (3FGL; Acero et al., 2015). In this Letter, we investigate the properties of a complete flux density-limited, 15 GHz AGN sample of the northern sky, the MOJAVE 1.5 Jy survey, where 23% of the AGN have no Fermi detections. We show that these non-detected AGN have a lower than average jet speed and radio variability index (indicative of a lower Doppler boosting factor) and a synchrotron component that peaks below Hz. The latter causes their secondary SED peak to be located well below the lower energy cutoff of the LAT instrument, resulting in a low LAT gamma-ray flux and non-detection by Fermi. We discuss the 1.5 Jy sample and observational data in § 2, present our analysis in § 3, and summarize our conclusions in § 4.
2. OBSERVATIONAL DATA
In order to properly evaluate the statistics of gamma-ray detections of bright radio loud blazars, it is essential to use well-defined, complete samples. The GeV and radio bands above GHz are ideal in this respect due to the lack of foreground obscuration (away from the galactic plane), and little contamination from non-active galaxies. In these bands, the AGN emission is dominated by that of the jet, with little contribution from the extended lobes. In this section we describe the radio-selected MOJAVE 1.5 Jy AGN sample, and the supporting data from our own studies and the literature.
2.1. Radio data
In the GHz band, there have been many large sky surveys carried out over the last few decades, e.g., FIRST (Becker et al., 1995), NVSS (Condon et al., 1998), GB6 (Gregory et al., 1996), AT20G (Murphy et al., 2010), such that virtually every radio loud AGN above 1 Jy has been identified and cataloged. Nevertheless, a major challenge in obtaining complete samples of radio loud blazars has been their highly variable flux densities, which over the course of several years can change by factors exceeding in the GHz band (Richards et al., 2014), and in the GeV band (Abdo et al., 2010c; Fuhrmann et al., 2014). Any single epoch flux-limited survey therefore stands to miss a substantial portion of the population.
As part of a VLBA key project to study the parsec-scale structure and evolution of AGN jets (Lister et al., 2009b), we have constructed a complete, flux density-limited sample, based on all available GHz band flux density data on bright radio AGNs over a 16 year period from 1994.0 to 2010.0 (Lister et al., 2013). The MOJAVE 1.5 Jy sample includes all AGN (excluding gravitational lenses) located north of J2000 declination that are known to have exceeded 1.5 Jy in compact (milliarcsecond-scale) 15 GHz flux density at least once during that period. We were able to estimate the milliarcsecond-scale flux density from single-dish measurements by using near-simultaneous VLBA/single-dish observations of each source at several epochs. The difference of these near-simultaneous measurements represents the amount of arcsecond-scale emission resolved out by the VLBA, which is expected to be non-variable due to its size. Given the measurement errors, we were able to detect any extended emission above 0.02 Jy.
Using newly obtained data from the OVRO 15 GHz AGN monitoring program (Richards et al., 2011), we have refined our extended flux density estimates and subsequently dropped two AGN (MG1 J0211141051 and OP 050) from the original 1.5 Jy sample list. We list the properties of all 181 AGN in the revised sample in Table 1. For the purposes of this paper, we consider only the 163 AGN that are located at least 10 degrees away from the galactic plane. This ensures that issues related to galactic gamma-ray foreground subtraction do not affect the LAT detection statistics of our sample.
2.2. Gamma-ray data
The Third Fermi Gamma-Ray Catalog (3FGL; Acero et al., 2015) is based on LAT data collected between 2008 August 4 and 2012 July 31, and contains 3033 high-confidence detections above 0.1 GeV. The Third LAT AGN Catalog (3LAC; Ackermann et al., 2015), associates 1563 of these sources with AGN. Because of the relatively large sky position errors ( several arcmin) of the 3FGL sources, true counterpart identification has only been achieved in of the cases. The remainder of the 3FGL associations were established using extensive statistical likelihood tests and a variety of celestial source catalogs. The 3LAC list consists of only high-confidence 3FGL AGN associations. For brevity, we will refer to these AGN as “LAT-detected” throughout this paper. Although a large number (992) of 3FGL gamma-ray sources remain unassociated, virtually all of the brightest ones have associations (see, e.g., Acero et al., 2015; Lister et al., 2011).
A total of 122 AGN in our sample are listed as associations in the 3LAC. Additionally, PKS 0539057 and 4C 06.69 appeared in the 1FGL catalog (Abdo et al., 2010a), and the LAT detection of 3C 120 was announced by Abdo et al. (2010b). The latter three AGN likely do not appear in the 3FGL catalog since they experienced at most only a brief period of gamma-ray flaring; thus their 4 year averaged fluxes were below the 3FGL significance cutoff. We checked the remaining non-LAT detected AGN in our sample, and in all cases the closest 3FGL source was at least 17 arcminutes away. There are also no Fermi associations for any of these AGN in the refined list published by Massaro et al. (2015).
2.3. SED peak data
As discussed previously by Finke (2013) there are considerable inconsistencies in the SED synchrotron peak locations of blazars reported in the literature. Since the peaks for most of our sample lie between and Hz, where there is typically a paucity of observational data, considerable interpolation-based errors are present. Since our AGN are highly core-dominated, any contribution from extended lobe emission to the SED is negligible above Hz, however, some authors have included the (non-jet) IR and optical big blue bump components in their polynomial fits to the synchrotron SED component, resulting in overestimates of the true peak location.
In order to minimize these errors, we have used the ASDC SED builder Version 3.1.6 tool111https://tools.asdc.asi.it/ to estimate the peak location using a 3rd degree polynomial fit to flux densities published in the literature. For most of the AGN in our sample there were hundreds of available measurements at numerous frequencies, however, we only considered data up to Hz, and extended this up to Hz only for clear cases where the SED remained parabolic and there was no significant blue bump component. In some instances, there were insufficient flux density data or too much confusion from non-jet emission in the to Hz region to reliably estimate the location of the synchrotron peak. Based on comparisons to other published values in the literature for our AGN, we estimate a typical error of dex in our values.
3. DISCUSSION
3.1. Fermi detection and synchrotron peak location
The passband of the LAT instrument covers photon energies in the approximate range of 100 MeV to 300 GeV (Atwood et al., 2009). At the highest energies, AGN detections are typically limited by low photon fluxes, since they typically have steep gamma-ray spectra with power law energy indices ranging from 1.5 to 3 (Acero et al., 2015). The LAT’s fixed passband tends to discriminate against AGN with IC peaks located below 1 GeV, and those with very steep gamma-ray spectra. If the IC peak shapes of blazars are similar, then the LAT’s fixed passband should create a correlation between the LAT energy index and the IC peak location. Unfortunately the latter are often difficult to measure, due to a lack of observational data in the soft gamma-ray and hard X-ray bands. However, we would also expect the locations of the synchrotron and IC peaks to be correlated, since the same population of jet electrons is responsible for both features. This has been shown to be the case, in the form of a relatively tight correlation between LAT energy index and synchrotron peak location (Abdo et al., 2010d). Therefore, since the two SED peaks track each other, AGN with low synchrotron peak locations should have IC peaks located well below the LAT bandpass, and consequently a smaller chance of detection by Fermi.
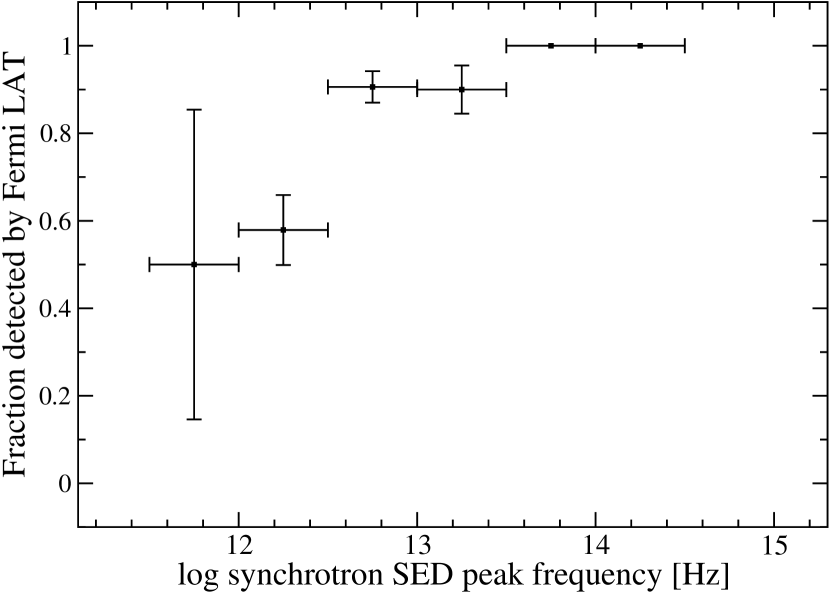
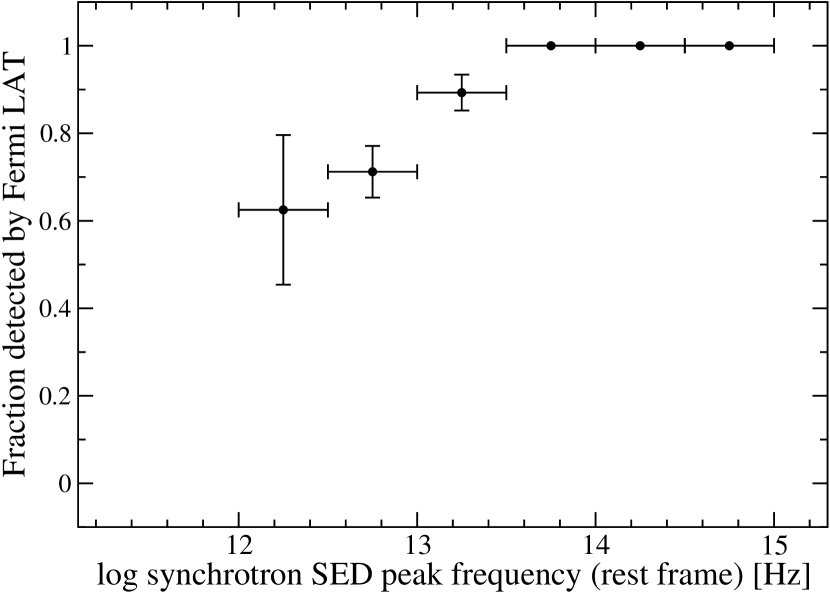
In Figure 1 we show histograms of synchrotron peak frequency for the LAT and non-LAT detected sub-samples. All of the non-detected AGN have synchrotron peak frequencies below Hz (in both rest and observer frames). We performed two commonly-used non-parametric statistical tests to look for differences in the distributions. The Kolmogorov-Smirnov test evaluates possible differences in the cumulative distribution functions, while the Wilcoxon rank-sum test evaluates whether the data points of one sample are generally higher-valued (or lower-valued) than the other. We list the test results in Table 2. The LAT and non-LAT AGN have significantly different synchrotron peak distributions, both in the observed and rest frames. Figure 2 shows that as predicted, the AGN in our sample with higher synchrotron peak frequencies are more likely to be detected by Fermi.

3.2. Fermi detection and Doppler boosting Indicators
A main prediction of the external seed photon model for high-energy blazar emission is that the IC radiation should be more highly Doppler boosted than the synchrotron emission, due to a blue-shifting of the external photons in the rest frame of the jet electrons (Dermer, 1995). The gamma-rays will also experience more effective boosting (via a -correction) since their emission spectrum is much steeper than that of the flat-spectrum radio jet. There is already ample evidence that Fermi preferentially detects highly Doppler boosted jets; the very small number of misaligned (low Doppler factor) jets in the 3LAC (only 2% of the catalog) is a prime example. Other studies showing this Fermi selection bias include those by Kovalev et al. (2009), Abdo et al. (2010d), and Savolainen et al. (2010).
The Doppler factors of AGN jets are difficult to measure accurately, due to the featureless power-law nature of the jet emission, and a lack of a good means with which to estimate the jet viewing angle. Some studies (e.g., Lähteenmäki & Valtaoja, 1999; Jorstad et al., 2005; Hovatta et al., 2009) have used light-crossing time arguments and variability timescales of individual flares to derive Doppler factors, but only for a relatively small number of AGN. However, the overall variability level of a blazar is also a good indicator of its Doppler factor, since any intrinsic variability will be significantly shortened and increased in amplitude by Doppler boosting (e.g., Lister, 2001). The OVRO monitoring program has published 15 GHz modulation indices for nearly 1500 blazars, covering the time period 2008 January 1 to 2011 December 31. These indices are estimates of the standard deviation of the flux density of a source divided by its mean (Richards et al., 2011).
The gamma-ray detected AGN in the OVRO sample are significantly more radio variable than the non-detected ones (Richards et al., 2014), and we find this same trend for the 142 OVRO AGN in our sample. Richards et al. (2014) also found the level of AGN radio variability to decrease with increasing synchrotron peak frequency, but their sample includes significant numbers of AGN with observed synchrotron peaks above Hz, whereas there are only 4 such AGN in our sample.
Another method of estimating the amount of relativistic boosting comes from measurements of apparent jet speeds. Although it is possible for a jet to have a low apparent speed if it is aligned exceedingly close to the line of sight (i.e., a viewing angle , where is the bulk Lorentz factor), for large flux-limited jet samples the apparent speed will on average be well-correlated with Lorentz factor (Lister et al., 2001). The MOJAVE program has published maximum apparent jet speeds for 133 AGNs in our sample (Lister et al., 2013), and is currently obtaining multi-epoch VLBA data on the remainder.
In an earlier study using the first three months of Fermi data, we showed that the gamma-ray detected AGN in the original MOJAVE sample had higher apparent jet speeds (Lister et al., 2009a). This is also the case for our 1.5 Jy sample, at an even higher level of statistical confidence (Table 2). Taken together with the trend in modulation index, this indicates that the Doppler factor also plays an important role in determining which radio-loud blazars will be detected by Fermi.
3.3. Fermi detection and other jet properties
In addition to Doppler factor and synchrotron peak location, there are potentially other properties that can also influence the gamma-ray flux of a blazar. These include redshift, intrinsic jet luminosity, and the activity state of the jet during the 3FGL observation period. The latter is particularly important when considering the Fermi detection statistics of the 1.5 Jy sample, which was selected over a time period that only partially overlaps that of the 3FGL catalog.
We have compiled maximum and median 15 GHz VLBA flux densities of the 1.5 Jy AGN during two time periods: a) between the start of the 1.5 Jy sample selection window (1994 January 1) and the start of Fermi operations (2008 August 4), and b) during the 3FGL observation window. We use the ratio of the maximum flux density in these two periods as a Fermi-era radio activity indicator, as was done by Kovalev et al. (2009) in their analysis of the Fermi LBAS list (Abdo et al., 2009). There were 51 AGN with insufficiently sampled flux density data in the pre-Fermi era to determine a reliable activity index.
The OVRO program does not include any AGN below declination , and ten other 1.5 Jy sample AGN were only added to its monitoring list after the end of the 3FGL period. In all of these cases we had at least 4 epochs of VLBA222http://www.astro.purdue.edu/MOJAVE or UMRAO 14.5 GHz (Aller et al., 2014) observations during the 3FGL period with which to calculate maximum and median values.
We find no statistically significant differences in the activity indices of the LAT and non-LAT sub-samples. This is also the case for the median radio flux density during the 3FGL time period. There is a mild indication that the maximum radio flux densities of the LAT-detected AGN are higher on average than the non-detected ones. This is likely because the majority of the LAT detected AGN are highly variable in gamma-rays, and were detectable by Fermi only during a small fraction of the 3FGL time window (Acero et al., 2015).
There is no significant dependence of AGN LAT detection on redshift, maximum 3FGL-era radio luminosity, or median 3FGL-era radio luminosity. Our sample, being selected on radio jet emission, is dominated by high-luminosity, high-redshift jets, and contains only 11 AGN located closer than redshift 0.1. Consequently, it does not uniformly sample a wide range of jet luminosity, and is not ideally suited for probing the gamma-ray detection statistics of lower luminosity AGN.
4. Summary and Conclusions
We have examined the Fermi LAT detection statistics during the time period covered by the 3FGL catalog (2008 August 4 to 2012 July 31) of the MOJAVE 1.5 Jy complete flux density-limited sample of radio-loud blazars with J2000 declination and . We conclude that 23% of these AGN were not detected above 0.1 GeV by the Fermi LAT in part due to an instrumental selection effect, and partly due to lower relativistic boosting of their jet emission.
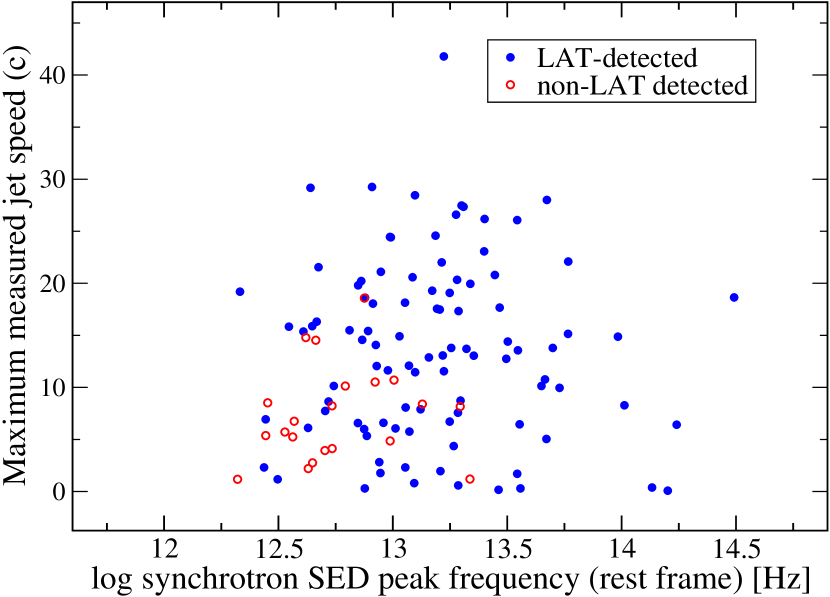
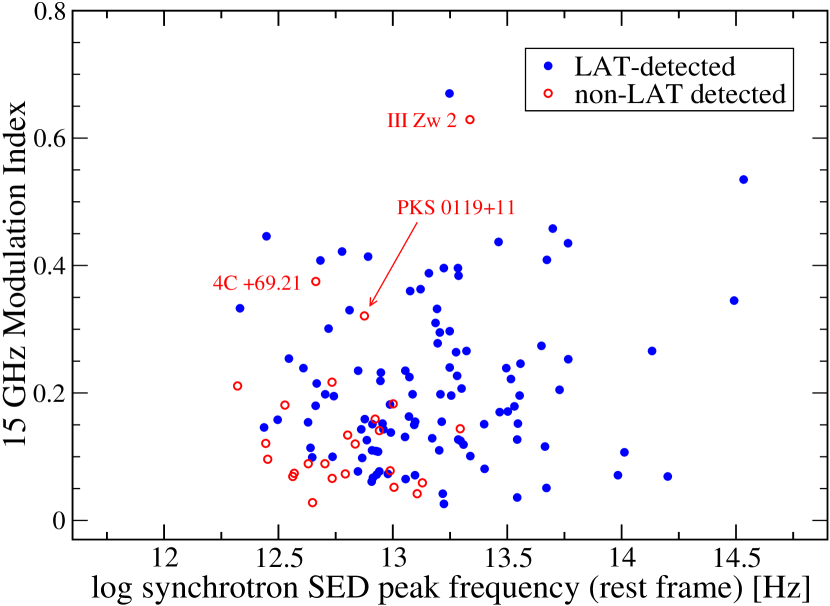
The LAT-detected blazars have significantly higher radio variability levels and apparent jet speeds than the non-detected ones. Both of these properties are positively correlated with the Doppler boosting factor of the radio emission. Since the effective amount of relativistic flux boosting is enhanced in gamma-rays (especially in the case of the external IC model), radio-selected blazars with lower than average Doppler factors are less likely to be detected by Fermi. In Figure 3, we plot apparent jet speed and modulation index, respectively, versus the rest frame synchrotron peak frequency. In both scatterplots there is a clear tendency for the non-LAT detected AGN to cluster in the lower left corner. In Figure 3 we have identified three AGN (III Zw 2, PKS 011911, and 4C 69.21), which based on their locations in the plots, are likely candidates for future LAT detection. The LAT’s selection effects are clearly evident in the differences in the SED synchrotron peak locations of the detected and non-detected blazars in our sample. Bright radio loud blazars with synchrotron peaks in their SEDs located below Hz have high-energy peaks that lie well below the lower energy cutoff of the LAT, resulting in a low gamma-ray flux. Future space telescopes such as Astro-H which cover the hard X-ray/soft gamma-ray regime below 100 MeV therefore offer great potential for detecting these blazars.
References
- Abdo et al. (2009) Abdo, A. A., et al. 2009, ApJS, 183, 46
- Abdo et al. (2010a) —. 2010a, ApJS, 188, 405
- Abdo et al. (2010b) —. 2010b, ApJ, 720, 912
- Abdo et al. (2010c) —. 2010c, ApJ, 722, 520
- Abdo et al. (2010d) —. 2010d, ApJ, 715, 429
- Abdo et al. (2010e) —. 2010e, ApJ, 716, 30
- Acero et al. (2015) Acero, F., et al. 2015, ApJS, 218, 23
- Ackermann et al. (2011) Ackermann, M., et al. 2011, ApJ, 741, 30
- Ackermann et al. (2015) —. 2015, ArXiv e-prints, 1501.06054
- Aller et al. (2014) Aller, M. F., Hughes, P. A., Aller, H. D., Latimer, G. E., & Hovatta, T. 2014, ApJ, 791, 53
- Atwood et al. (2009) Atwood, W. B., et al. 2009, ApJ, 697, 1071
- Becker et al. (1995) Becker, R. H., White, R. L., & Helfand, D. J. 1995, ApJ, 450, 559
- Carpenter et al. (2014) Carpenter, B., Ojha, R., D’Ammando, F., Orienti, M., & Cheung, C. C. 2014, The Astronomer’s Telegram, 5838, 1
- Condon et al. (1998) Condon, J. J., Cotton, W. D., Greisen, E. W., Yin, Q. F., Perley, R. A., Taylor, G. B., & Broderick, J. J. 1998, AJ, 115, 1693
- Deller et al. (2011) Deller, A. T., et al. 2011, PASP, 123, 275
- Dermer (1995) Dermer, C. D. 1995, ApJ, 446, L63
- Dermer & Schlickeiser (1993) Dermer, C. D., & Schlickeiser, R. 1993, ApJ, 416, 458
- Finke (2013) Finke, J. D. 2013, ApJ, 763, 134
- Fuhrmann et al. (2014) Fuhrmann, L., et al. 2014, MNRAS, 441, 1899
- Giommi et al. (2012) Giommi, P., et al. 2012, A&A, 541, A160
- Gregory et al. (1996) Gregory, P. C., Scott, W. K., Douglas, K., & Condon, J. J. 1996, ApJS, 103, 427
- Hovatta et al. (2009) Hovatta, T., Valtaoja, E., Tornikoski, M., & Lähteenmäki, A. 2009, A&A, 498, 723
- Jorstad et al. (2005) Jorstad, S. G., et al. 2005, AJ, 130, 1418
- Kovalev et al. (2009) Kovalev, Y. Y., et al. 2009, ApJ, 696, L17
- Lähteenmäki & Valtaoja (1999) Lähteenmäki, A., & Valtaoja, E. 1999, ApJ, 521, 493
- Lister (2001) Lister, M. L. 2001, ApJ, 561, 676
- Lister et al. (2009a) Lister, M. L., Homan, D. C., Kadler, M., Kellermann, K. I., Kovalev, Y. Y., Ros, E., Savolainen, T., & Zensus, J. A. 2009a, ApJ, 696, L22
- Lister et al. (2001) Lister, M. L., Tingay, S. J., & Preston, R. A. 2001, ApJ, 554, 964
- Lister et al. (2009b) Lister, M. L., et al. 2009b, AJ, 137, 3718
- Lister et al. (2011) —. 2011, ApJ, 742, 27
- Lister et al. (2013) —. 2013, AJ, 146, 120
- Mahony et al. (2010) Mahony, E. K., Sadler, E. M., Murphy, T., Ekers, R. D., Edwards, P. G., & Massardi, M. 2010, ApJ, 718, 587
- Massaro et al. (2015) Massaro, F., et al. 2015, ApJS, 217, 2
- Mufakharov et al. (2015) Mufakharov, T., Mingaliev, M., Sotnikova, Y., Naiden, Y., & Erkenov, A. 2015, MNRAS, 450, 2658
- Murphy et al. (2010) Murphy, T., et al. 2010, MNRAS, 402, 2403
- Richards et al. (2014) Richards, J. L., Hovatta, T., Max-Moerbeck, W., Pavlidou, V., Pearson, T. J., & Readhead, A. C. S. 2014, MNRAS, 438, 3058
- Richards et al. (2011) Richards, J. L., et al. 2011, ApJS, 194, 29
- Savolainen et al. (2010) Savolainen, T., Homan, D. C., Hovatta, T., Kadler, M., Kovalev, Y. Y., Lister, M. L., Ros, E., & Zensus, J. A. 2010, A&A, 512, A24
- Sikora et al. (1994) Sikora, M., Begelman, M. C., & Rees, M. J. 1994, ApJ, 421, 153
| J2000 | Alias | Fermi Catalog Name | z | ||||||
|---|---|---|---|---|---|---|---|---|---|
| (1) | (2) | (3) | (4) | (5) | (6) | (7) | (8) | (9) | (10) |
| J00060623 | NRAO 005 | 0.3467 | 0.08 | 2.69 | 2.09 | 0.78 | 13.0 | 13.1 | |
| J0010+1058 | III Zw 2 | 0.0893 | 1.82 | 0.72 | 0.81 | 13.3 | 13.3 | ||
| J0019+7327 | S5 0016+73 | 1.781 | 1.48 | 1.10 | 0.66 | 12.3 | 12.7 | ||
| J00500929 | PKS 004809 | 3FGL J0050.60929 | 0.635 | 0.04 | 2.33 | 0.82 | 1.10 | 14.3 | 14.5 |
| J0102+5824aa Low galactic latitude () | TXS 0059+581 | 3FGL J0102.8+5825 | 0.644 | 5.41 | 2.49 | 1.21 | 12.7 | 12.9 | |
| J0108+0135 | 4C +01.02 | 3FGL J0108.7+0134 | 2.099 | 0.14 | 4.27 | 3.38 | 1.28 | 12.5 | 13.0 |
| J0112+2244 | S2 0109+22 | 3FGL J0112.1+2245 | 0.265 | 1.36 | 0.37 | 0.90 | 13.4 | 13.5 | |
| J0112+3522 | B2 0109+35 | 0.450 | 1.37 | 0.99 | 0.89 | 12.8 | 13.0 | ||
| J0121+1149 | PKS 0119+11 | 0.570 | 0.05 | 4.36 | 2.10 | 1.07 | 12.7 | 12.9 | |
| J01250005 | UM 321 | 1.0765 | 0.07 | 1.07 | 0.89 | 0.66 | |||
| J01321654 | OC 150 | 3FGL J0132.61655 | 1.020 | 2.91 | 2.11 | 2.82 | 12.9 | 13.2 | |
| J0136+4751 | DA 55 | 3FGL J0137.0+4752 | 0.859 | 4.90 | 3.31 | 0.86 | 12.3 | 12.6 | |
| J0204+1514 | 4C +15.05 | 3FGL J0205.0+1510 | 0.405 | 0.24 | 1.26 | 0.82 | 0.42 | 12.5 | 12.6 |
| J0205+3212 | B2 0202+31 | 3FGL J0204.8+3212 | 1.466 | 3.51 | 2.53 | 1.05 | 12.3 | 12.7 | |
| J02041701 | PKS 020217 | 3FGL J0205.21700 | 1.739 | 0.12 | 1.46 | 1.31 | 1.03 | 12.5 | 12.9 |
| J0217+7349 | S5 0212+73 | 3FGL J0217.5+7349 | 2.367 | 0.04 | 3.96 | 3.23 | 0.98 | 12.3 | 12.8 |
| J0217+0144 | OD 026 | 3FGL J0217.8+0143 | 1.715 | 2.36 | 1.64 | 0.62 | 13.1 | 13.5 | |
| J0228+6721aa Low galactic latitude () | 4C +67.05 | 0.523 | 0.02 | 1.37 | 0.88 | 0.57 | 12.8 | 13.0 | |
| J0231+1322 | 4C +13.14 | 2.059 | 0.07 | 2.06 | 1.68 | 1.37 | 12.3 | 12.8 | |
| J0237+2848 | 4C +28.07 | 3FGL J0237.9+2848 | 1.206 | 4.27 | 2.65 | 0.82 | 12.9 | 13.2 | |
| J0238+1636 | AO 0235+164 | 3FGL J0238.6+1636 | 0.940 | 6.73 | 1.24 | 1.36 | 13.0 | 13.2 | |
| J02410815 | NGC 1052 | 0.005037 | 0.10 | 1.63 | 1.11 | 0.66 | |||
| J0244+6228aa Low galactic latitude () | TXS 0241+622 | 0.045 | 2.33 | 1.69 | 1.35 | 13.4 | 13.5 | ||
| J0303+4716aa Low galactic latitude () | 4C +47.08 | 3FGL J0303.6+4716 | 0.05 | 2.44 | 1.91 | 1.42 | 13.4 | ||
| J0319+4130 | 3C 84 | 3FGL J0319.8+4130 | 0.0176 | 1.38 | 29.80 | 19.83 | 1.09 | 12.9 | 12.9 |
| J0336+3218 | NRAO 140 | 3FGL J0336.5+3210 | 1.259 | 3.12 | 2.51 | 1.12 | 13.0 | 13.4 | |
| J03390146 | CTA 26 | 3FGL J0339.50146 | 0.852 | 3.85 | 2.53 | 1.12 | 12.7 | 13.0 | |
| J0359+5057aa Low galactic latitude () | NRAO 150 | bbFermi LAT detection reported by Carpenter et al. (2014) | 1.520 | 0.13 | 16.05 | 11.73 | 1.22 | 12.4 | 12.8 |
| J0403+2600 | CTD 026 | 2.109 | 2.16 | 1.90 | 1.37 | 12.3 | 12.8 | ||
| J04051308 | PKS 040313 | 3FGL J0405.51307 | 0.571 | 0.76 | 1.13 | 0.87 | 0.60 | 13.2 | 13.4 |
| J0418+3801aa Low galactic latitude () | 3C 111 | 3FGL J0418.5+3813c | 0.0491 | 0.90 | 6.16 | 3.13 | 0.89 | 13.3 | 13.3 |
| J04230120 | PKS 042001 | 3FGL J0423.20119 | 0.9161 | 8.65 | 5.32 | 0.63 | 12.8 | 13.1 | |
| J0424+0036 | PKS 0422+00 | 3FGL J0424.7+0035 | 0.268 | 1.03 | 0.57 | 0.50 | 14.0 | 14.1 | |
| J0433+0521 | 3C 120 | ccFermi LAT detection reported by Abdo et al. (2010b) | 0.033 | 0.39 | 3.54 | 2.08 | 0.63 | 13.5 | 13.6 |
| J04420017 | NRAO 190 | 3FGL J0442.60017 | 0.845 | 2.30 | 1.46 | 1.36 | 13.0 | 13.3 | |
| J0449+1121 | PKS 0446+11 | 3FGL J0449.0+1121 | 2.153 | 1.74 | 1.07 | 0.69 | 12.8 | 13.2 | |
| J04532807 | OF 285 | 3FGL J0453.22808 | 2.559 | 1.72 | 1.55 | 12.5 | 13.0 | ||
| J04572324 | PKS 0454234 | 3FGL J0457.02324 | 1.003 | 2.39 | 1.83 | 1.01 | 12.7 | 13.0 | |
| J05010159 | S3 045802 | 3FGL J0501.20157 | 2.286 | 0.07 | 1.52 | 1.12 | 0.51 | 13.0 | 13.5 |
| J0530+1331 | PKS 0528+134 | 3FGL J0530.8+1330 | 2.070 | 3.54 | 1.83 | 0.33 | 12.8 | 13.3 | |
| J0532+0732 | OG 050 | 3FGL J0532.7+0732 | 1.254 | 0.06 | 1.65 | 1.35 | 0.94 | 12.6 | 12.9 |
| J0533+4822aa Low galactic latitude () | TXS 0529+483 | 3FGL J0533.2+4822 | 1.160 | 0.03 | 1.64 | 1.30 | 0.82 | 13.1 | 13.4 |
| J05410541 | PKS 0539057 | 1FGL J0540.90547 | 0.838 | 0.03 | 1.41 | 0.82 | 1.44 | 12.4 | 12.7 |
| J0555+3948aa Low galactic latitude () | DA 193 | 2.363 | 0.21 | 4.21 | 3.85 | 0.74 | |||
| J06070834 | OC 010 | 3FGL J0608.00835 | 0.870 | 3.33 | 2.15 | 0.92 | 12.1 | 12.3 | |
| J06091542 | PKS 060715 | 0.3226 | 5.99 | 3.64 | 0.52 | 12.2 | 12.3 | ||
| J0646+4451 | OH 471 | 3.396 | 3.81 | 3.35 | 0.86 | 11.8 | 12.5 | ||
| J06501637aa Low galactic latitude () | PKS 064816 | 3FGL J0650.41636 | 0.16 | 2.63 | 1.83 | 0.69 | |||
| J0721+7120 | S5 0716+71 | 3FGL J0721.9+7120 | 0.127 | 0.04 | 4.12 | 1.87 | 1.14 | 14.4 | 14.5 |
| J07250054aa Low galactic latitude () | PKS 0723008 | 3FGL J0725.80054 | 0.127 | 0.05 | 4.55 | 4.12 | 2.19 | 13.4 | 13.5 |
| J07301141aa Low galactic latitude () | PKS 072711 | 3FGL J0730.21141 | 1.591 | 9.54 | 6.86 | 1.34 | 12.6 | 13.0 | |
| J0733+5022 | TXS 0730+504 | 3FGL J0733.8+5021 | 0.720 | 0.74 | 0.60 | 0.51 | 12.7 | 12.9 | |
| J0738+1742 | OI 158 | 3FGL J0738.1+1741 | 0.450 | 0.08 | 0.92 | 0.59 | 0.46 | 13.5 | 13.7 |
| J0739+0137 | OI 061 | 3FGL J0739.4+0137 | 0.1894 | 0.03 | 2.41 | 1.21 | 0.75 | 13.2 | 13.3 |
| J0741+3112 | OI 363 | 0.631 | 0.05 | 1.78 | 1.20 | 0.58 | |||
| J0745+1011 | PKS B0742+103 | 2.624 | 0.04 | 1.47 | 1.38 | 0.73 | |||
| J07450044 | OI 072 | 0.996 | 1.55 | 1.37 | 0.80 | ||||
| J0748+2400 | S3 0745+24 | 3FGL J0748.3+2401 | 0.4092 | 1.63 | 1.17 | 1.05 | 12.8 | 13.0 | |
| J0750+1231 | OI 280 | 3FGL J0750.6+1232 | 0.889 | 5.04 | 4.06 | 1.11 | 12.6 | 12.9 | |
| J0757+0956 | PKS 0754+100 | 3FGL J0757.0+0956 | 0.266 | 2.01 | 1.46 | 0.69 | 13.4 | 13.5 | |
| J0808+4950 | OJ 508 | 3FGL J0807.9+4946 | 1.436 | 1.03 | 0.47 | 0.43 | 12.1 | 12.5 | |
| J08080751 | PKS 080507 | 3FGL J0808.20751 | 1.837 | 0.03 | 2.53 | 1.52 | 1.53 | 12.8 | 13.2 |
| J0811+0146 | OJ 014 | 3FGL J0811.3+0146 | 1.148 | 1.36 | 0.97 | 0.86 | 13.0 | 13.3 | |
| J0818+4222 | OJ 425 | 3FGL J0818.2+4223 | 2.12 | 1.55 | 1.17 | 13.1 | |||
| J0824+3916 | 4C +39.23 | 3FGL J0824.9+3916 | 1.216 | 0.13 | 1.36 | 1.05 | 0.82 | 12.6 | 12.9 |
| J0825+0309 | PKS 0823+033 | 3FGL J0826.0+0307 | 0.505 | 2.14 | 0.76 | 1.02 | 13.0 | 13.2 | |
| J0830+2410 | OJ 248 | 3FGL J0830.7+2408 | 0.942 | 2.08 | 1.31 | 0.94 | 12.6 | 12.8 | |
| J0831+0429 | OJ 049 | 3FGL J0831.9+0430 | 0.174 | 1.20 | 0.66 | 0.70 | 13.6 | 13.6 | |
| J08362016 | PKS 083420 | 3FGL J0836.52020 | 2.752 | 0.14 | 2.18 | 2.07 | 0.63 | 11.9 | 12.4 |
| J0841+7053 | 4C +71.07 | 3FGL J0841.4+7053 | 2.218 | 0.02 | 3.07 | 2.19 | 1.16 | 12.4 | 12.9 |
| J0840+1312 | 3C 207 | 3FGL J0840.8+1315 | 0.680 | 0.13 | 1.79 | 1.27 | 0.93 | ||
| J08501213 | PMN J08501213 | 3FGL J0850.21214 | 0.566 | 1.62 | 0.57 | 1.70 | 13.1 | 13.3 | |
| J0854+2006 | OJ 287 | 3FGL J0854.8+2006 | 0.306 | 11.05 | 4.68 | 1.88 | 13.7 | 13.8 | |
| J09021415 | PKS B0859140 | 1.339 | 0.16 | 1.28 | 0.83 | 0.65 | |||
| J0909+0121 | 4C +01.24 | 3FGL J0909.1+0121 | 1.026 | 2.69 | 1.42 | 0.97 | 13.5 | 13.8 | |
| J0920+4441 | S4 0917+44 | 3FGL J0920.9+4442 | 2.189 | 2.17 | 2.02 | 1.48 | 13.0 | 13.5 | |
| J0921+6215 | OK 630 | 3FGL J0921.8+6215 | 1.453 | 0.04 | 1.45 | 1.20 | 0.75 | 12.5 | 12.9 |
| J0927+3902 | 4C +39.25 | 0.695 | 12.33 | 10.39 | 0.89 | 12.4 | 12.6 | ||
| J0948+4039 | 4C +40.24 | 3FGL J0948.6+4041 | 1.249 | 0.06 | 1.82 | 1.43 | 0.94 | 12.5 | 12.9 |
| J0958+6533 | S4 0954+65 | 3FGL J0958.6+6534 | 0.367 | 2.53 | 1.31 | 0.99 | 13.4 | 13.5 | |
| J0958+4725 | OK 492 | 3FGL J0957.4+4728 | 1.882 | 1.20 | 0.75 | 0.63 | 12.2 | 12.6 | |
| J1033+4116 | S4 1030+41 | 3FGL J1033.2+4116 | 1.117 | 2.71 | 1.39 | 12.8 | 13.1 | ||
| J10372934 | PKS 1034293 | 3FGL J1037.02934 | 0.312 | 0.09 | 2.57 | 2.28 | 0.94 | 12.8 | 12.9 |
| J1038+0512 | PKS 1036+054 | 0.473 | 1.95 | 1.29 | 0.69 | 12.4 | 12.5 | ||
| J1041+0610 | 4C +06.41 | 1.265 | 1.53 | 1.34 | 0.83 | 12.7 | 13.0 | ||
| J10481909 | PKS 104518 | 0.595 | 2.09 | 1.21 | 1.20 | 12.7 | 12.9 | ||
| J1058+0133 | 4C +01.28 | 3FGL J1058.5+0133 | 0.888 | 0.08 | 5.51 | 4.77 | 0.91 | 12.8 | 13.1 |
| J11271857 | PKS 1124186 | 3FGL J1127.01857 | 1.048 | 0.08 | 3.29 | 1.80 | 1.14 | 13.2 | 13.5 |
| J11301449 | PKS 112714 | 3FGL J1129.91446 | 1.184 | 0.04 | 3.71 | 2.29 | 0.94 | 12.7 | 13.0 |
| J1130+3815 | B2 1128+38 | 3FGL J1131.4+3819 | 1.733 | 0.03 | 1.52 | 1.23 | 0.98 | 12.3 | 12.7 |
| J1153+4931 | 4C +49.22 | 3FGL J1153.4+4932 | 0.3334 | 0.04 | 1.93 | 1.78 | 1.76 | 13.1 | 13.2 |
| J1153+8058 | S5 1150+81 | 1.250 | 0.06 | 1.11 | 0.99 | 0.62 | 12.4 | 12.8 | |
| J1159+2914 | 4C +29.45 | 3FGL J1159.5+2914 | 0.725 | 0.10 | 3.60 | 2.26 | 0.64 | 12.9 | 13.2 |
| J12151731 | PKS 121317 | 0.05 | 1.95 | 1.70 | 0.75 | ||||
| J1222+0413 | 4C +04.42 | 3FGL J1222.4+0414 | 0.966 | 1.42 | 1.00 | 1.21 | 12.8 | 13.1 | |
| J1224+2122 | 4C +21.35 | 3FGL J1224.9+2122 | 0.434 | 0.16 | 2.56 | 1.99 | 1.05 | 13.1 | 13.3 |
| J1229+0203 | 3C 273 | 3FGL J1229.1+0202 | 0.1583 | 5.07 | 27.60 | 22.97 | 0.63 | 13.9 | 14.0 |
| J1230+1223 | M87 | 3FGL J1230.9+1224 | 0.00436 | 24.07 | 4.62 | 2.13 | 1.02 | ||
| J12560547 | 3C 279 | 3FGL J1256.10547 | 0.536 | 33.71 | 15.90 | 1.05 | 12.9 | 13.1 | |
| J1310+3220 | OP 313 | 3FGL J1310.6+3222 | 0.997 | 3.06 | 2.70 | 0.77 | 13.0 | 13.3 | |
| J1327+2210 | B2 1324+22 | 3FGL J1326.8+2211 | 1.403 | 1.46 | 1.03 | 0.64 | 12.5 | 12.9 | |
| J13371257 | PKS 1335127 | 3FGL J1337.61257 | 0.539 | 0.09 | 6.80 | 4.17 | 0.58 | 12.5 | 12.7 |
| J14080752 | PKS B1406076 | 3FGL J1408.80751 | 1.494 | 1.10 | 0.95 | 0.69 | 12.7 | 13.1 | |
| J1415+1320 | PKS B1413+135 | 3FGL J1416.0+1325 | 0.247 | 1.23 | 0.67 | 0.51 | 12.8 | 12.9 | |
| J1419+3821 | B3 1417+385 | 3FGL J1419.8+3819 | 1.831 | 1.21 | 0.62 | 0.73 | 12.4 | 12.9 | |
| J1436+6336 | VIPS 0792 | 2.066 | 0.07 | 1.54 | 1.43 | 1.09 | 12.6 | 13.1 | |
| J1459+7140 | 3C 309.1 | 0.904 | 0.80 | 0.80 | 0.61 | 0.41 | |||
| J1504+1029 | OR 103 | 3FGL J1504.4+1029 | 1.8385 | 3.33 | 1.51 | 1.22 | 12.7 | 13.2 | |
| J15071652 | PKS 1504167 | 0.876 | 0.04 | 1.04 | 0.86 | 0.45 | 12.4 | 12.7 | |
| J15120905 | PKS 151008 | 3FGL J1512.80906 | 0.360 | 0.04 | 6.68 | 2.50 | 1.34 | 13.5 | 13.7 |
| J1516+1932 | PKS 1514+197 | 3FGL J1516.9+1926 | 1.070 | 1.75 | 1.02 | 1.71 | 12.9 | 13.2 | |
| J15172422 | AP Librae | 3FGL J1517.62422 | 0.049 | 2.58 | 2.12 | 0.75 | 14.2 | 14.2 | |
| J15222730 | PKS 1519273 | 3FGL J1522.62730 | 1.297 | 0.99 | 0.87 | 0.51 | 12.8 | 13.2 | |
| J1540+1447 | 4C +14.60 | 3FGL J1540.8+1449 | 0.606 | 0.12 | 1.18 | 0.92 | 0.83 | 13.1 | 13.3 |
| J1549+0237 | PKS 1546+027 | 3FGL J1549.4+0237 | 0.414 | 2.60 | 1.79 | 0.58 | 12.9 | 13.1 | |
| J1550+0527 | 4C +05.64 | 3FGL J1550.5+0526 | 1.417 | 0.07 | 3.04 | 2.74 | 0.93 | 12.8 | 13.2 |
| J1608+1029 | 4C +10.45 | 3FGL J1608.6+1029 | 1.232 | 1.45 | 0.88 | 0.63 | 12.9 | 13.2 | |
| J1613+3412 | DA 406 | 3FGL J1613.8+3410 | 1.40 | 3.76 | 2.57 | 0.66 | 12.3 | 12.6 | |
| J16252527 | PKS 1622253 | 3FGL J1625.72527 | 0.786 | 0.19 | 2.91 | 2.00 | 0.67 | 12.6 | 12.9 |
| J16262951 | PKS 162229 | 3FGL J1626.02951 | 0.815 | 2.38 | 1.46 | 0.61 | 12.6 | 12.9 | |
| J1635+3808 | 4C +38.41 | 3FGL J1635.2+3809 | 1.813 | 4.15 | 3.37 | 0.93 | 12.5 | 12.9 | |
| J1638+5720 | OS 562 | 3FGL J1637.9+5719 | 0.751 | 0.04 | 2.33 | 1.46 | 0.89 | ||
| J1640+3946 | NRAO 512 | 3FGL J1640.6+3945 | 1.666 | 1.85 | 1.09 | 1.08 | 12.1 | 12.5 | |
| J1642+3948 | 3C 345 | 3FGL J1642.9+3950 | 0.593 | 0.30 | 9.15 | 7.36 | 0.74 | 13.0 | 13.2 |
| J1642+6856 | 4C +69.21 | 0.751 | 4.73 | 2.46 | 2.17 | 12.4 | 12.7 | ||
| J1658+0741 | PKS 1655+077 | 0.621 | 0.04 | 2.10 | 1.88 | 0.94 | 12.4 | 12.6 | |
| J1727+4530 | S4 1726+45 | 3FGL J1727.1+4531 | 0.717 | 2.49 | 1.27 | 1.14 | 12.8 | 13.1 | |
| J17331304 | NRAO 530 | 3FGL J1733.01305 | 0.902 | 0.46 | 5.26 | 4.26 | 0.35 | 13.0 | 13.3 |
| J1740+5211 | 4C +51.37 | 3FGL J1740.3+5211 | 1.379 | 2.00 | 1.27 | 0.75 | 13.1 | 13.5 | |
| J17430350 | PKS 174103 | 3FGL J1744.30353 | 1.054 | 5.66 | 3.72 | 0.72 | 12.3 | 12.7 | |
| J1751+0939 | 4C +09.57 | 3FGL J1751.5+0939 | 0.322 | 7.37 | 4.38 | 0.84 | 13.0 | 13.1 | |
| J1753+2848 | B2 1751+28 | 1.118 | 1.88 | 1.07 | 0.94 | ||||
| J1800+3848 | B3 1758+388B | 2.092 | 1.29 | 1.06 | 0.72 | 12.1 | 12.6 | ||
| J1801+4404 | S4 1800+44 | 3FGL J1801.5+4403 | 0.663 | 0.05 | 1.46 | 0.96 | 0.84 | 12.6 | 12.8 |
| J1800+7828 | S5 1803+784 | 3FGL J1800.5+7827 | 0.6797 | 0.02 | 3.40 | 2.65 | 1.04 | 13.4 | 13.7 |
| J1806+6949 | 3C 371 | 3FGL J1806.7+6949 | 0.051 | 0.23 | 1.64 | 1.34 | 0.95 | 14.2 | 14.2 |
| J1824+5651 | 4C +56.27 | 3FGL J1824.2+5649 | 0.664 | 0.09 | 1.67 | 1.50 | 0.64 | 13.2 | 13.4 |
| J1829+4844 | 3C 380 | 3FGL J1829.6+4844 | 0.692 | 1.12 | 2.56 | 2.10 | 0.96 | 13.0 | 13.2 |
| J1842+6809 | S4 1842+68 | 3FGL J1842.8+6810 | 0.472 | 0.02 | 1.64 | 0.60 | 0.92 | 12.3 | 12.4 |
| J1849+6705 | S4 1849+67 | 3FGL J1849.2+6705 | 0.657 | 3.13 | 2.44 | 1.03 | 13.2 | 13.4 | |
| J19112006 | PKS B1908201 | 3FGL J1911.22006 | 1.119 | 3.66 | 1.65 | 1.29 | 12.9 | 13.3 | |
| J19232104 | OV 235 | 3FGL J1923.52104 | 0.874 | 2.07 | 1.75 | 1.09 | |||
| J19242914 | PKS B1921293 | 3FGL J1924.82914 | 0.3526 | 1.39 | 20.99 | 13.40 | 0.86 | 12.5 | 12.6 |
| J1925+2106aa Low galactic latitude () | PKS B1923+210 | 0.05 | 2.33 | 1.82 | 0.70 | 12.2 | |||
| J1927+7358 | 4C +73.18 | 0.302 | 0.03 | 4.59 | 4.05 | 1.02 | 13.2 | 13.3 | |
| J19391525 | PKS 193615 | 1.657 | 0.03 | 0.88 | 0.69 | 0.50 | 12.0 | 12.4 | |
| J1959+4044aa Low galactic latitude () | Cygnus A | 0.0561 | 66.10 | 29.01 | 1.11 | 1.01 | |||
| J20001748 | PKS 1958179 | 3FGL J2001.01750 | 0.652 | 3.29 | 1.26 | 1.16 | 12.6 | 12.8 | |
| J2007+4029aa Low galactic latitude () | TXS 2005+403 | 1.736 | 3.88 | 3.49 | 1.25 | 12.2 | 12.6 | ||
| J2005+7752 | S5 2007+77 | 3FGL J2005.2+7752 | 0.342 | 0.08 | 1.55 | 0.80 | 0.83 | 13.4 | 13.6 |
| J20111546 | PKS 2008159 | 1.180 | 2.48 | 2.15 | 1.01 | 12.7 | 13.0 | ||
| J2015+3710aa Low galactic latitude () | TXS 2013+370 | 3FGL J2015.6+3709 | 0.859 | 0.16 | 4.42 | 2.95 | 0.99 | ||
| J2023+3153aa Low galactic latitude () | 4C +31.56 | 3FGL J2023.2+3154 | 0.356 | 0.14 | 1.27 | 1.19 | 0.59 | ||
| J2022+6136 | OW 637 | 0.227 | 2.41 | 2.32 | 0.75 | ||||
| J2025+3343aa Low galactic latitude () | B2 2023+33 | 3FGL J2025.2+3340 | 0.219 | 6.42 | 3.71 | 1.95 | |||
| J2031+1219 | PKS 2029+121 | 3FGL J2031.8+1223 | 1.213 | 2.10 | 1.51 | 1.53 | 12.6 | 13.0 | |
| J2038+5119aa Low galactic latitude () | 3C 418 | 3FGL J2038.8+5113 | 1.686 | 0.30 | 3.43 | 3.12 | 1.24 | 12.5 | 12.9 |
| J2123+0535 | OX 036 | 3FGL J2123.6+0533 | 1.941 | 1.99 | 1.64 | 0.53 | 12.5 | 13.0 | |
| J21311207 | PKS 212812 | 0.501 | 0.12 | 2.22 | 1.81 | 0.67 | |||
| J21340153 | 4C 02.81 | 3FGL J2134.10152 | 1.284 | 2.72 | 2.25 | 1.02 | 13.0 | 13.3 | |
| J2136+0041 | PKS 2134+004 | 1.932 | 7.32 | 6.86 | 0.99 | ||||
| J2139+1423 | OX 161 | 2.427 | 2.95 | 2.63 | 1.03 | 12.2 | 12.7 | ||
| J2148+0657 | 4C +06.69 | 1FGL J2148.5+0654 | 0.999 | 0.04 | 5.90 | 5.39 | 0.52 | 12.6 | 12.9 |
| J21581501 | PKS 2155152 | 3FGL J2158.01501 | 0.672 | 3.99 | 1.88 | 1.52 | 12.8 | 13.1 | |
| J2202+4216 | BL Lac | 3FGL J2202.7+4217 | 0.0686 | 0.02 | 7.83 | 4.40 | 1.24 | 13.7 | 13.7 |
| J2203+1725 | PKS 2201+171 | 3FGL J2203.4+1725 | 1.076 | 1.66 | 1.15 | 0.83 | 13.2 | 13.5 | |
| J2203+3145 | 4C +31.63 | 3FGL J2203.7+3143 | 0.2947 | 3.54 | 2.90 | 0.94 | 13.9 | 14.0 | |
| J2212+2355 | PKS 2209+236 | 3FGL J2212.0+2355 | 1.125 | 1.28 | 0.91 | 0.67 | 12.1 | 12.4 | |
| J22180335 | PKS 221603 | 0.901 | 0.11 | 2.04 | 1.51 | 0.60 | 12.3 | 12.6 | |
| J2225+2118 | DA 580 | 1.959 | 0.09 | 1.91 | 1.37 | 1.54 | 12.5 | 12.9 | |
| J22250457 | 3C 446 | 3FGL J2225.80454 | 1.404 | 0.88 | 8.05 | 5.86 | 1.01 | 12.9 | 13.3 |
| J22290832 | PHL 5225 | 3FGL J2229.70833 | 1.5595 | 3.80 | 2.39 | 1.76 | 12.8 | 13.2 | |
| J2232+1143 | CTA 102 | 3FGL J2232.5+1143 | 1.037 | 0.14 | 5.91 | 3.45 | 0.90 | 12.4 | 12.7 |
| J2236+2828 | CTD 135 | 3FGL J2236.3+2829 | 0.790 | 1.53 | 1.19 | 1.04 | 12.9 | 13.2 | |
| J22461206 | PKS 2243123 | 0.632 | 2.75 | 2.33 | 0.79 | 12.3 | 12.6 | ||
| J2253+1608 | 3C 454.3 | 3FGL J2254.0+1608 | 0.859 | 28.12 | 13.10 | 1.50 | 13.4 | 13.7 | |
| J22582758 | PKS 2255282 | 3FGL J2258.02759 | 0.927 | 4.72 | 3.13 | 0.51 | 12.6 | 12.9 | |
| J2327+0940 | OZ 042 | 3FGL J2327.7+0941 | 1.841 | 2.82 | 1.37 | 1.25 | 12.2 | 12.7 | |
| J2334+0736 | TXS 2331+073 | 3FGL J2334.1+0732 | 0.401 | 1.54 | 1.07 | 1.01 | 12.7 | 12.9 | |
| J23481631 | PKS 234516 | 3FGL J2348.01630 | 0.576 | 2.48 | 1.96 | 0.85 | 12.9 | 13.1 | |
| J2354+4553 | 4C +45.51 | 3FGL J2354.1+4605 | 1.986 | 0.15 | 1.01 | 0.81 | 0.44 | 12.2 | 12.7 |
Note. — Columns are as follows: (1) J2000 name, (2) other name, (3) Fermi catalog name, (4) redshift, (5) arcsecond-scale flux density at 15 GHz in Jy, (6) maximum 15 GHz VLBA flux density in Jy during 3FGL time window, (7) median 15 GHz VLBA flux density in Jy during 3FGL time window, (8) radio activity index, (9) log of observed synchrotron peak frequency in Hz (observer frame), (10) log of observed synchrotron peak frequency in Hz (rest frame).
| Property | Kolmogorov-Smirnov | Wilcoxon Rank Sum |
|---|---|---|
| Synchrotron peak location (observed) | ||
| Synchrotron peak location (rest frame) | ||
| Maximum observed jet speed | ||
| 15 GHz modulation index | ||
| Redshift | 0.50 | 0.45 |
| Radio activity indexaaDuring the 3FGL time window. | 0.10 | 0.14 |
| Median VLBA radio flux densityaaDuring the 3FGL time window. | 0.86 | 0.50 |
| Maximum VLBA radio flux densityaaDuring the 3FGL time window. | 0.04 | 0.05 |
| Median VLBA radio luminosityaaDuring the 3FGL time window. | 0.86 | 0.80 |
| Maximum VLBA radio luminosityaaDuring the 3FGL time window. | 0.76 | 0.73 |
Note. — The tabulated values indicate the probability of obtaining the observed distributions in the LAT and non-LAT detected sub-samples, under the null hypothesis that they came from the same parent distribution.