Stimulus-responsive colloidal sensors with fast holographic readout
Abstract
Colloidal spheres synthesized from polymer gels swell by absorbing molecules from solution. The resulting change in size can be monitored with nanometer precision using holographic video microscopy. When the absorbate is chemically similar to the polymer matrix, swelling is driven primarily by the entropy of mixing, and is limited by the surface tension of the swelling sphere and by the elastic energy of the polymer matrix. We demonstrate though a combination of optical micromanipulation and holographic particle characterization that the degree of swelling of a single polymer bead can be used to measure the monomer concentration in situ with spatial resolution comparable to the size of the sphere.
Stimulus-responsive colloidal particlesFujii et al. (2005); *stuart10 respond to physical or chemical changes in their environment through measurable changes in their own physical properties. Such particles have proved useful in a wide range of applications, ranging from drug-delivery systems to probe particles for sensors. Monitoring probe particles’ responses can be challenging, particularly for local probes involving changes in isolated particles. Here, we demonstrate that in-line holographic microscopy can be used to gauge the swelling of individual micrometer-scale polymer-gel spheres in situ and thus to measure the local concentration of selected chemical species, with excellent spatial and temporal resolution. The key to this technique is the ability of quantitative holographic video microscopyLee et al. (2007) to report the probe sphere’s radius with nanometer precision while simultaneously monitoring its refractive index with part-per-thousand resolution.
To demonstrate the holographic concentration probe, we combine holographic micromanipulationDufresne and Grier (1998); *grier03 with holographic video microscopyLee and Grier (2007); Lee et al. (2007) to measure concentration profiles of solubilized silicone oil in water. Our probe particles consist of polydimethylsiloxane (PDMS) synthesized by base-catalyzed hydrolysis and copolymerization of difunctional dimethyldiethoxysilane (DMDES) and trifunctional methyltriethoxysilane (MTES)Obey and Vincent (1994); *goller97. Synthesis and characterization of these particles is described elsewhereWang et al. (2015). When dispersed in pure water, these spheres have a nominal radius of , as measured by scanning electron microscopy and in situ holographic characterizationLee et al. (2007); Wang et al. (2015). Trifunctional groups act as crosslinkers for the PDMS gel, and the particles used in this study have crosslinker fractions of , , and .
PDMS gels absorb silicone oil and thus swell in the presence of monomeric DMDES to a degree that depends on the monomers’ concentration in solution. Measuring the sphere’s radius through holographic microscopy then provides a means to monitor the concentration of dissolved DMDES in real time.
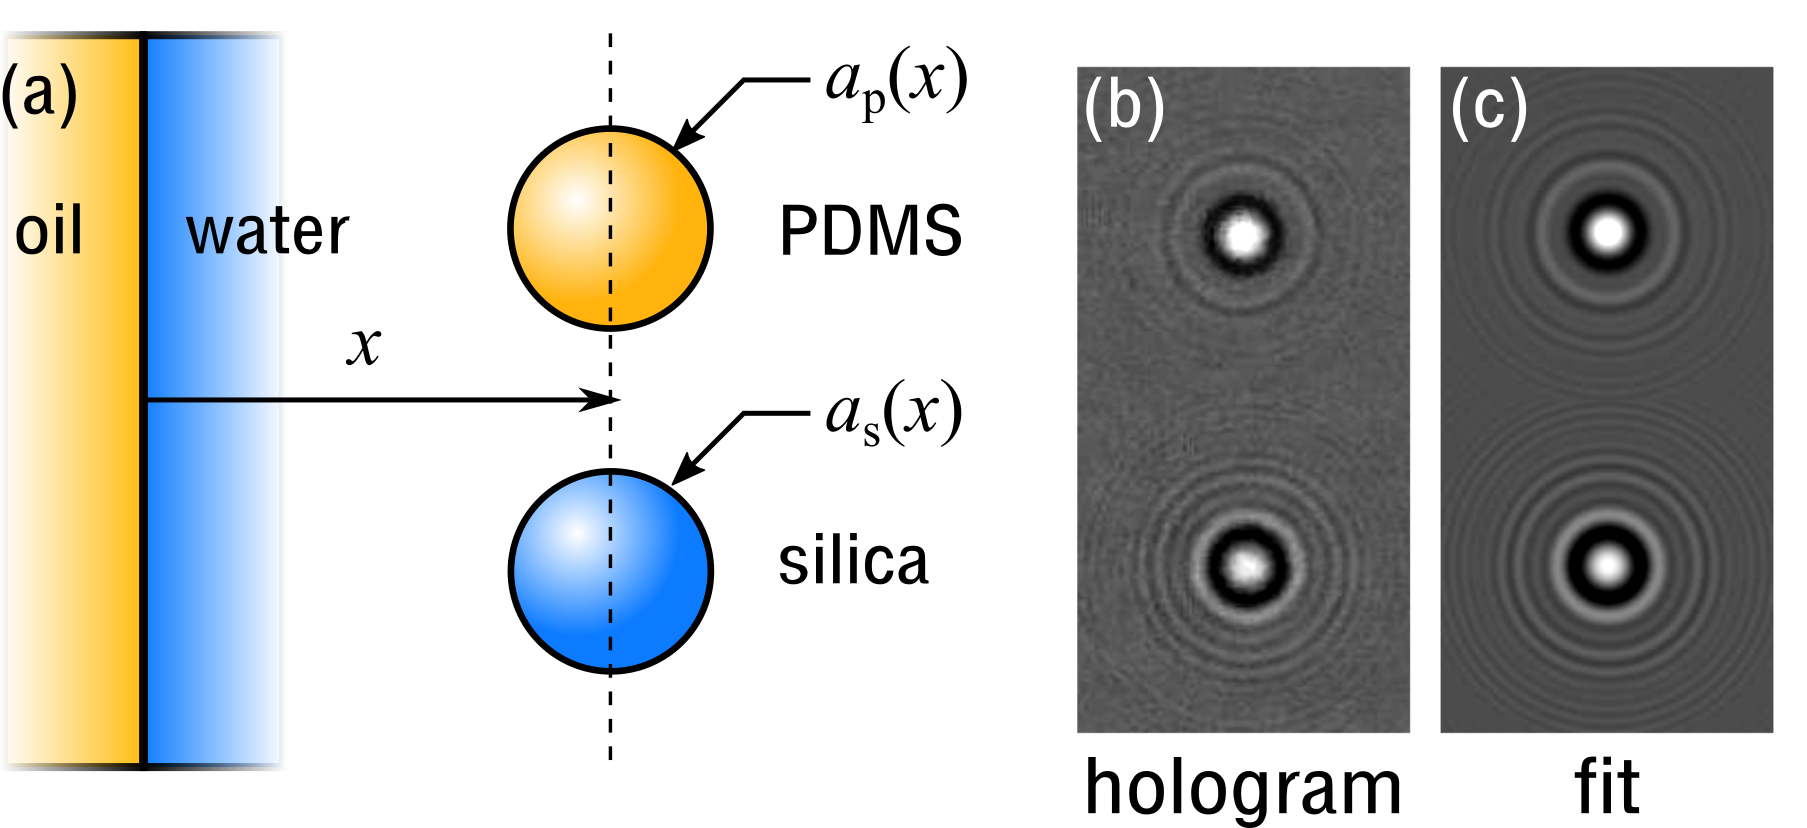
Our system, depicted schematically in Fig. 1, consists of a mixture of PDMS spheres and silica spheres (Bangs Laboratories, Catalog number SS04N) dispersed in a solution of aqueous ammonium hydroxide (Fisher Scientific). This solution fills half the length of a -long rectangular capillary tube with internal cross-section (Vitrocom 5005). The other half of the channel is filled with DMDES, and a nearly planar interface forms between the two phases. Ammonia hydrolyzes the silicone oil, permitting a small concentration to dissolve in the aqueous phase. The sample is sealed and then mounted on the stage of a custom-built holographic microscope with integrated holographic trapping capabilities.
Imaging is performed with a collimated laser beam at a vacuum wavelength of (Coherent Cube). Light scattered by the spheres interferes with the rest of the beam in the focal plane of an objective lens (Nikon, , numerical aperture 1.45, oil immersion) that collects the light and relays the magnified interference pattern to a video camera (NEC, TI-324A) that records its intensity at . The same objective lens is used to project optical traps into the sample. These traps operate at a vacuum wavelength of (IPG Photonics YLR-10-1064-LP) and are formed with computer-generated holograms that are projected with a phase-only spatial light modulator (Holoeye Pluto).
Holographic snapshots of colloidal particles are analyzedLee et al. (2007) using predictions of the Lorenz-Mie theory of light scatteringBohren and Huffman (1983); *mishchenko02 to obtain the spheres’ positions in three dimensions, their radii and their refractive indexes. Experiments on similar systems confirm nanometer precision for tracking in-plane, 5 nanometers precision along the axial direction, 3 nanometers precision for the spheres’ radii, and part-per-thousand resolution for their refractive indexesLee et al. (2007); Cheong et al. (2009); Shpaisman, Krishnatreya, and Grier (2012); Krishnatreya et al. (2014). Fit values for the refractive index are useful for distinguishing particles on the basis of their compositionLee et al. (2007); Yevick, Hannel, and Grier (2014). Each hologram can be analyzed during the interval between camera exposuresYevick, Hannel, and Grier (2014).
PDMS probe particles and silica spheres are dispersed in the aqueous phase at a volume fraction of so that no more than one sphere appears in the microscope’s field of view at a time. One PDMS sphere and one silica sphere are located, trapped in optical tweezers, and moved under software control to the midplane of the channel. The pair of spheres then is translated to a distance from the oil-water interface.
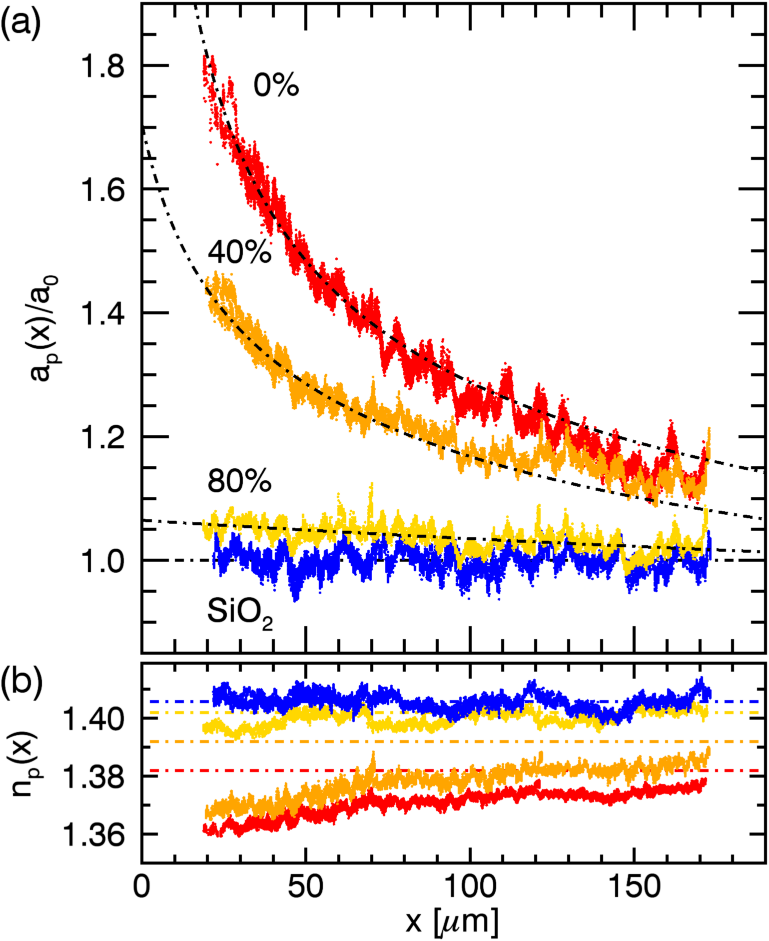
From this point, we probe the concentration profile of monomers in solution by moving the particles back and forth relative to the interface, recording and analyzing their holograms as they move. A detail from a typical holographic snapshot is reproduced in Fig. 1. The corresponding Lorenz-Mie result for this hologram illustrates the quality of a typical fit. The data in Fig. 2 show typical results from PDMS spheres with no crosslinker ( MTES), crosslinker and crosslinker, together with control data for a silica sphere (SiO2), that were obtained along with the data. Each trace in Fig. 2 consists of more than 10,000 individual measurements of the particle’s radius and refractive index obtained in at least one complete cycle of moving back and forth between and .
Because silica is hydrophilic, silicone monomers and oligomers should not wet the silica sphere’s surface. A silica sphere’s radius and refractive index consequently should not vary with monomer concentration. Indeed, Fig. 2 shows that the radius and refractive index of the silica sphere remains constant at and , respectively, independent of distance from the interface. Comparable results were obtained for silica spheres moving along with the crosslinked PDMS probe particles. These control measurements confirm that position-dependent variations in the refractive index of the medium are too small to influence holographic characterization in this systemLee et al. (2007); Moyses, Krishnatreya, and Grier (2013); Shpaisman, Krishnatreya, and Grier (2012). This, in turn, confirms that position-dependent changes in the observed properties of the PDMS probe particles reflect changes in the particles themselves, and not artifacts due to spatial variations in imaging conditions.
The PDMS spheres all swell consistently, reversibly and reproducibly when passed back and forth through the concentration gradient at a steady translation speed of . Their radii increase as they approach the interface, and decrease as they move away. Whereas the most highly crosslinked sphere swells by only a few percent, the sphere with no crosslinker nearly doubles its radius at its point of closest approach. The results’ repeatability suggests that concentration gradients evolves very little over the course of the measurement.
As the PDMS spheres swell, their refractive indexes decrease slightly. This would be explained naturally if the hydrolyzed absorbate has a lower refractive index than the fully dense gel matrix and thus reduces the swollen spheres’ mean refractive indexesShpaisman, Krishnatreya, and Grier (2012). The influence of an absorbate of refractive index on the overall refractive index of a swollen particle may be estimated with effective medium theoryAspnes (1982); *born99:
| (1) |
where is the refractive index of the unswollen sphere, is the volume fraction of polymer within a swollen sphere of radius whose unswollen radius is , and where is the Lorentz-Lorenz factor for a medium of refractive index . The Lorentz-Lorenz factor for the absorbate may be estimated from the data in Fig. 2 as
| (2) |
and, from this, the refractive index of the absorbate. We measured and for each of the PDMS spheres by translating them to .
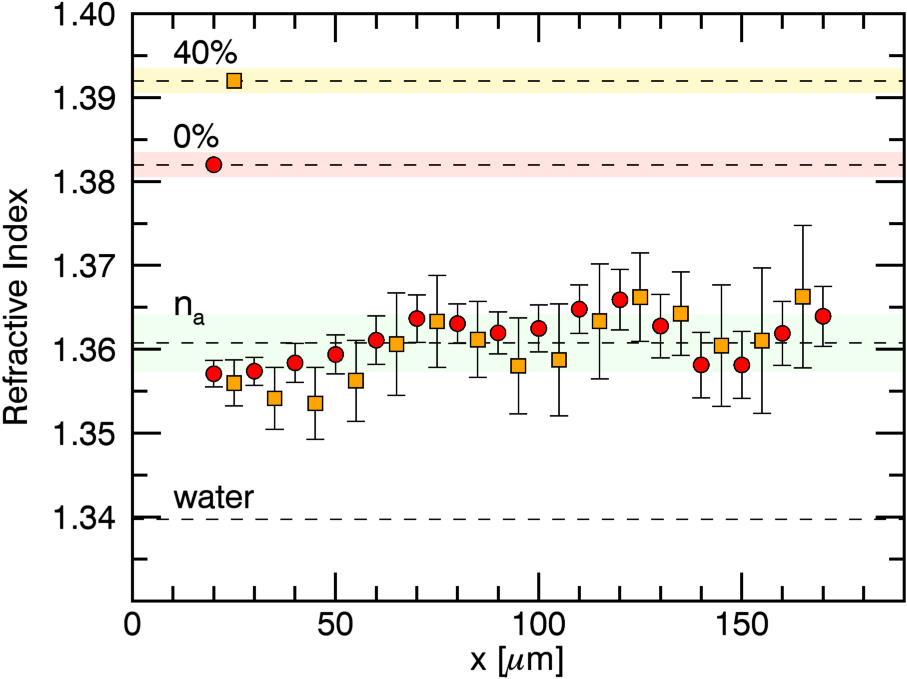
The data in Fig. 3 show results of this analysis for the probe particles with and crosslinker from Fig. 2. The estimated absorbate refractive index is substantially independent of position in the sample cell, as expected, despite large variations in the particles’ volumes over this range. Results consistent with are obtained from both probe particles, despite their substantially different bulk refractive indexes. The success of this procedure provides additional support for the accuracy and precision of the underlying holographic characterization measurements. The extracted value for the absorbates’ refractive index falls between the value for water, , and that for pure DMDES, .
To verify that the optical trap itself does not influence the sphere’s properties, we moved the particles to from the interface, and extinguished the laser traps to allow the particles to diffuse freely. Under these conditions, each probe particle’s radius increases and decreases in accord with its distance from the oil-water interface, and in agreement with the data in Fig. 2.
The implicit relationship between the probe spheres’ radii and the local concentration of dissolved monomer can be made quantitative using the Flory-Rehner model for polymer swellingFlory and Rehner (1943); *flory50; Quesada-Pérez et al. (2011). To do so, we treat a polymer sphere as consisting of a fixed number, , of bound monomers, each of specific volume . Swelling the sphere with free monomers increases its radius to
| (3) |
The unswollen radius, , corresponds to .
The tendency of free monomers to be absorbed by the polymer matrix may be accounted for, in part, by the entropy of mixingFlory (1941); *huggins41; Quesada-Pérez et al. (2011). In addition to free and bound monomers, we assume that a fraction of the bound monomers are trivalent crosslinkers. Treating these three classes of monomers as ideal gas molecules, their Gibbs free energy is
| (4) |
where is the thermal energy scale at absolute temperature and where is the volume fraction of free monomers in the sphere. The factor of accounts for the loss of entropy of the bound monomers due to their inability to rearrange freely. The associated entropic contribution to the free monomers’ chemical potential in a sphere of radius is
| (5) |
Equations (4) and (Stimulus-responsive colloidal sensors with fast holographic readout) do not account for the energy of association between the free and bound monomers that typically appears in Flory-Huggins theoryFlory (1941); *huggins41; Quesada-Pérez et al. (2011). This contribution may be ignored because it should be comparable to the energy of association between free monomers themselves, and so should not influence the exchange of monomers between the sphere and a reservoir of monomers.
Swelling reduces the crosslinkers’ entropy and thereby contributes
| (6) |
to the sphere’s elastic free energyFlory and Rehner (1943); *flory50; Quesada-Pérez et al. (2011). This in turn increases the chemical potential of absorbed monomers by
| (7) |
Finally, the interface between the sphere and the surrounding solution has a surface tension that raises the monomers’ free energy by
| (8) |
We assume that the same value of characterizes the surface tension for free monomers, bound monomers and crosslinkers alike. Surface tension then contributes
| (9) |
to the chemical potential, where is the sphere’s thermal capillary number.
Assuming no other significant contributions, the chemical potential of monomers in the sphere is
| (10) |
This is related to the equilibrium concentration of free monomers at the sphere’s surface by
| (11) |
where is the concentration at a planar interface.
When the sphere is placed in a solution with concentration , its radius is selected by the conditionWebster and Cates (1998)
| (12) |
and thus is a solution of the characteristic equation
| (13) |
The three adjustable parameters in Eq. (13), can be assessed independently. The crosslinker fraction, , is determined during synthesis to within . The surface tension between silicone oil and the ammonia solution, , is obtained with a pendant-drop tensiometer (attension, Theta Lite). Given the monomers’ specific volume of , this yields a thermal capillary number of , which is small enough to neglect. For the PDMS spheres in this study, independent NMR measurementsObey and Vincent (1994); *goller97 suggest . With these inputs, Eq. (13) relates a probe particles’ radius to the local monomer concentration provided that the particle remains in equilibrium with the solution.
Figure 4(a) shows a typical concentration profile measured in this way using a PDMS probe particle with crosslinker moving at . The gradient is linear and passes through , as expected. Because the data in Fig. 2 were obtained under similar conditions, we can compare measured probe-particle radii with predictions of Flory-Rehner theory by numerically inverting Eq. (13), assuming a linear concentration profile. Measurements of plotted in Fig. 2(a) agree well with this model. Estimates for based on Eq. (13) should be less reliable for more highly crosslinked particles both because of their more limited dynamic range, and also because Eq. (13) does not account for enthalpic contributions to the elastic energy.
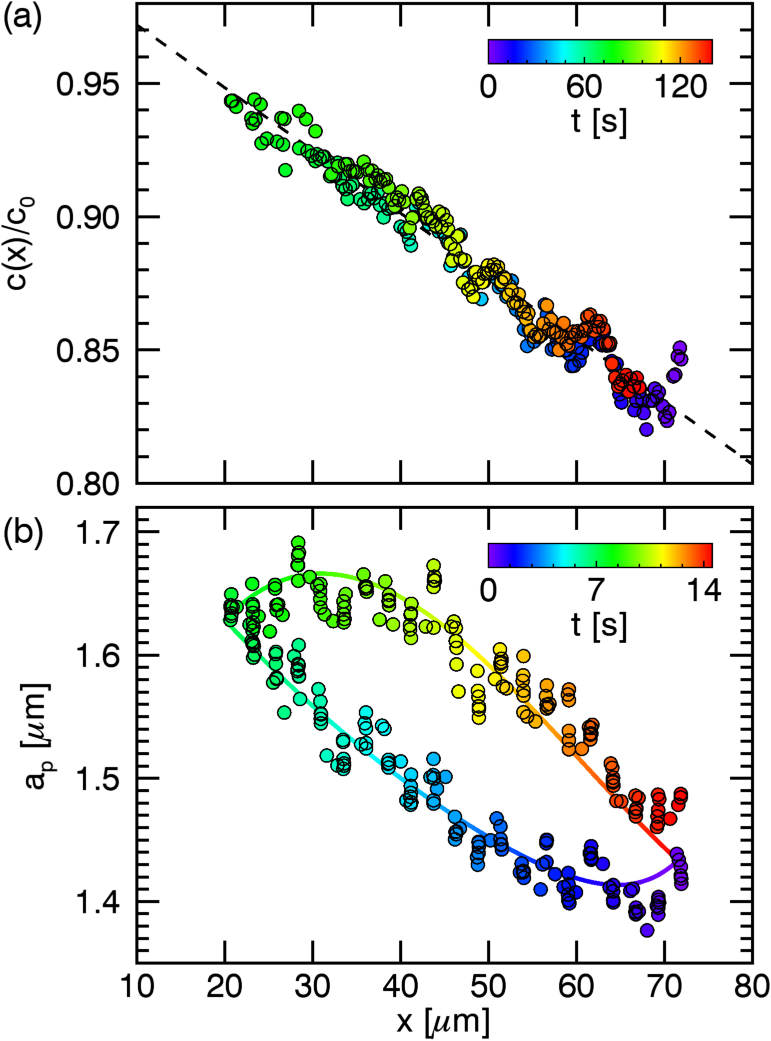
Having measured a concentration gradient, we then can probe the behavior of the system when particles move too quickly to equilibrate with the local concentration of monomers. The data in Fig. 4 were obtained with the probe particle moving at a translation speed of . Rather than retracing the history of swelling and deswelling, this trajectory displays substantial hysteresis.
We model this with the Lifshitz-Slyozov-Wagner equationLifshitz and Slyozov (1961); *wagner61; Webster and Cates (1998),
| (14) |
where is the monomers’ diffusion coefficient in solution. For simplicity, we assume that is independent of concentration over the relevant range of concentrations. Using experimental data for yields a prediction for the trajectory-dependent trace of that is overlaid on the experimental data in Fig. 4(b). The sole adjustable parameter in this fit is the prefactor, .
If the monomer diffusion coefficient is known independently the analysis in Fig. 4 yields a measurement of and thus an absolute measurement of . We estimate using the Stokes-Einstein relation to obtain . This is below the current resolution limitShpaisman, Krishnatreya, and Grier (2012) for holographic measurement of dissolved species through their influence on the medium’s refractive index. It is consistent therefore with the earlier observation that estimates for particles’ refractive indexes do not vary appreciably along the concentration gradient in the sample cell. Stimulus-responsive probe particles therefore extend the sensitivity of holographic microrefractometryShpaisman, Krishnatreya, and Grier (2012) for measuring small concentrations.
This study demonstrates that holographic video microscopy is effective for measuring the response of stimulus-responsive sensor particles. Our particular implementation uses swelling of polymer-gel particles to monitor the concentration of monomers in solution. Probe particles with different functionality that swell in response to other environmental factors could be used just as easily. Indeed, a variety of stimulus-responsive probes could be deployed in a single system to monitor multiple physical and chemical factors simultaneously. Holographic characterization’s ability to distinguish particle types by size and refractive index would enable parallel readout while maintaining speed and precision.
This work was supported by the National Science Foundation through Grant Number DMR-1305875. The holographic trapping and characterization instrument was developed under the MRI program of the NSF through Grant Number DMR-0922680. Additional support was provided by a grant from Procter & Gamble.
References
- Fujii et al. (2005) S. Fujii, S. P. Armes, T. Araki, and H. Ade, “Direct imaging and spectroscopic characterization of stimulus-responsive microgels,” J. Am. Chem. Soc. 127, 16808–16809 (2005).
- Stuart et al. (2010) M. A. C. Stuart, T. S. Huck, Wilhelm, J. Genzer, M. Müller, C. Ober, M. Stamm, G. B. Sukhorukov, I. Szleifer, V. V. Tsukruk, M. Urban, F. Winnik, S. Zauscher, I. Luzinov, and S. Minko, “Emerging applications of stimuli-responsive polymer materials,” Nature Materials 9, 101–113 (2010).
- Lee et al. (2007) S.-H. Lee, Y. Roichman, G.-R. Yi, S.-H. Kim, S.-M. Yang, A. van Blaaderen, P. van Oostrum, and D. G. Grier, “Characterizing and tracking single colloidal particles with video holographic microscopy,” Opt. Express 15, 18275–18282 (2007), 0712.1738 .
- Dufresne and Grier (1998) E. R. Dufresne and D. G. Grier, “Optical tweezer arrays and optical substrates created with diffractive optical elements,” Rev. Sci. Instrum. 69, 1974–1977 (1998).
- Grier (2003) D. G. Grier, “A revolution in optical manipulation,” Nature 424, 810–816 (2003).
- Lee and Grier (2007) S.-H. Lee and D. G. Grier, “Holographic microscopy of holographically trapped three-dimensional structures,” Opt. Express 15, 1505–1512 (2007).
- Obey and Vincent (1994) T. M. Obey and B. Vincent, “Novel monodisperse “silicone oil”/water emulsions,” J. Colloid Interface Sci. 163, 454–463 (1994).
- Goller et al. (1997) M. I. Goller, T. M. Obey, D. O. H. Teare, B. Vincent, and M. R. Wegener, “Inorganic “silicone oil” microgels,” Colloids Surfaces A 123-124, 183–193 (1997).
- Wang et al. (2015) C. Wang, H. Shpaisman, A. D. Hollingsworth, and D. G. Grier, “Monitoring colloidal growth with holographic microscopy,” Soft Matter 11, 1062–1066 (2015).
- Bohren and Huffman (1983) C. F. Bohren and D. R. Huffman, Absorption and Scattering of Light by Small Particles (Wiley Interscience, New York, 1983).
- Mishchenko, Travis, and Lacis (2001) M. I. Mishchenko, L. D. Travis, and A. A. Lacis, Scattering, Absorption and Emission of Light by Small Particles (Cambridge University Press, Cambridge, 2001).
- Cheong et al. (2009) F. C. Cheong, B. Sun, R. Dreyfus, J. Amato-Grill, K. Xiao, L. Dixon, and D. G. Grier, “Flow visualization and flow cytometry with holographic video microscopy,” Opt. Express 17, 13071–13079 (2009).
- Shpaisman, Krishnatreya, and Grier (2012) H. Shpaisman, B. J. Krishnatreya, and D. G. Grier, “Holographic microrefractometer,” Appl. Phys. Lett. 101, 091102 (2012).
- Krishnatreya et al. (2014) B. J. Krishnatreya, A. Colen-Landy, P. Hasebe, B. A. Bell, J. R. Jones, A. Sunda-Meya, and D. G. Grier, “Measuring Boltzmann’s constant through holographic video microscopy of a single sphere,” Am. J. Phys. 82, 23–31 (2014).
- Yevick, Hannel, and Grier (2014) A. Yevick, M. Hannel, and D. G. Grier, “Machine-learning approach to holographic particle characterization,” Opt. Express 22, 26884–26890 (2014).
- Moyses, Krishnatreya, and Grier (2013) H. Moyses, B. J. Krishnatreya, and D. G. Grier, “Robustness of holographic video microscopy against defects in illumination,” Opt. Express 21, 5968–5973 (2013).
- Aspnes (1982) D. E. Aspnes, “Local-field effects and effective-medium theory: A microscopic perspective,” Am. J. Phys. 50, 704–709 (1982).
- Born and Wolf (1999) M. Born and E. Wolf, Principles of Optics, 7th ed. (Cambridge University Press, Cambridge, 1999).
- Flory and Rehner (1943) P. J. Flory and J. Rehner, “Statistical mechanics of cross-linked polymer networks ii. swelling,” J. Chem. Phys. 11, 521–526 (1943).
- Flory (1950) P. J. Flory, “Statistical mechanics of swelling of network structures,” J. Chem. Phys. 18, 108–111 (1950).
- Quesada-Pérez et al. (2011) M. Quesada-Pérez, J. A. Maroto-Centeno, J. Forcada, and R. Hidalgo-Alvarez, “Gel swelling theories: the classical formalism and recent approaches,” Soft Matter 7, 10536 (2011).
- Flory (1941) P. J. Flory, “Thermodynamics of high polymer solutions,” J. Chem. Phys. 9, 660–661 (1941).
- Huggins (1941) M. L. Huggins, “Solutions of long chain compounds,” J. Chem. Phys. 9, 440 (1941).
- Webster and Cates (1998) A. J. Webster and M. E. Cates, “Stabilization of emulsions by trapped species,” Langmuir 14, 2068–2079 (1998).
- Lifshitz and Slyozov (1961) I. M. Lifshitz and V. V. Slyozov, “The kinetics of precipitation from supersaturated solid solutions,” J. Phys. Chem. Solids 19, 35–50 (1961).
- Wagner (1961) C. Wagner, “Theorie der Alterung von Niederschlägen durch Umlösen (Ostwald-Reifung),” Z. Elektrochemie 65, 581–591 (1961).