M. Ablikim1, M. N. Achasov9,f, X. C. Ai1,
O. Albayrak5, M. Albrecht4, D. J. Ambrose44,
A. Amoroso49A,49C, F. F. An1, Q. An46,a,
J. Z. Bai1, R. Baldini Ferroli20A, Y. Ban31,
D. W. Bennett19, J. V. Bennett5, M. Bertani20A,
D. Bettoni21A, J. M. Bian43, F. Bianchi49A,49C,
E. Boger23,d, I. Boyko23, R. A. Briere5,
H. Cai51, X. Cai1,a, O. Cakir40A,b,
A. Calcaterra20A, G. F. Cao1, S. A. Cetin40B,
J. F. Chang1,a, G. Chelkov23,d,e, G. Chen1,
H. S. Chen1, H. Y. Chen2, J. C. Chen1,
M. L. Chen1,a, S. J. Chen29, X. Chen1,a,
X. R. Chen26, Y. B. Chen1,a, H. P. Cheng17,
X. K. Chu31, G. Cibinetto21A, H. L. Dai1,a,
J. P. Dai34, A. Dbeyssi14, D. Dedovich23,
Z. Y. Deng1, A. Denig22, I. Denysenko23,
M. Destefanis49A,49C, F. De Mori49A,49C,
Y. Ding27, C. Dong30, J. Dong1,a,
L. Y. Dong1, M. Y. Dong1,a, S. X. Du53,
P. F. Duan1, E. E. Eren40B, J. Z. Fan39,
J. Fang1,a, S. S. Fang1, X. Fang46,a,
Y. Fang1, L. Fava49B,49C, F. Feldbauer22,
G. Felici20A, C. Q. Feng46,a, E. Fioravanti21A,
M. Fritsch14,22, C. D. Fu1, Q. Gao1,
X. Y. Gao2, Y. Gao39, Z. Gao46,a,
I. Garzia21A, K. Goetzen10, W. X. Gong1,a,
W. Gradl22, M. Greco49A,49C, M. H. Gu1,a,
Y. T. Gu12, Y. H. Guan1, A. Q. Guo1,
L. B. Guo28, Y. Guo1, Y. P. Guo22,
Z. Haddadi25, A. Hafner22, S. Han51,
X. Q. Hao15, F. A. Harris42, K. L. He1,
X. Q. He45, T. Held4, Y. K. Heng1,a,
Z. L. Hou1, C. Hu28, H. M. Hu1,
J. F. Hu49A,49C, T. Hu1,a, Y. Hu1,
G. M. Huang6, G. S. Huang46,a, J. S. Huang15,
X. T. Huang33, Y. Huang29, T. Hussain48,
Q. Ji1, Q. P. Ji30, X. B. Ji1, X. L. Ji1,a,
L. W. Jiang51, X. S. Jiang1,a, X. Y. Jiang30,
J. B. Jiao33, Z. Jiao17, D. P. Jin1,a,
S. Jin1, T. Johansson50, A. Julin43,
N. Kalantar-Nayestanaki25, X. L. Kang1,
X. S. Kang30, M. Kavatsyuk25, B. C. Ke5,
P. Kiese22, R. Kliemt14, B. Kloss22,
O. B. Kolcu40B,i, B. Kopf4, M. Kornicer42,
W. Kühn24, A. Kupsc50, J. S. Lange24,
M. Lara19, P. Larin14, C. Leng49C, C. Li50,
Cheng Li46,a, D. M. Li53, F. Li1,a,
F. Y. Li31, G. Li1, H. B. Li1, J. C. Li1,
Jin Li32, K. Li33, K. Li13, Lei Li3,
P. R. Li41, T. Li33, W. D. Li1, W. G. Li1,
X. L. Li33, X. M. Li12, X. N. Li1,a,
X. Q. Li30, Z. B. Li38, H. Liang46,a,
Y. F. Liang36, Y. T. Liang24, G. R. Liao11,
D. X. Lin14, B. J. Liu1, C. X. Liu1,
F. H. Liu35, Fang Liu1, Feng Liu6,
H. B. Liu12, H. H. Liu16, H. H. Liu1,
H. M. Liu1, J. Liu1, J. B. Liu46,a,
J. P. Liu51, J. Y. Liu1, K. Liu39,
K. Y. Liu27, L. D. Liu31, P. L. Liu1,a,
Q. Liu41, S. B. Liu46,a, X. Liu26,
Y. B. Liu30, Z. A. Liu1,a, Zhiqing Liu22,
H. Loehner25, X. C. Lou1,a,h, H. J. Lu17,
J. G. Lu1,a, Y. Lu1, Y. P. Lu1,a,
C. L. Luo28, M. X. Luo52, T. Luo42,
X. L. Luo1,a, X. R. Lyu41, F. C. Ma27,
H. L. Ma1, L. L. Ma33, Q. M. Ma1, T. Ma1,
X. N. Ma30, X. Y. Ma1,a, F. E. Maas14,
M. Maggiora49A,49C, Y. J. Mao31, Z. P. Mao1,
S. Marcello49A,49C, J. G. Messchendorp25,
J. Min1,a, R. E. Mitchell19, X. H. Mo1,a,
Y. J. Mo6, C. Morales Morales14, K. Moriya19,
N. Yu. Muchnoi9,f, H. Muramatsu43, Y. Nefedov23,
F. Nerling14, I. B. Nikolaev9,f, Z. Ning1,a,
S. Nisar8, S. L. Niu1,a, X. Y. Niu1,
S. L. Olsen32, Q. Ouyang1,a, S. Pacetti20B,
P. Patteri20A, M. Pelizaeus4, H. P. Peng46,a,
K. Peters10, J. Pettersson50, J. L. Ping28,
R. G. Ping1, R. Poling43, V. Prasad1,
M. Qi29, S. Qian1,a, C. F. Qiao41,
L. Q. Qin33, N. Qin51, X. S. Qin1,
Z. H. Qin1,a, J. F. Qiu1, K. H. Rashid48,
C. F. Redmer22, M. Ripka22, G. Rong1,
Ch. Rosner14, X. D. Ruan12, V. Santoro21A,
A. Sarantsev23,g, M. Savrié21B,
K. Schoenning50, S. Schumann22, W. Shan31,
M. Shao46,a, C. P. Shen2, P. X. Shen30,
X. Y. Shen1, H. Y. Sheng1, W. M. Song1,
X. Y. Song1, S. Sosio49A,49C, S. Spataro49A,49C,
G. X. Sun1, J. F. Sun15, S. S. Sun1,
Y. J. Sun46,a, Y. Z. Sun1, Z. J. Sun1,a,
Z. T. Sun19, C. J. Tang36, X. Tang1,
I. Tapan40C, E. H. Thorndike44, M. Tiemens25,
M. Ullrich24, I. Uman40B, G. S. Varner42,
B. Wang30, D. Wang31, D. Y. Wang31,
K. Wang1,a, L. L. Wang1, L. S. Wang1,
M. Wang33, P. Wang1, P. L. Wang1,
S. G. Wang31, W. Wang1,a, X. F. Wang39,
Y. D. Wang14, Y. F. Wang1,a, Y. Q. Wang22,
Z. Wang1,a, Z. G. Wang1,a, Z. H. Wang46,a,
Z. Y. Wang1, T. Weber22, D. H. Wei11,
J. B. Wei31, P. Weidenkaff22, S. P. Wen1,
U. Wiedner4, M. Wolke50, L. H. Wu1,
Z. Wu1,a, L. G. Xia39, Y. Xia18, D. Xiao1,
H. Xiao47, Z. J. Xiao28, Y. G. Xie1,a,
Q. L. Xiu1,a, G. F. Xu1, L. Xu1, Q. J. Xu13,
X. P. Xu37, L. Yan46,a, W. B. Yan46,a,
W. C. Yan46,a, Y. H. Yan18, H. J. Yang34,
H. X. Yang1, L. Yang51, Y. Yang6,
Y. X. Yang11, M. Ye1,a, M. H. Ye7,
J. H. Yin1, B. X. Yu1,a, C. X. Yu30,
J. S. Yu26, C. Z. Yuan1, W. L. Yuan29,
Y. Yuan1, A. Yuncu40B,c, A. A. Zafar48,
A. Zallo20A, Y. Zeng18, B. X. Zhang1,
B. Y. Zhang1,a, C. Zhang29, C. C. Zhang1,
D. H. Zhang1, H. H. Zhang38, H. Y. Zhang1,a,
J. J. Zhang1, J. L. Zhang1, J. Q. Zhang1,
J. W. Zhang1,a, J. Y. Zhang1, J. Z. Zhang1,
K. Zhang1, L. Zhang1, X. Y. Zhang33,
Y. Zhang1, Y. N. Zhang41, Y. H. Zhang1,a,
Y. T. Zhang46,a, Yu Zhang41, Z. H. Zhang6,
Z. P. Zhang46, Z. Y. Zhang51, G. Zhao1,
J. W. Zhao1,a, J. Y. Zhao1, J. Z. Zhao1,a,
Lei Zhao46,a, Ling Zhao1, M. G. Zhao30,
Q. Zhao1, Q. W. Zhao1, S. J. Zhao53,
T. C. Zhao1, Y. B. Zhao1,a, Z. G. Zhao46,a,
A. Zhemchugov23,d, B. Zheng47, J. P. Zheng1,a,
W. J. Zheng33, Y. H. Zheng41, B. Zhong28,
L. Zhou1,a, X. Zhou51, X. K. Zhou46,a,
X. R. Zhou46,a, X. Y. Zhou1, K. Zhu1,
K. J. Zhu1,a, S. Zhu1, S. H. Zhu45,
X. L. Zhu39, Y. C. Zhu46,a, Y. S. Zhu1,
Z. A. Zhu1, J. Zhuang1,a, L. Zotti49A,49C,
B. S. Zou1, J. H. Zou1(BESIII Collaboration)1 Institute of High Energy Physics, Beijing 100049, People’s Republic of China
2 Beihang University, Beijing 100191, People’s Republic of China
3 Beijing Institute of Petrochemical Technology, Beijing 102617, People’s Republic of China
4 Bochum Ruhr-University, D-44780 Bochum, Germany
5 Carnegie Mellon University, Pittsburgh, Pennsylvania 15213, USA
6 Central China Normal University, Wuhan 430079, People’s Republic of China
7 China Center of Advanced Science and Technology, Beijing 100190, People’s Republic of China
8 COMSATS Institute of Information Technology, Lahore, Defence Road, Off Raiwind Road, 54000 Lahore, Pakistan
9 G.I. Budker Institute of Nuclear Physics SB RAS (BINP), Novosibirsk 630090, Russia
10 GSI Helmholtzcentre for Heavy Ion Research GmbH, D-64291 Darmstadt, Germany
11 Guangxi Normal University, Guilin 541004, People’s Republic of China
12 GuangXi University, Nanning 530004, People’s Republic of China
13 Hangzhou Normal University, Hangzhou 310036, People’s Republic of China
14 Helmholtz Institute Mainz, Johann-Joachim-Becher-Weg 45, D-55099 Mainz, Germany
15 Henan Normal University, Xinxiang 453007, People’s Republic of China
16 Henan University of Science and Technology, Luoyang 471003, People’s Republic of China
17 Huangshan College, Huangshan 245000, People’s Republic of China
18 Hunan University, Changsha 410082, People’s Republic of China
19 Indiana University, Bloomington, Indiana 47405, USA
20 (A)INFN Laboratori Nazionali di Frascati, I-00044, Frascati, Italy; (B)INFN and University of Perugia, I-06100, Perugia, Italy
21 (A)INFN Sezione di Ferrara, I-44122, Ferrara, Italy; (B)University of Ferrara, I-44122, Ferrara, Italy
22 Johannes Gutenberg University of Mainz, Johann-Joachim-Becher-Weg 45, D-55099 Mainz, Germany
23 Joint Institute for Nuclear Research, 141980 Dubna, Moscow region, Russia
24 Justus Liebig University Giessen, II. Physikalisches Institut, Heinrich-Buff-Ring 16, D-35392 Giessen, Germany
25 KVI-CART, University of Groningen, NL-9747 AA Groningen, The Netherlands
26 Lanzhou University, Lanzhou 730000, People’s Republic of China
27 Liaoning University, Shenyang 110036, People’s Republic of China
28 Nanjing Normal University, Nanjing 210023, People’s Republic of China
29 Nanjing University, Nanjing 210093, People’s Republic of China
30 Nankai University, Tianjin 300071, People’s Republic of China
31 Peking University, Beijing 100871, People’s Republic of China
32 Seoul National University, Seoul, 151-747 Korea
33 Shandong University, Jinan 250100, People’s Republic of China
34 Shanghai Jiao Tong University, Shanghai 200240, People’s Republic of China
35 Shanxi University, Taiyuan 030006, People’s Republic of China
36 Sichuan University, Chengdu 610064, People’s Republic of China
37 Soochow University, Suzhou 215006, People’s Republic of China
38 Sun Yat-Sen University, Guangzhou 510275, People’s Republic of China
39 Tsinghua University, Beijing 100084, People’s Republic of China
40 (A)Istanbul Aydin University, 34295 Sefakoy, Istanbul, Turkey; (B)Dogus University, 34722 Istanbul, Turkey; (C)Uludag University, 16059 Bursa, Turkey
41 University of Chinese Academy of Sciences, Beijing 100049, People’s Republic of China
42 University of Hawaii, Honolulu, Hawaii 96822, USA
43 University of Minnesota, Minneapolis, Minnesota 55455, USA
44 University of Rochester, Rochester, New York 14627, USA
45 University of Science and Technology Liaoning, Anshan 114051, People’s Republic of China
46 University of Science and Technology of China, Hefei 230026, People’s Republic of China
47 University of South China, Hengyang 421001, People’s Republic of China
48 University of the Punjab, Lahore-54590, Pakistan
49 (A)University of Turin, I-10125, Turin, Italy; (B)University of Eastern Piedmont, I-15121, Alessandria, Italy; (C)INFN, I-10125, Turin, Italy
50 Uppsala University, Box 516, SE-75120 Uppsala, Sweden
51 Wuhan University, Wuhan 430072, People’s Republic of China
52 Zhejiang University, Hangzhou 310027, People’s Republic of China
53 Zhengzhou University, Zhengzhou 450001, People’s Republic of China
a Also at State Key Laboratory of Particle Detection and Electronics, Beijing 100049, Hefei 230026, People’s Republic of China
b Also at Ankara University,06100 Tandogan, Ankara, Turkey
c Also at Bogazici University, 34342 Istanbul, Turkey
d Also at the Moscow Institute of Physics and Technology, Moscow 141700, Russia
e Also at the Functional Electronics Laboratory, Tomsk State University, Tomsk, 634050, Russia
f Also at the Novosibirsk State University, Novosibirsk, 630090, Russia
g Also at the NRC ”Kurchatov Institute, PNPI, 188300, Gatchina, Russia
h Also at University of Texas at Dallas, Richardson, Texas 75083, USA
i Also at Istanbul Arel University, 34295 Istanbul, Turkey
Abstract
Based on a sample of mesons produced in the radiative decay
in
events collected with the BESIII detector, the decay
is observed for the first time,
with a statistical significance of .
The branching fraction is
measured to be , which is in
agreement with theoretical predictions. The branching fraction of
is also measured to be
, which is the
most precise measurement to date, and the relative branching
fraction is
determined to be
.
pacs:
12.40.Vv, 14.40.Be, 13.20.Jf
I Introduction
The main decays of the meson PDG fall into
two distinct classes. The first class consists of hadronic decays into three pseudoscalar mesons, such as
, while the second class
has radiative decays into vector particles with quantum number
, such as , or . Model-dependent approaches for
describing low energy mesonic interactions, such as vector meson
dominance (VMD) Phys.Rev.C61.i , and the applicability of
chiral perturbation theory Phys.Rev.C61.i can be tested in
decays.
It is of interest to study the decay (V
represents vector meson) which proceeds via a two-body radiative decay
into a vector meson and an off-shell photon. The electron-positron
invariant mass distribution provides information about the intrinsic
structure of the meson and the momentum dependence
of the transition form factor. Recently, BESIII reported the
measurement of Phys.Rev.D87.092011 , which is found to be
dominated by , in agreement
with theoretical predictions Phys.Rev.C61.i ; Borasoy:2007pr .
Based on theoretical models Phys.Rev.C61.i ; Eur.Phys.J.A48.190 ,
the branching fraction of
is predicted to be around ,
but until now there has been no measurement of this decay. A sample of
events (
events njpsi in 2009 and njpsi2 in
2012) has been collected with the BESIII detector and offers us a
unique opportunity to investigate decays via
. In this paper, the observation of
, the analysis of the
decay , and the ratio of their branching
fractions are reported.
II Detector and Monte Carlo simulation
The BESIII detector is a magnetic spectrometer located
at the Beijing Electron Positron Collider (BEPCII, BEPCII ), which is a
double-ring collider with a design peak luminosity of
cm-2 s-1 at a center-of-mass energy of 3.773
GeV. The cylindrical core of the BESIII detector consists of a
helium-based multilayer drift chamber (MDC), a plastic scintillator
time-of-flight system (TOF), and a CsI (Tl) electromagnetic
calorimeter (EMC), which are all enclosed in a superconducting
solenoidal magnet providing a 1.0 T (0.9 T for the 2012 run period)
magnetic field. The solenoid is supported by an octagonal flux-return
yoke with modules of resistive plate muon counters (MUC) interleaved
with steel. The acceptance for charged particles and photons is 93%
of the full 4 solid angle. The momentum resolution for charged
particles at 1 GeV/ is 0.5%, and the resolution of the ionization
energy loss per unit path-length () is 6%. The EMC measures
photon energies with a resolution of 2.5% (5%) at 1 GeV in the
barrel (end-caps). The time resolution for the TOF is 80 ps in the
barrel and 110 ps in the end-caps. Information from
the TOF and is combined to perform particle identification
(PID).
The estimation of backgrounds and the determinations of detection
efficiencies are performed through Monte Carlo (MC) simulations. The
BESIII detector is modeled with geant4Agostinelli:2003hh ; Allison:2006ve . The production of the
resonance is implemented with the MC event generator
kkmcJadach:1999vf ; Jadach:2000ir , while the decays
are simulated with evtgenEvtGen . Possible backgrounds
are studied using a sample of ‘inclusive’ events
of approximately the equivalent luminosity of data, in which the
known decays of the are modeled with branching fractions
being set to the world average values from the Particle Data Group
(PDG) PDG , while the remaining decays are generated with the
lundcharm model Chen:2000 .
For this analysis, a signal MC sample ( events), based on the VMD model and
chiral perturbation theory Phys.Rev.C61.i for ,
, ,
, is generated to optimize the selection
criteria and determine the detection efficiency.
III ANALYSIS of
In this analysis, the meson is produced in the radiative decay
. The meson is observed in its dominant
decay mode, and the is detected in
. Therefore, signal events are observed in the
topology for the
mode, and
for . We apply the following basic reconstruction and selection
criteria to both channels:
We select tracks in the MDC within the polar angle range
and require that the points of closest approach to
the beam line be within cm of the interaction point in the
beam direction and within cm in the plane perpendicular to the
beam.
Photon candidates are reconstructed by clustering signals in EMC
crystals. At least four photon candidates are required, and the
minimum energy of each must be at least MeV for barrel showers
() and MeV for endcap showers
(). To exclude showers due to the
bremsstrahlung of charged particles, the angle between the nearest
charged track and the shower must be greater than .
To suppress electronics noise and energy deposits unrelated to the event,
the EMC cluster time is restricted to be within a 700 ns window near the event start time.
\color
black
III.1
For the decay , two particles with opposite
charge are required. No particle identification (PID) is used, and the
two tracks are taken to be positive and negative pions from the .
A four-constraint (4C) kinematic fit imposing energy-momentum
conservation is performed under the hypothesis of
. If there are more
than four photons, the combination with the smallest
is retained.
Events with
are retained for further analysis. Since is a two-body decay, the
radiative photon carries a unique energy of 1.4 GeV. Hence the photon
with maximum energy is taken as the radiative photon,
and its energy is required to be greater than 1.0 GeV.
The photon pair combination with
invariant mass closest to the mass is considered as the
candidate in the final state, and its invariant mass must
satisfy
GeV, where is the world average value of the
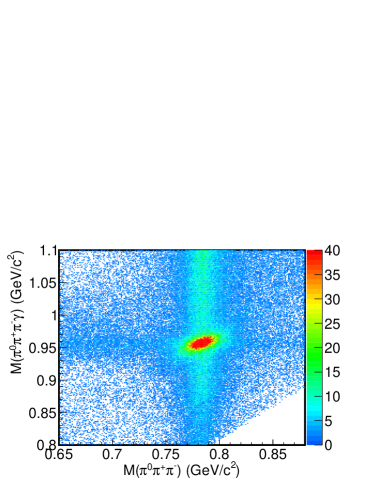
mass PDG . With these requirements, the decay
is observed in the distribution
of versus , shown in Fig. 1. Besides the region of interest in
Fig. 1 , there is a vertical band around the mass
region, which comes from , and background, while a horizontal band
also exists around the mass region, which comes from
,
and .
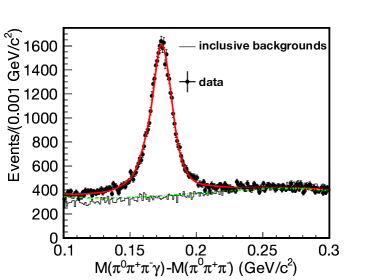
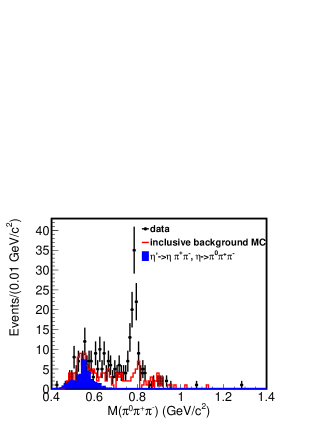
To improve the mass resolution, as well as to better handle the
background in the vertical band around the mass region and
horizontal band around the mass region, we determine
the signal yield from the distribution of the difference between
and . The backgrounds in the vertical and horizontal bands do not
peak in the signal region, which is demonstrated by the inclusive MC
sample, as shown by the histogram in Fig. 2.
Figure 1: Distribution of versus
from data.
To determine the signal yield, an unbinned maximum likelihood fit to
the mass difference is performed, in which the signal shape is described
by the MC shape convoluted with a Gaussian function to account for the
difference in resolution between data and MC simulation, and the
background is described by a 3rd-order Chebychev
polynomial. signal events
are obtained from the fit, whose curve is shown in
Fig. 2. With the detection efficiency, ,
obtained from MC simulation, the branching fraction,
, listed in Table 1, is
determined.
Figure 2: Distribution of the mass difference
. The dots with
error bars are data, the histogram shows the MC simulation of inclusive
decays. The solid curve represents the fit results, and the
dashed curve is the background determined by the fit.
III.2
For decay, candidate events with
four well-reconstructed charged tracks and at least three photons are
selected. The charged track and good photon selections are exactly the
same as described above.
To select candidate events and select the best photon combination when
additional photons are found in an event, the combination with the
smallest is retained. Here is the sum of the chi-squares
from the kinematic fit and from PID, formed
by combining TOF and information of each charged track for
each particle hypothesis (pion, electron, or muon). If the combination
with the smallest corresponds to two oppositely
charged pions and an electron and positron, and has , the event is kept as a
candidate. As
in the analysis of , the selected photon
with maximum energy is taken as the radiative photon, and its energy
is required to be greater than 1.0 GeV. The other two photons are
further required to be consistent with a candidate,
GeV.
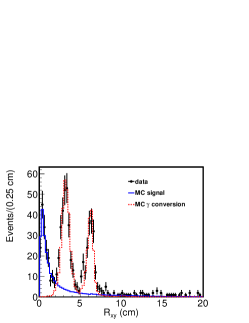
Figure 3: (a) Distribution of the distance of the reconstructed
vertex from the axis, , where the dots with
error bars are data, the solid histogram is signal MC
simulation, and the dotted histogram is MC simulation of
. (b) Distribution of
versus , where the requirement of cm is indicated as the vertical line. (c) Distribution of
with the requirement cm, where the dots with error
bars are data and the solid histogram is signal MC
simulation.
With the above selection criteria, MC simulation shows that
background peaking under the signal comes from ,
, with the from the
decay subsequently converting to an electron-positron pair. The
distribution of the distance from the reconstructed vertex point of an
electron-positron pair to the axis, defined as , is shown
in Fig. 3 (a). As expected from MC simulation of
, , the
peaks around cm and cm match the position of the
beam pipe and the inner wall of the MDC, respectively, as shown in
Fig. 3 (a). From the distribution of versus
and the projections, shown in
Figs. 3 (b) and (c), the requirement of cm can
cleanly discriminate signal from the background. The number of peaking
background events from that still survive
is estimated to be from MC simulation taking the
branching fraction of from this analysis, where the error is
statistical. This background will be subtracted in the calculation of
the branching fraction of .
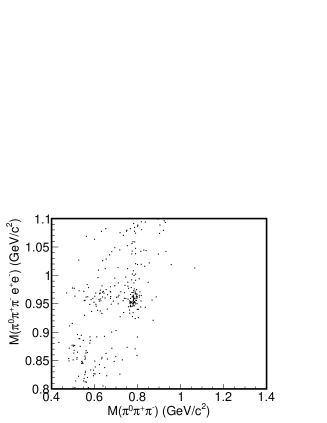
With all the above selection criteria being applied,
the scatter plot of versus
is shown in Fig. 4 (a),
where the cluster in the and region
corresponds to the decay . The
and peaks are clearly seen in the distributions
of (Fig. 4 (b))
and (Fig. 4 (c)),
respectively.
The same selection is applied to the inclusive MC sample of events
to investigate possible background channels. The corresponding normalized
distributions of and
are shown as the histograms in
Fig. 4 (b) and (c). One of the dominant backgrounds
is from events with multiple in the final state with one
undergoing Dalitz decay to . Another important
background, ,
with the pion pair from the decay misidentified as an
electron-positron pair, produces an accumulation at the low mass
region in the distributions of
and , and at the high mass region in
-, which
is shown as the shaded histograms in Fig. 4 (b), (c)
and (d), normalized with the branching fraction from the PDG. The
distribution of -
is shown in Fig. 4 (d). From this study of the
inclusive MC sample, no peaking background events are expected.
Figure 4: (a) Distribution of
versus . (b) Invariant
mass spectrum of . (c) Invariant mass spectrum
of . (d) Distribution of . The solid
histogram represents the remaining events from the inclusive MC
sample, and the shaded histogram shows misidentified events from the
background channel normalized
by using the branching fractions from the PDG PDG .
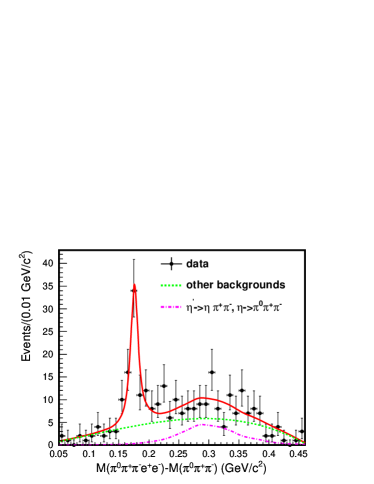
To determine the yield, an
unbinned maximum likelihood fit to
, shown in
Fig. 5, is performed. The signal component is modeled by the
MC simulated signal shape convoluted with a Gaussian function to
account for the difference in the mass resolution between data and MC
simulation. The shape of the dominant non-resonant background
is derived from the MC simulation, and
its magnitude is fixed taking into account the decay branching
fraction from the PDG PDG . The remaining background contributions
are described with a 2nd-order Chebychev polynomial. The fit shown in
Fig. 5 yields events
with a statistical significance of 8. The statistical
significance is determined by the change of the log-likelihood value and
of the number of degrees of freedom in the fit with and without the
signal included.
Figure 5: Distribution of and the fit results. The crosses show the
distribution of data. The dash-dotted line represents the
component, and the dotted curve
shows the background except
.
To determine the detection efficiency, we produce a signal MC sample
in which is modeled as the
decay amplitude in Ref. Phys.Rev.C61.i based on the VMD
model. After subtracting the peaking background events and taking into
account the detection efficiency of , the branching
fraction of is determined to be
. This is summarized in Table 1.
Table 1: Signal yields, detection efficiencies and the branching
fractions of and
. The first errors are statistical,
and the second are systematical.
Decay mode
Yield
(%)
Branching fraction
IV Systematic uncertainties
In this analysis, the systematic uncertainties on the branching fraction
measurements mainly come from the following sources:
a. MDC Tracking efficiency
The tracking efficiencies of pions and electrons have been
investigated using clean samples of ,
, and ().
Following the method described in Ref photonerror , we determine
the difference in tracking efficiency between data and simulation as 1%
for each charged pion and 1.2% for each electron. Therefore, 2% is taken as the systematic
error of the tracking efficiency for with
two charged tracks, and 4.4% for with
four charged tracks.
b. PID efficiency
For , PID is used when we obtain
of every combination for each
event. The decay , with is used as a control sample to estimate the difference
between data and MC with and without applying to
identify the particle type. The difference, , is taken as the
systematic uncertainty from PID for the decay .
c. Photon detection efficiency
The photon detection efficiency has been studied in
decays in Ref. photonerror . The difference between data and MC simulation
is determined to be 1% per photon. Therefore, 4% and 3% are
taken as the systematic uncertainties, respectively, for the two analyzed
decays.
Table 2: Summary of systematic uncertainties (in %) for the branching
fraction measurements.
Sources
MDC tracking
Photon detection
PID
Kinematic fit
conversion subtraction
Background uncertainty
Form factor uncertainty
mass window
total number
()
()
Total
d. Kinematic fit
The angular and momentum resolutions for charged tracks are significantly better
in simulation than in data. This results in a narrower
distribution in MC than in data and introduces a systematic bias in the
efficiency estimation associated with the kinematic fit.
The difference can be reduced by
correcting the track helix parameters of the simulated tracks, as described
in detail in Ref. 4cfiterror . In this analysis, a clean sample
of is selected to
study the difference of the helix parameters of pions and electrons
between data and MC simulation. The helix parameters of each charged
track are corrected so that from MC simulation is in
better agreement with that of data. With the same correction factors,
the kinematic fit is performed for the signal MC events and the
is required to be less than 80. By comparing the numbers
of selected signal events with and without the correction, we determine
the change in detection efficiencies to be and . These
are taken as the systematic uncertainties for and , respectively.
e. conversion event veto
In the analysis of , the large
contamination of conversion events from the decay
is effectively removed by the
requirement of cm. To estimate the uncertainty
associated with this requirement, we select a clean sample of
with .
The efficiency corrected signal yields with and without the
criterion differ by , which is taken as the systematic
uncertainty.
f. Background
The non-peaking background uncertainties in each channel are estimated
by varying the fit range and changing the background shape in the fit,
and they are determined to be 2.9% for .
To reduce the statistical uncertainty for ,
we use the background shape from the inclusive MC sample,
and the maximum change of the branching fraction, is taken as
the uncertainty from the non-peaking background. In order to evaluate the background
uncertainty from in the analysis of
the decay, to, we perform an
alternative fit by varying its contribution according to the
uncertainty from branching fractions of
and its cascade decays. We also vary the selection efficiency of this
background channel as determined by the MC sample, and find that the total difference
in the signal yield is about 0.3%, which can be ignored. In addition, the
change in the number of peaking background events from
due to a difference of the
conversion ratio between MC and data leads to an uncertainty of 1.0%
on the branching fraction of .
The total background uncertainties from these sources are listed in
Table. 2.
g. Form factor
The nominal signal MC model is based on the amplitude in Ref. Phys.Rev.C61.i
To
evaluate the uncertainty due to the choice of the form factors in the
determination of the detection efficiency, we also generate MC
samples with other form factors in Ref. Phys.Rev.C61.i , e.g.,
the monopole and dipole parameterizations. The maximum change of the
detection efficiency, , is regarded as the systematic
uncertainty from this source.
h. mass window requirement
The uncertainty from the mass window requirement due to the
difference in the mass resolution between data and simulation is
estimated by comparing the difference in efficiency of invariant mass
window requirement between data and signal MC
simulation. It is determined to be for the
mode.
Since the kinematics in the decay
is similar to the mode, the same value is
taken as the uncertainty from this source for both decay modes.
The contributions of systematic uncertainties studied above and the
uncertainties from the branching fractions
( and ) and the
number of events are summarized in Table 2,
where the total systematic uncertainty is obtained by adding the
individual contributions in quadrature, assuming all sources to be
independent.
V Results
The signal yields and detection efficiencies used to calculate the
branching fractions and the corresponding results are listed in
Table. 1. Using the PDG world averages of
and
PDG , the
branching fractions of and
are determined to be
(stat)(syst) and
(stat)(syst),
respectively. The ratio is then
determined to be (stat)(syst),
where several systematic uncertainties cancel, e.g., the uncertainties
associated with the charged pions (MDC tracking), photon detection efficiency,
branching fractions of and
and the mass window requirement.
VI Summary
With a sample of billion events collected with the
BESIII detector, we have analyzed the decays and
via
. For the first time, the decay of
is observed with a statistical significance
of 8, and its branching fraction is measured to be
(stat)(syst), which
is consistent with theoretical prediction,
Phys.Rev.C61.i . The branching fraction of
is determined to be
(stat)(syst), which is in good
agreement with the world average value in Ref. PDG and the most
precise measurement to date. In addition, the ratio
is determined to be
(stat)(syst).
Acknowledgements
The BESIII collaboration thanks the staff of BEPCII and the IHEP computing center for their strong support. This work is supported in part by National Key Basic Research Program of China under Contract No. 2015CB856700; National Natural Science Foundation of China (NSFC) under Contracts Nos. 11125525, 11235011, 11322544, 11335008, 11425524, 11175189; Youth Science Foundation of China under constract No. Y5118T005C; the Chinese Academy of Sciences (CAS) Large-Scale Scientific Facility Program; the CAS Center for Excellence in Particle Physics (CCEPP); the Collaborative Innovation Center for Particles and Interactions (CICPI); Joint Large-Scale Scientific Facility Funds of the NSFC and CAS under Contracts Nos. 11179007, U1232201, U1332201; CAS under Contracts Nos. KJCX2-YW-N29, KJCX2-YW-N45; 100 Talents Program of CAS; National 1000 Talents Program of China; INPAC and Shanghai Key Laboratory for Particle Physics and Cosmology; German Research Foundation DFG under Contract No. Collaborative Research Center CRC-1044; Istituto Nazionale di Fisica Nucleare, Italy; Ministry of Development of Turkey under Contract No. DPT2006K-120470; Russian Foundation for Basic Research under Contract No. 14-07-91152; The Swedish Resarch Council; U. S. Department of Energy under Contracts Nos. DE-FG02-04ER41291, DE-FG02-05ER41374, DE-FG02-94ER40823, DESC0010118; U.S. National Science Foundation; University of Groningen (RuG) and the Helmholtzzentrum fuer Schwerionenforschung GmbH (GSI), Darmstadt; WCU Program of National Research Foundation of Korea under Contract No. R32-2008-000-10155-0.
References
(1)
K. A. Olive et al. (Particle Data Group), Chin. Phys. C 38, 1 (2014).
(2)
A. Faessler, C. Fuchs, M. Krivoruchenko,
Phys. Rev. C 61, 035206 (2000).
(3)
M. Ablikim et al., (BESIII Collaboration), Phys. Rev. D 87, 092011 (2013).
(4)
B. Borasoy, R. Nissler,
Eur. Phys. J. A 33, 95 (2007).
(5)
C. Terschlüsen, S. Leupold, M. Lutz,
Eur. Phys. J. A 48, 190 (2012).
(6)
M. Ablikim et al. (BESIII Collaboration), Chin. Phys. C 36, 915 (2012).
(7) With the same approach as for events taken in
2009 (see Ref. njpsi for more details), the preliminary number of events
taken in 2009 and 2012 is determined to be with an uncertainty of .
(8)
M. Ablikim et al. (BESIII Collaboration), Nucl. Instrum. Meth. A 614, 345 (2010).
(9)
S. Agostinelli et al.,
Nucl. Instrum. Meth. A 506, 250 (2003).
(10)
J. Allison, K. Amako, J. Apostolakis, H. Araujo, P. Dubois et
al.,
IEEE Trans. Nucl. Sci. 53, 270 (2006).
(11)
S. Jadach, B. Ward, Z. Was,
Comput. Phys. Commun. 130, 260 (2000).
(12)
S. Jadach, B. Ward, Z. Was,
Phys. Rev. D 63, 113009 (2001).
(13)
D. J. Lange,
Nucl. Instrum. Meth. A 462, 152 (2001);
R. G. Ping,
Chin. Phys. C 32, 599 (2008).
(14)
J. C. Chen, G. S. Huang, X. R. Qi, D. H. Zhang, Y. S. Zhu, Phys. Rev. D 62, 034003 (2000).
(15)
M. Ablikim et al. (BESIII Collaboration), Phys. Rev. D 83, 112005 (2011).
(16)
M. Ablikim et al. (BESIII Collaboration), Phys. Rev. D 87, 012002 (2013).