Digital Sky Surveys from the ground: Status and Perspectives
Abstract
I first review the status of Digital Sky Surveys. The focus will be on extragalactic surveys with an area of more than 100deg2. The Sloan Digital Sky Survey is the archetype of such imaging surveys and it is its great success that has prompted great activity in this field. The latest surveys explore wider, fainter and higher resolution and also a longer wavelength range than SDSS. Many of these surveys overlap particularly in the S Hemisphere where we now have Pan-STARRS, DES and the ESO VST surveys, and our aim here is to compare their properties. Since there is no dedicated article on the VST ATLAS in this symposium, we shall especially review the properties of this particular survey. This easily fits onto our other main focus which is to compare overlapping Southern Surveys and see how they best fit with the available NIR imaging data. We conclude that the Southern Hemisphere will soon overtake the North in terms of multiwavelength imaging. However, we note that the South has more limited opportunities for spectroscopic follow-up and this weakness will persist during the LSST era. Some new perspectives are offered on this and other aspects of survey astronomy.
1 Introduction
Digital imaging sky surveys are one of the most powerful tools for the modern astronomer. Their scientific heritage includes the 20th Century Schmidt photographic surveys that surveyed the sky from Palomar, Siding Springs and La Silla to m in blue and red bands (e.g. Cannon et al, 1984, Woltjer et al 1984). It took some time for CCD imaging cameras to catch up in terms of field-of-view/area with the photographic surveys but by the beginning of the 21st Century they had. The success of the Sloan Digital Sky Survey (Stoughton et al., 2002) has been enormous and the new generation of sky surveys can only hope to emulate its success.
| Survey | Type | Epoch | Bands | Lim. | deg2 | N/S | Seeing |
|---|---|---|---|---|---|---|---|
| Mag. | (arcsec) | ||||||
| DENIS | NIR | 1997-03 | iJK | 20000 | South | 3 | |
| SDSS | Visible | 2000-05 | 14500 | North | 1.2 | ||
| CFHT RCS2 | Visible | 2002-09 | 830 | NS | 0.9 | ||
| CFHTLS Wide | Visible | 2003-12 | 157 | North | 0.9 | ||
| 2MASS | NIR | 1997-01 | All sky | N+S | 1.5 | ||
| UKIDSS | NIR | 2005-12 | 7500 | North | 0.9 | ||
| WISE | Mid-IR | 2010-12 | All Sky | NS | 6 | ||
| Pan-Starrs 3 | Visible | 2010-14 | 30000 | NS | 1.1 | ||
| SkyMapper | Visible | 2009- | 20000 | South | 2.5 | ||
| VST ATLAS | Visible | 2011- | 4700 | South | 0.9 | ||
| VST KiDS | Visible | 2011- | 1500 | South | 0.7 | ||
| VISTA VHS | NIR | 2010- | 18000 | South | 0.7 | ||
| VIKING | NIR | 2010- | 1500 | South | 0.9 | ||
| DES | Visible | 2013- | 5000 | South | 0.9 | ||
| DECaLS | Visible | 2015- | 9000 | North | 1.2 | ||
| HSC Wide | Visible | 2015- | 1400 | South | 0.7 |
Table 1 shows the list of extragalactic imaging surveys of area deg2 that have been done until now from their starting point around the year 2000. They start with the DENIS NIR Survey from a 1-m telescope covering the S Hemisphere to and SDSS covering the N Hemisphere in the optical to from a 2.5-m telescope at Apache Point, New Mexico. The CFHT MegaCAM instrument also featured powerfully in the early digital surveys with its 1deg field and high UV sensitivity producing the Red Cluster Sequence surveys to over 900deg2 and then the CFHT Legacy Survey with its Wide component extending over some 157deg2. NIR detectors were increasing in size, leading then to the 2MASS survey in JHK over the full sky and UKIDSS much deeper in YJHK but with only partial coverage of the northern sky. Also completed by 2012 was the WISE survey in the 3.6, 4.5 12 and 22 micron bands. This was, of course, a satellite survey but as we shall see this meshes in with the ground-based optical surveys that it is hard to leave out of this list. This leads to the more modern surveys that we are going to feature specifically in this review. These include PanSTARRS 3 survey which covers 30000deg2 in predominantly in the North but also reaches as far South as Dec=-30 in the Southern Hemisphere. Then there are the ESO Southern Hemisphere surveys using the VLT Survey Telescope in the optical for KiDS and ATLAS and using the VISTA telescope in the NIR for the VISTA Hemisphere Survey (VHS) and for VIKING. Finally there is the DES and DECaLS surveys imaging in respectively to over 5000deg2 in the Southern Hemisphere and to in the Southern half of the SDSS footprint.
Currently it is becoming apparent that the greatest digital imaging strides are currently being taken in the Southern Hemisphere due to the availability of VISTA, DECam and VST OmegaCam. The focus of this review is to assess the complementarity of the Southern optical and NIR imaging surveys. The case that will be made is that DES is a powerful optical survey but can still be matched by combinations of the other surveys such as KiDS, Pan-STARRS and ATLAS. Also DES may be less well matched than the others in terms of the depth of its accompanying NIR surveys.
2 ESO Surveys
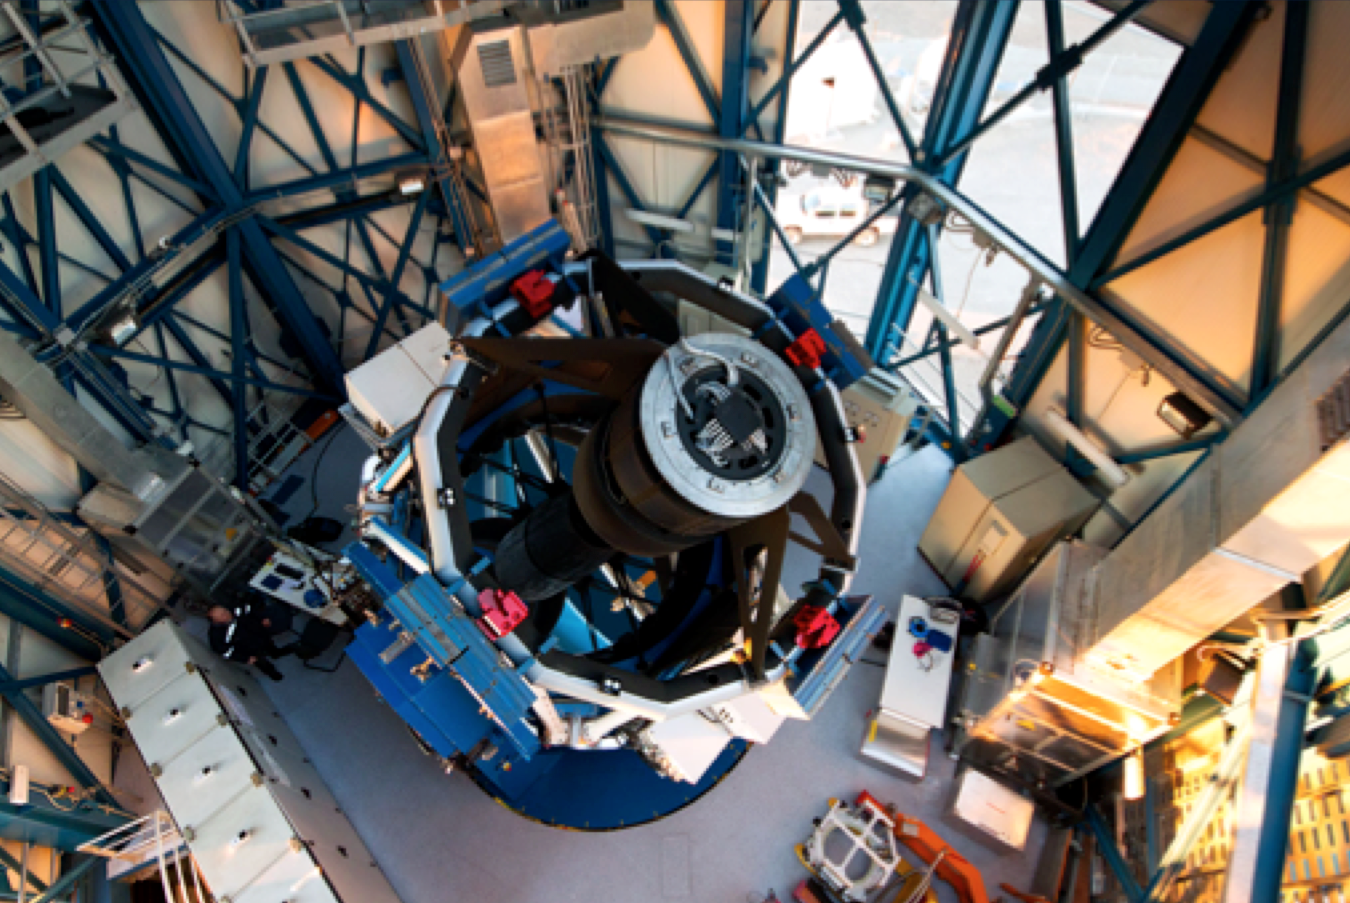
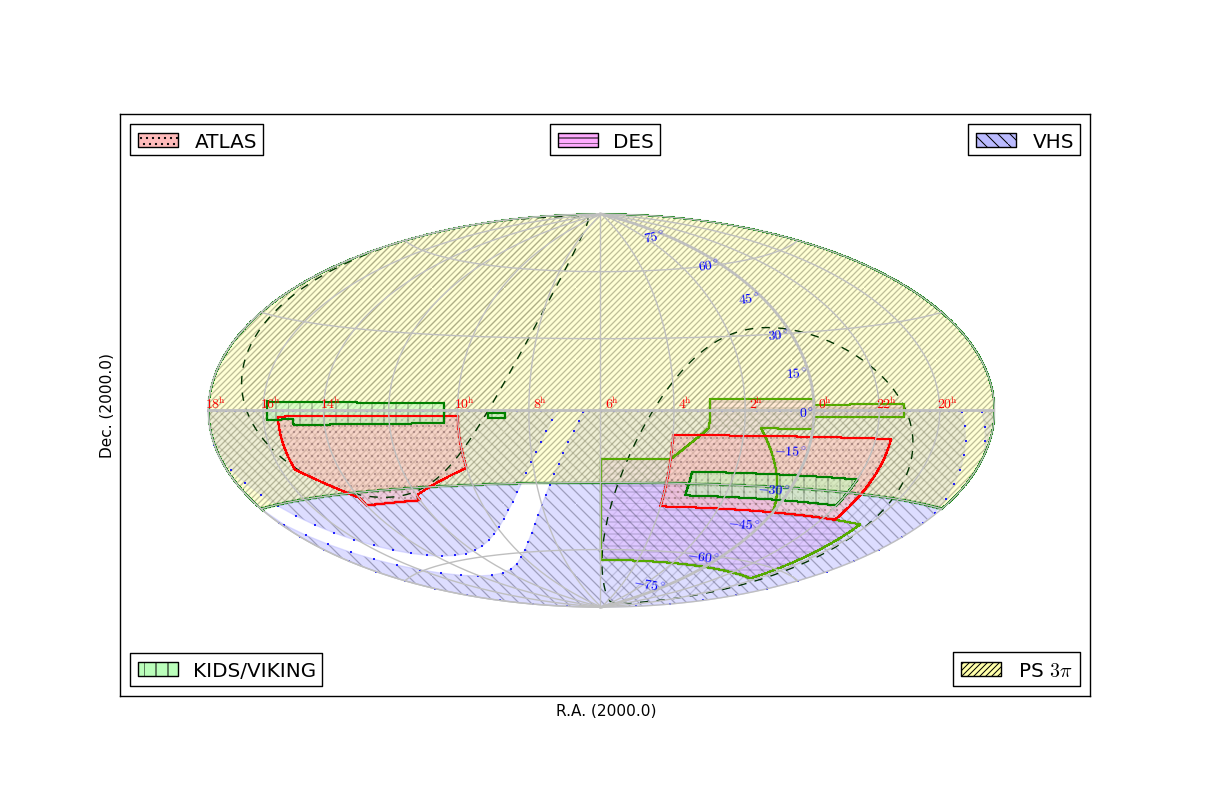
Here we call the ‘ESO surveys’ the surveys by the ESO VST (Schipani et al 2012, see Fig. 1) and VISTA (Sutherland et al 2015) telescopes. We shall discuss the ATLAS (Shanks et al 2013, 2015) and KiDS (de Jong et al 2013) surveys from VST and the VHS (McMahon et al 2013) and VIKING (Sutherland et al 2012) surveys from VISTA. We shall discuss the VST ATLAS survey at greater length since there is no dedicated ATLAS article elsewhere in this volume. The sky footprints of the ESO ATLAS, KiDS, VHS, VIKING and PanSTARRS , DES and PanSTARRS surveys are shown in Fig. 2.
2.1 VST ATLAS
The ESO VST ATLAS targets 4700deg2 of the Southern Hemisphere in the bands to similar depths to the SDSS survey in the North. Shanks et al (2015) report that the throughput for VST OmegaCam is usually similar to SDSS but the seeing for VST in all bands is significantly better than for SDSS. For example, ATLAS achieves a median of FWHM in the band and in the band; the equivalent numbers for SDSS are and so in general a 50% improvement. This means there is generally an advantage for ATLAS over SDSS in terms of the magnitude limit for stellar sources amounting to mag in and rising to mag in and mag in where the throughput is also 50% higher than for SDSS. For resolved galaxies the ATLAS and SDSS magnitude limits are more comparable. All of the ATLAS bands have longer exposure times than the of SDSS to accommodate the smaller pixel size of OmegaCam to account for the increased readout noise and for the use of grey time in the bands. There is also an ongoing ‘Chilean ATLAS -band extension’ (PI L. Infante) where the ATLAS -band exposure time is doubled to 4 minutes.

The original science aims of ATLAS were first to exploit the -band coverage of ATLAS to make UVX quasar searches. Now one such survey has already been done, the 2QDES pilot survey, comprising quasar redshifts to (Chehade et al 2015 in prep.). We found that selection still reaches deeper than cuts that use the WISE W1, W2, such as , although these appear to show less contamination by stars (see Fig. 3). Another top priority for VST ATLAS is to search for the Integrated Sachs-Wolfe effect in the Southern Hemisphere by cross-correlating the positions of Luminous Red Galaxies (LRGs) and microwave background fluctuations. Here again we shall be selecting LRGs using traditional colour cuts complemented by WISE magnitudes at higher redshifts. Photo-z catalogues for ATLAS are being prepared and we find the best results using ANNz neural networks that incorporate both ATLAS and WISE , magnitudes.
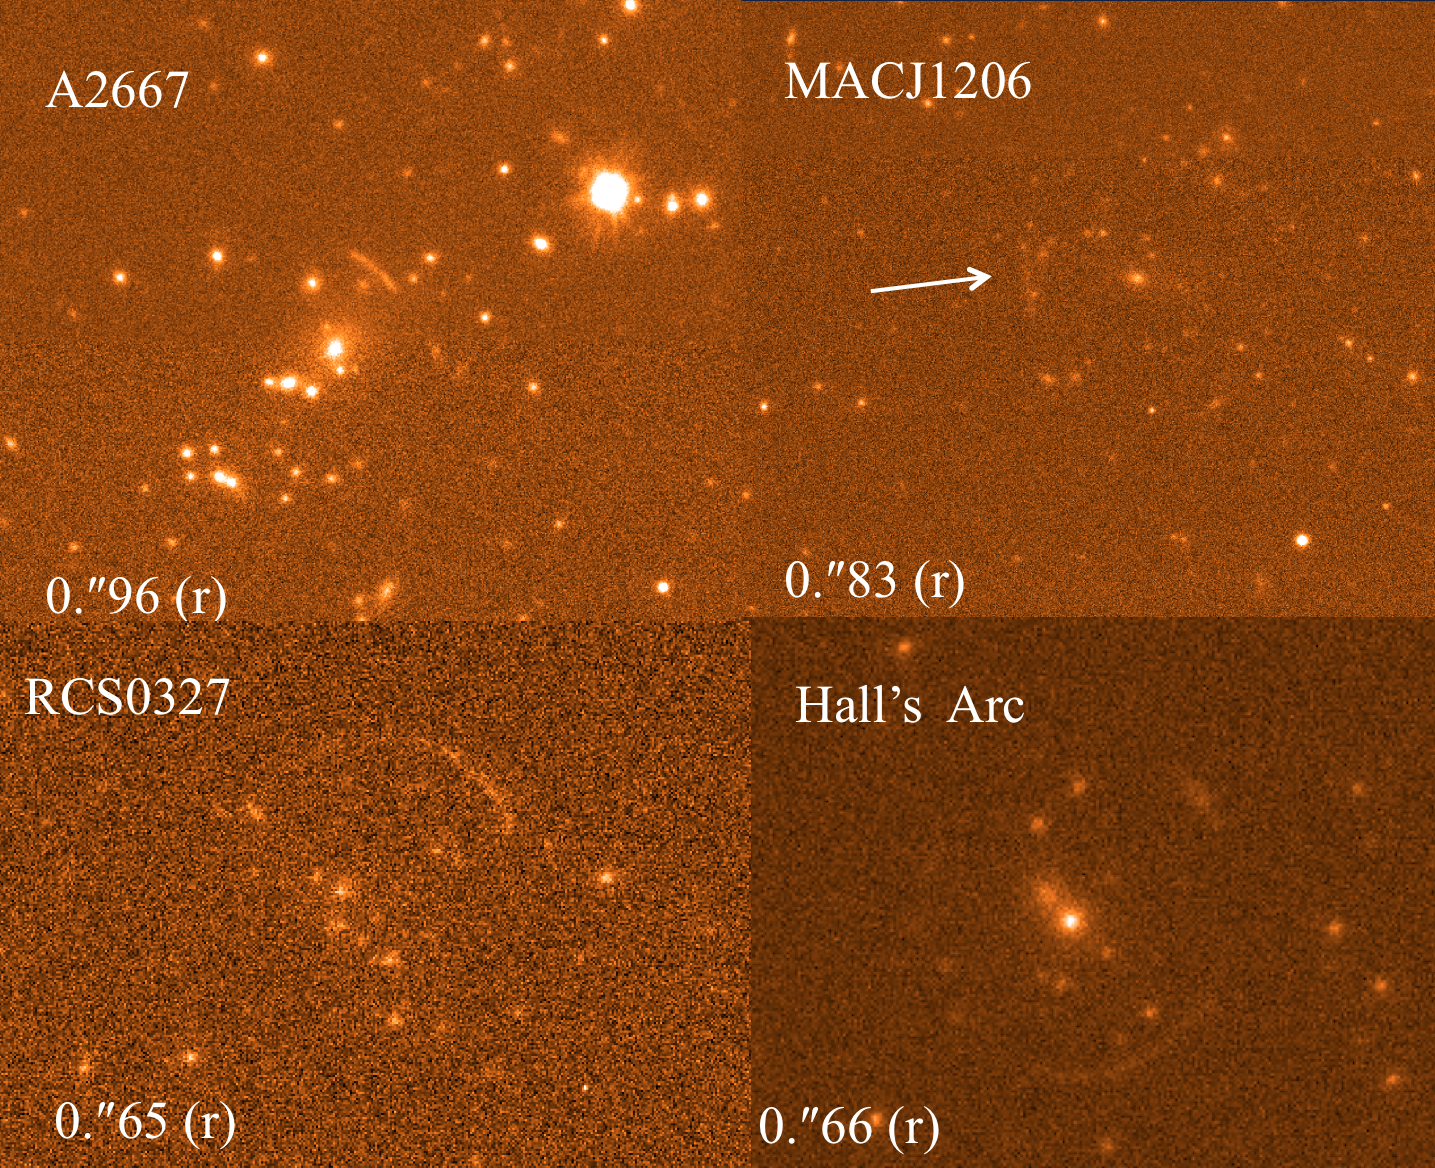
The improved seeing also opens up new avenues for ATLAS projects in terms of both finding multiple quasar lenses and lensed arcs in galaxy clusters (see Fig. 4). Most ATLAS tiles have at least one band with significantly sub-arcsecond seeing. P.L. Schechter has therefore initiated a programme to find quadruple lenses in ATLAS images. Meanwhile Carnall et al (2015) have combined ATLAS and WISE photometry to confirm spectroscopically confirm 3 bright quasars, the first from ATLAS.
2.2 VST KiDS
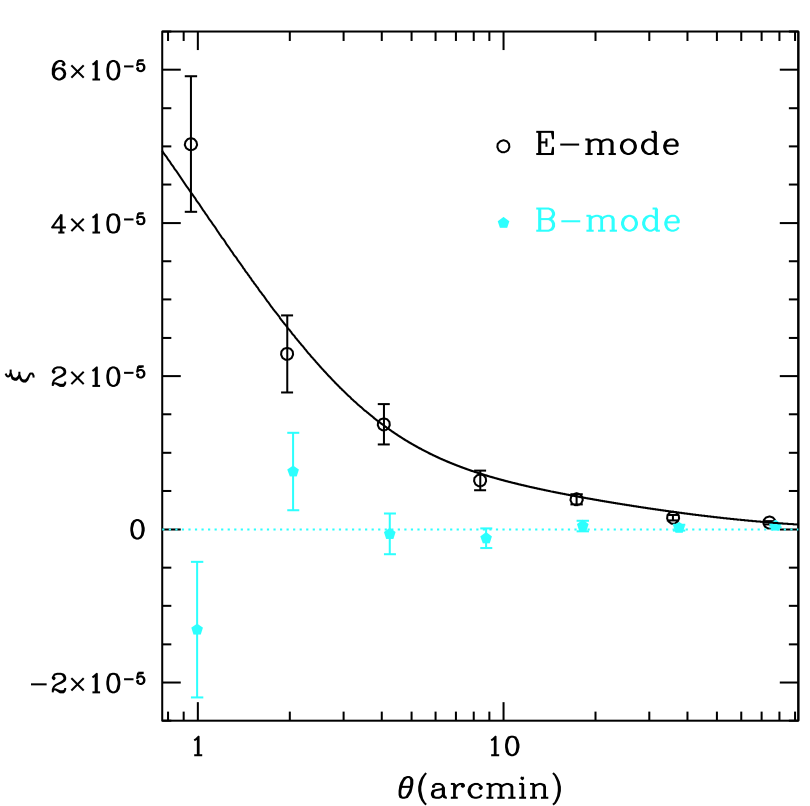
KiDS (PI K Kuijken) is the premier VST survey, aimed at covering 1500deg2 in split between an NGC field at the equator and an SGC field at Dec=-30. These field comprise the original areas of the 2dF Galaxy Redshift Survey. The survey aims to reach with the best seeing on the VST reserved for the KiDS band where the median seeing is currently . The main purpose is to do weak lensing tomography and, with the remarkably distortion-free field of VST and 9-band photometry (including VISTA VIKING ) for photo-z, KiDS seems ideally positioned. KiDS DR2 released 172deg2 with another year’s worth of data already taken (de Jong et al. 2013) The DR2 coverage means KiDS’ area is already larger than the CFHTLS Wide survey, the previously largest lensing survey. The main problem for KIDS is that currently it is estimated to take until 2020 to complete. The band is already reasonably complete but are further behind. Fig. 5 shows weak lensing results from KiDS that measure the mass correlation function at (K. Kuijken, priv. comm.).
2.3 VISTA VHS
VISTA VHS (McMahon et al 2013) is the sister survey to VST ATLAS and also to DES. VISTA is a 4.1-m telescope sited near Cerro Paranal and dedicated to NIR imaging. Its 1.5deg2 tile ‘images’ are composed of 6 individual pawprints. VHS-ATLAS covers 5000deg2 mainly overlapping the VST ATLAS survey with exposures of (120s), (60s), (60s). VHS-DES covers 4500deg2 (excluding the 500deg2 of the SGC VIKING footprint) and complements the DES survey with exposures of (120s) and (120s). At lower latitudes there is also VHS-Galactic Plane survey covering another 8200deg2 with exposures of J(60s), K(60s). Thus in the ATLAS area VHS reaches (Vega), similar to the UKIDSS limit, and in the DES area it reaches . Here again VHS takes the poorer seeing VISTA time with the better seeing going to VIKING and other projects such as UltraVISTA. One of the prime aims of VHS is to look for high redshift quasars and therefore that is why there is so much emphasis on , . (In the DES area is done by DECam). Other aims are to detect the faintest brown dwarf stars and to provide NIR magnitudes to help measure photo-z for the ATLAS and DES surveys. Currently VHS ATLAS is % complete and VHS-DES is % complete.
2.4 VISTA VIKING
The VIKING survey (Sutherland et al 2012) aims to cover the same 1500deg2 area as KiDS in to a 5 detection limit of (Vega). VIKING includes the 2dF and GAMA galaxy redshift survey areas, the Herschel ATLAS, WALLABY-ASKAP HI survey and the 2dFLens survey. VIKING is now back on the sky again after a gap of about a year due to management changes. VIKING has now covered deg2 with at least one of or visits. This is a good match to the KiDS coverage in the -band.
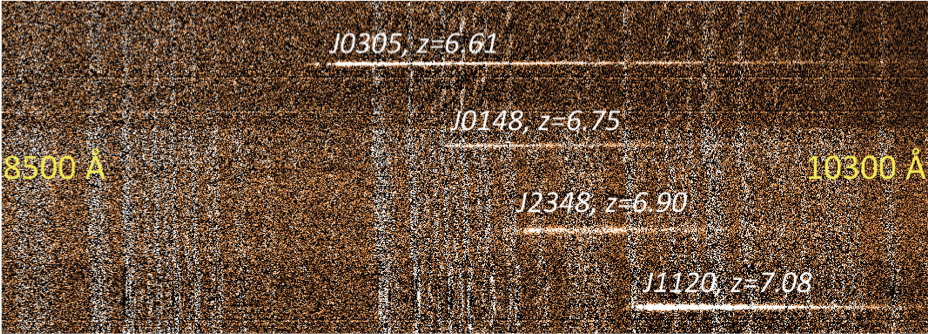
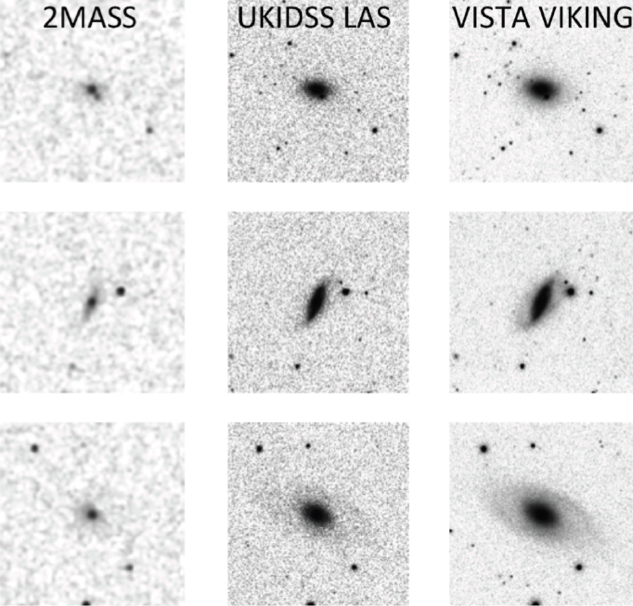
Scientifically, the survey has already found several high redshift quasars (Venemans et al 2013 - see Fig. 6). At the opposite extreme of redshifts, the additional depth of VIKING over UKIDSS LAS or the VHS means that galaxy surface brightness sensitivity is significantly better (see Fig. 7). So for brighter galaxies at , NIR morphological parameters can be extracted and this is a primary focus of the GAMA survey.
The parameters extracted from the imaging (total stellar mass, bulge-to-disk radio, etc) are a key component of the GAMA project (PIs Driver and Hopkins) that covers a significant part of the VIKING/KiDS area with AAOmega to recover spectra for a much denser sampling than traditional redshift surveys. GAMA will be complemented with the WALLABY radio survey that will recover the 21cm HI emission of galaxies.
The largest Open Time Key Projects with Herschel was H-ATLAS (PI Eales). It covers deg2 of which deg2 is in the VIKING/KiDS footprint. The wide redshift range of the Herschel sources, accentuated by lensing, means that NIR imaging is crucial to the identification of these sources.
The VIKING/KiDS NGC area will also be covered by the HyperSuprimeCam (Miyazaki et al 2012) Wide survey area (2015-20) which will image to 26.5, 26.1, 25.9, 25.1 and 24.4, . mag fainter than the KiDS limits and mag fainter than the DES 5 Year limits (see Table 2). In total HSC Wide will cover 1400deg2 at Decdeg.
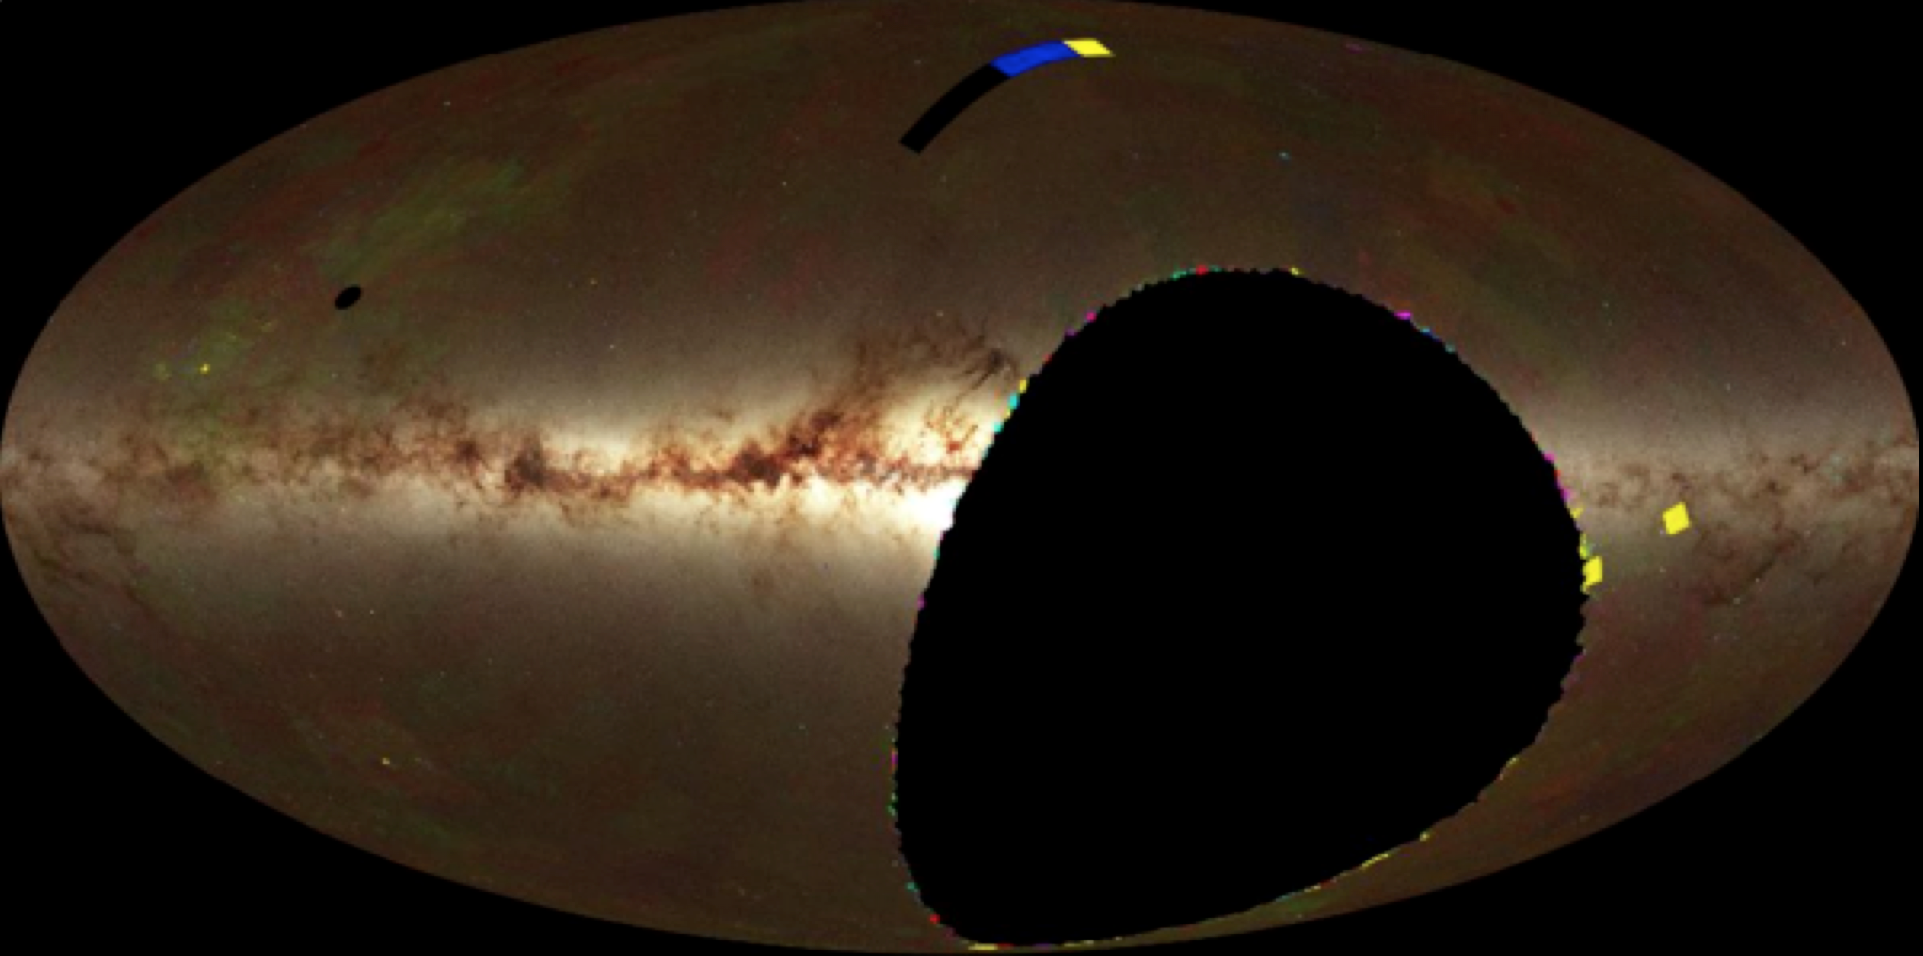
3 Pan-STARRS Survey
The Pan-STARRS survey (Tonry et al. 2012) is an ambitious survey aimed at covering 3/4 of the sky in the optical-NIR bands (see Fig. 8). It uses a 1.8-m, telescope at Haleakala Observatory on Maui, Hawaii with an deg2 field-of-view. The survey was done with a cadence of 6 epochs with each epoch consisting of a pair of exposures taken mins apart. Individual exposure times vary between 30-45s skewed towards the bluer bands. The detectors are OTA arrays which have high red sensitivity and pixel widths of . Seeing is typically . It is interesting to compare light grasp throughput with VST ATLAS. ATLAS has a bigger mirror area and better throughput in . We estimate that PS1111PS1 is the first of 4 planned Pan-STARRS telescopes. has higher throughput in the band and less throughput in the band. We make a comparison of ATLAS exposure times, median seeing and magnitude limits with Pan-STARRS (and KiDS and DES) in Table 2). The total exposure time of PS1 is longer in and longer in . However, the seeing is 20% worse in all bands and sky brightnesses are approximately the same. Point source magnitude limits should therefore be similar in , mag fainter in and mag fainter in (see Table 2). Similar conclusions apply to for the SDSS-PanSTARRS comparison but the PanSTARRS advantage over SDSS in is now mag for stars (Shanks et al. 2015).
| Survey/Band | ||||
|---|---|---|---|---|
| ATLAS Exposure | s | s | s | s |
| Mean PS1 Exposure | s | s | s | s |
| DES Y1 Exposure | s | s | s | s |
| KiDS Exposure | s | s | s | s |
| DES Y5 Exposure | s | s | s | s |
| ATLAS Seeing | ||||
| PS1 Seeing | ||||
| KiDS Seeing | ||||
| DES Seeing | ||||
| ATLAS Mag Lim | ||||
| PS1 Mag Lim | ||||
| DES Y1 Mag Lim | ||||
| KiDS Mag Lim | () | |||
| DES Y5 Mag Lim |
4 Dark Energy Survey
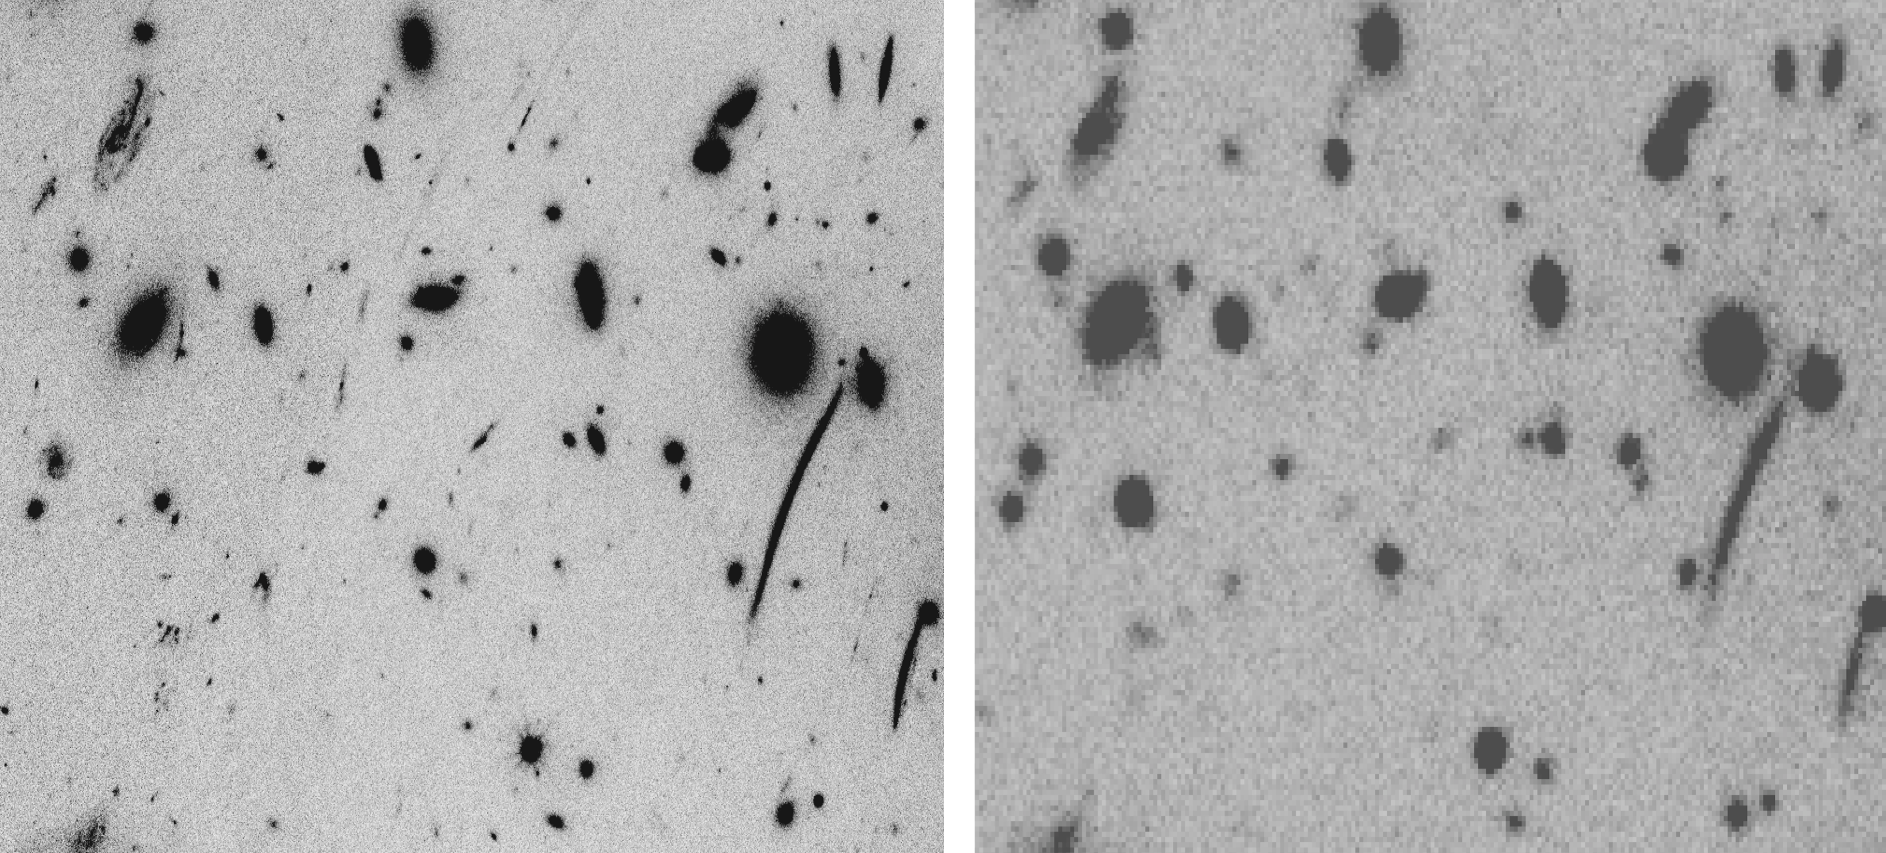
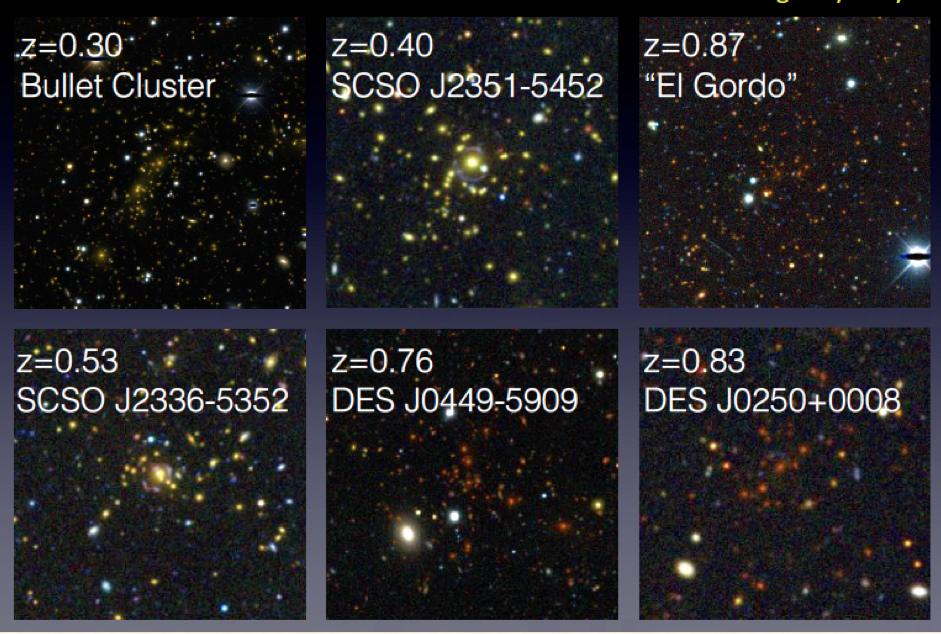
The Dark Energy Survey (DES) is aimed at KiDS depths over ATLAS areas. It uses the Dark Energy Camera (Flaugher et al 2015) installed at the prime focus of the CTIO 4-m Blanco Telescope. It is aimed at covering 5000deg2 over a period of 5 years starting in August 2013. It aims to do a pass with s exposures in for the first 2 years increasing this to s by the end of Year 5. DECam has high throughput especially in and due to its deep depletion CCDs. The DECam pixel size is . The quality of its imaging can be seen in Fig. 9 which compares DES and HST images of gravitationally lensed arcs in a galaxy cluster.
The aims of DES are mostly cosmological to determine the dark energy equation of state by a variety of probes including cluster counts, weak lensing and large-scale structure. They are also covering 30deg2 in time domain mode to search for supernovae. But it is the wide field aspect of DES that is our focus here. The cluster counts include cross-correlation with the South Pole Telescope CMB SZ measurements (see Fig. 10). Much will be learned about the astrophysics of cluster gas as well as cosmology. The large-scale structure aims include galaxy and quasar power spectra at the largest scales partly to constrain neutrino masses. Here there will be a need for accurate photo-z but these will only be available out to given the lack of deeper NIR photometry beyond . Clearly the VHS photometry will provide opportunities for very high redshift quasar z-dropouts at but there may be a future need for VISTA to provide imaging to VIKING depths to fully exploit DES over the full survey area.
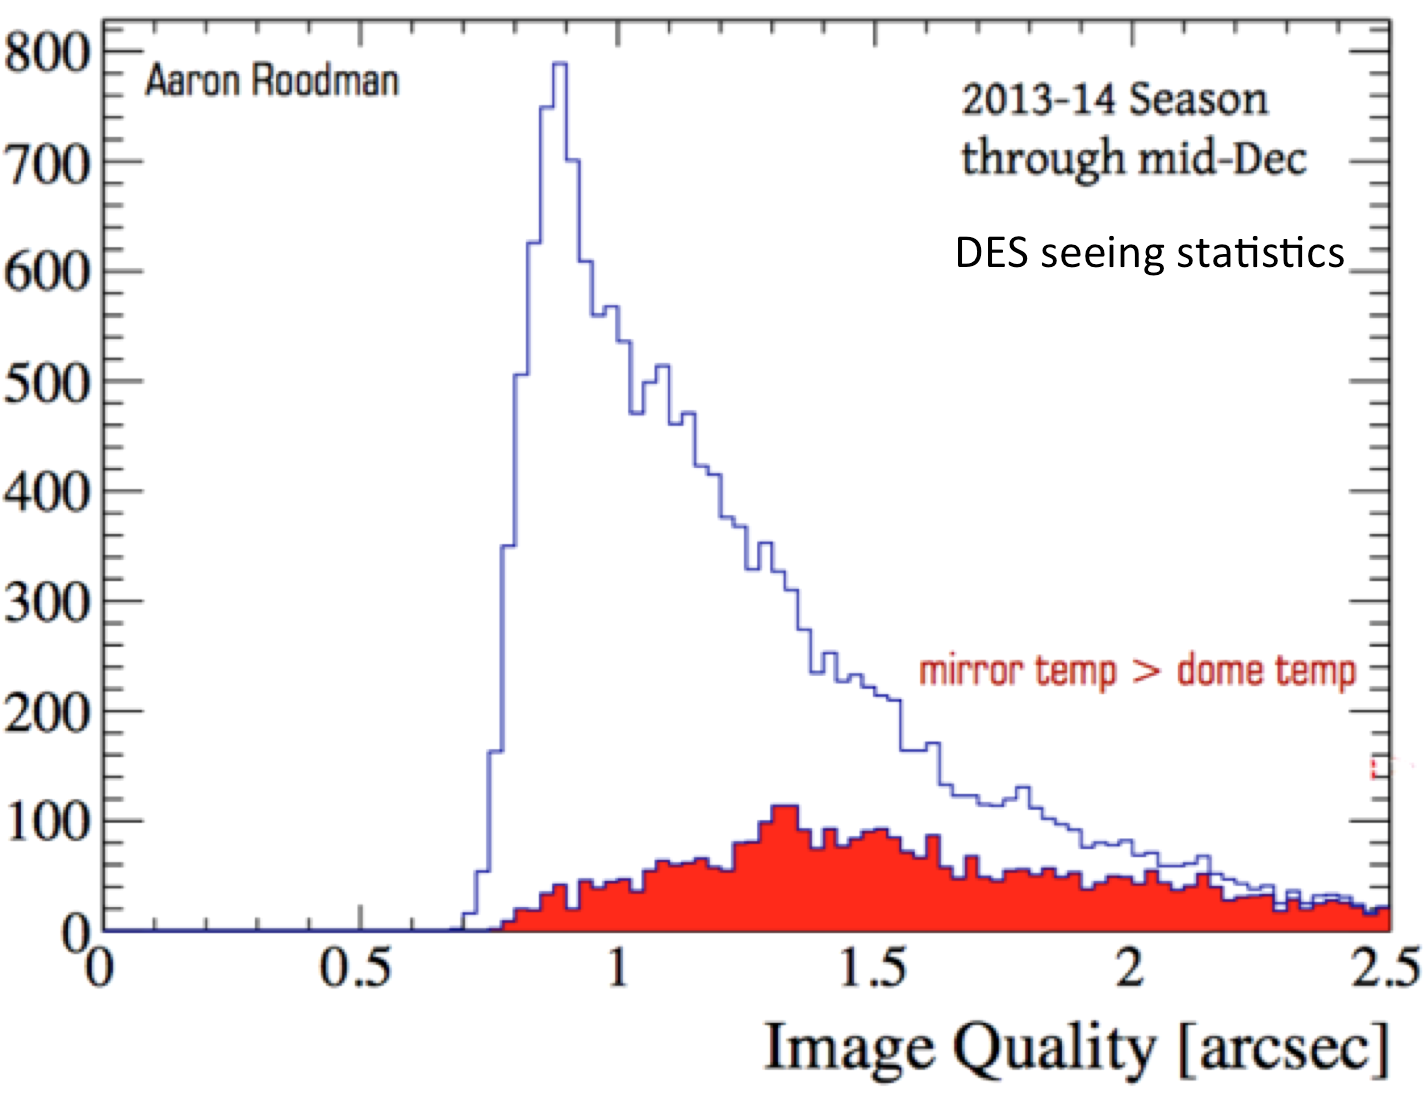
For DES, the main target must be weak-lensing shear. DES certainly provides enough -band exposure to reach at 5 after 5 years. The other two necessary components are the consistency of the PSF over the full focal plane and the delivered seeing. Fig. 11 shows that it is possible for DES to provide median seeing in the band, close to its specification for weak lensing. However, this is mainly produced by sub-selecting the best seeing for . There also seems to be a lower limit to DECam seeing of in the band. On the issue of the uniformity of the PSF there is less information available, although weak lensing maps have already been produced using DES data.
5 DES versus other surveys
Clearly other surveys are now playing David to the Goliath survey that is DES. In terms of DES versus ATLAS, DES reaches further South on the SGC side of the sky than ATLAS whereas ATLAS also covers the NGC side. The 5th band for ATLAS is the band to (including Chilean ATLAS extension) whereas the 5th band for DES is with the limit in Year 5. As can be seen from Table 2 ATLAS median seeing is slightly better in all bands than DES. Pan-STARRs also has its 5th band in rather than , reaching at . Again its seeing is worse than both DES and ATLAS. KIDS is most competitive with DES in the band where KiDS’ seeing is significantly better (see Fig. 12). DES Y5 magnitude limit is 0.2mag fainter. In the other bands, DES Y5 will be significantly (0.5-0.8mag) fainter than the KiDS limits. VIKING, however, is well matched to KiDS and VHS is not so well matched to DES except for the purpose of high redshift quasar searches. For many other purposes VHS is a better match to ATLAS. The same could be said for WISE - it is a better match to SDSS depth surveys such as ATLAS than it is to KiDS or DES.
SDSS has also been a great success because of its access to Luminous Red Galaxies extending out to . This can now be extended to by incorporating WISE W1 and W2 data into ATLAS. By the 4000A break has redshifted out of the optical bands and LRGs are likely too faint even for UKIDSS LAS and VHS. Emission line galaxies out to can be selected at ATLAS depth (Bielby et al 2012) but it is undeniable that deeper surveys such as DES can in principle probe out to . But the lack of matched NIR data will make it difficult to measure photo-z past the VHS limit. However, the lack of a deep band makes it hard to look for dropouts. The dropouts are a possibility but even the DES 5-year limits will make it tough to detect these.
The basic advantage of SDSS depth in the optical is that the galaxy number counts turn over within the SDSS range and most of the fainter galaxies are also intrinsically faint, so the majority of galaxies are probing the same volume as those at brighter limits. Of course, the brightest of the more distant galaxies are there but until dropouts become available at , these will remain expensive to identify even for a survey like DES. The effective volume of the lower redshift is optimised where the galaxies reach the knee in the luminosity function at M∗. At this point correlation functions and power spectra produce their smallest errors in the most cost-effective exposure time.
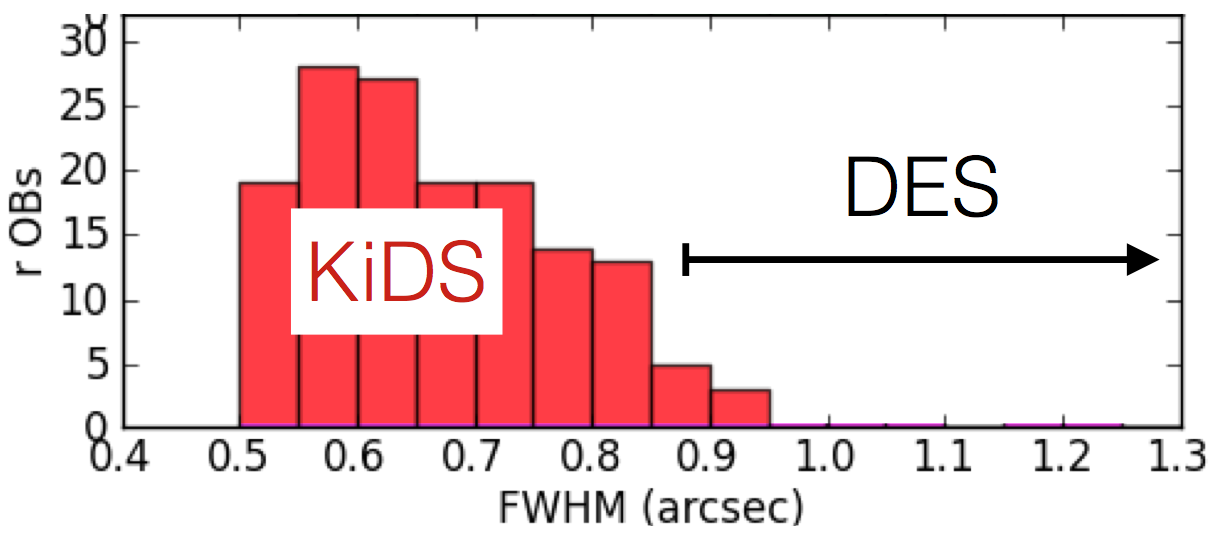
The great overpowering advantage that the depth of DES allows is of course for cosmological weak-lensing studies. The image quality is and this is judged adequate for this purpose. The main competition here is from KiDS where the median seeing is a 25% improvement on DES. The KiDS magnitude limit in is 24.8mag which is lies between the DES 1-2 year and 5 year limits. Of course, weak-lensing demands uniform PSF’s across the field-of-view and this has already been demonstrated for KiDS and this is still under scrutiny for DES. Speed of survey is also slower for KiDS than DES given its bigger field and bigger mirror area. The KiDS SGC area is half covered by DES and so this should make for interesting lensing comparisons with DES. In this area at least, DES will ultimately be able to incorporate the VIKING data for photo-z.
6 Conclusions
6.1 No access to DES? Stay calm and don’t panic!
So what can be done if you are at an institute with no access to DES? The message is to stay calm - in the Southern sky at least the ESO Public Surveys can help. Much of the low lying fruit can be accessed with SDSS depth surveys such as ATLAS and then there is KiDS, VIKING and VHS too. Over wider areas the PanSTARRS survey will soon become available and its deg2 of Medium Deep Survey fields will also be available. For ATLAS there is the pleasing match of the WISE Mid-IR surveys to its depth, now being exploited for LRG and high-z quasar studies. The prime science area for DES is weak lensing but even here KiDS can compete with its combination of similar -band depth and % better seeing.
In the future, the 8-m LSST (Tyson, 2005) will reach an AB depth of 26.1-27.5 in over the whole Southern sky. For synoptic surveys, LSST will have an unparalleled reach but meanwhile there is much work that can be done now in PS1 MDS and the overlap areas between PS1 , ATLAS, SDSS, KiDS and DES, not to mention VHS and VIKING.
6.2 But no access to spectroscopic follow-up?
For LSST photometric redshifts are hugely important. Indeed, the LSST ‘black book’ barely makes mention of spectroscopic follow-up. Generally, the Southern sky looks weakest compared to the Northern Hemisphere in terms of spectroscopic follow-up. There is AAT 2dF HERMES and there will be MOONS but the latter has a small field similar to Gemini FMOS but with more fibres (). VISTA 4MOST with fibres over 3deg2 should be excellent for ATLAS follow-up but perhaps needs more fibre numbers to match the high sky densities of galaxies and stars available from the deeper surveys. There have been more ambitious designs made such as NG2dF and VXMS to make multislit spectrographs to cover deg2 but these have generally fallen foul of the current need for high resolution () spectroscopy for Galactic Archaeology (coupled to GAIA astrometry), which is done better with fibres. But there remains possibilities at 2dF and at DECam to build extreme multislit spectrographs where galaxy redshifts can be measured simultaneously. Combining photo-z information from the deep imaging surveys with low S/N spectroscopic redshifts, reduce the redshift error from kms-1 to kms-1 is also a possibility that is worth investigating. The main aim of these surveys would be to measure redshift-space distortions combined with lensing tomography.
There may be a contribution to spectroscopic surveys that VST can make once its current imaging surveys are completed. Even extreme multislit spectrographs may miss interesting objects because of the need to target previously imaged galaxies and stars to manufacture the slit mask. However slitless spectroscopy could offer a potentially exciting route for a telescope like VST. An objective prism is infeasible because of the large mirror diameter. Instead, it has been suggested that a grens for VST that might be easily accommodated in the filter wheel could offer low dispersion spectroscopy over the full 1 degree field (R. Content, 2014, priv. comm.). There would be a price to pay in terms of sky noise but previous experience at UKST and CFHT suggest that 30 min exposures could produce good emission line spectra for mag quasars in a typical VST field. It may also be possible simultaneously to measure redshifts for at least several hundred strong emission- and absorption-line galaxies. But for slitless the main advantage is that we get to observe ALL the spectra with no need for pre-selection for fibres or masks, with immediate advantage for future searches for gravitational wave source counterparts etc.
6.3 Ground-based image competition for EUCLID?
Given the excellent seeing that VST has experienced, for the final perspective, it may also be worth thinking about improving its optics to see if even better seeing could be accessed. It might not take too much of an improvement to make VST competitive with EUCLID, for example, at least over small areas of a few hundred square degrees with ‘sub-selected’ ground-based seeing. Even if this proved impossible with VST, it would make a good proving ground for a more sophisticated telescope of similar size to see what are the limits of what can be achieved by a ground-based telescope on an excellent site such as Paranal. Recall that this goal of using active and adaptive optics over a wide field was already the ambitious original aim of the PanSTARRS project. Maybe this idea came too early for the technology and perhaps its time will come again?
Acknowledgements.
I should like to thank N. Metcalfe and B. Chehade (Durham Univ.), M.J.Irwin and E. Gonzalez-Solares (CASU Cambridge) and R.G. Mann, M.A. Read and colleagues from WFAU, Edinburgh for all their help with the VST ATLAS survey. We are also deeply grateful to the OmegaCAM and VST teams and the ESO VST observers whose dedication makes the ESO VST surveys possible. I should also like to thank K Kuijken (Leiden), A.C. Edge (Durham), O. Lahav (UCL) and S. Smartt (QUB) for allowing me to present their images illustrating highlights from the KiDS, VIKING, DES and PanSTARRS surveys. Finally I should like to thank the Scientific Organising Committee for inviting me to give this review at the Universe of Digital Sky Surveys meeting in honour of the 70th birthday of Prof. Massimo Capaccioli.References
- (1) Bielby, R., Shanks, T., Sawangwit, U., et al. Photometric selection of emission-line galaxies, clustering analysis and a search for the integrated Sachs-Wolfe effect, MNRAS, 403, 1261 (2010)
- (2) Cannon, R. D. Sky Surveys with the UK 1.2-metre Schmidt Telescope, IAU Colloq. 78: Astronomy with Schmidt-Type Telescopes, 110, 25 (1984), Ed. M. Capaccioli. Dordrecht:Reidel.
- (3) Carnall, A. C., Shanks, T., Chehade, B., et al. Two bright quasars from VST ATLAS and a new method of optical plus mid-infrared colour selection, MNRAS, 451, L16 (2015)
- (4) de Jong, J. T. A., Kuijken, K., Applegate, D., et al. The Kilo-Degree Survey, The Messenger, 154, 44 (2013)
- (5) Flaugher, B., Diehl, H. T., Honscheid, K., et al. The Dark Energy Camera, arXiv:1504.02900 (2015)
- (6) McMahon, R. G., Banerji, M., Gonzalez, E., et al. First Scientific Results from the VISTA Hemisphere Survey (VHS), The Messenger, 154, 35 (2013)
- (7) Miyazaki, S., Komiyama, Y., Nakaya, H., et al. Hyper Suprime-Cam, Proc. SPIE (Amsterdam), 8446, 84460Z (2012)
- (8) Schipani, P., Capaccioli, M., Arcidiacono, C., et al. VST: from commissioning to science, Proc. SPIE (Amsterdam), 8444, 84441C (2012)
- (9) Shanks, T., Belokurov, V., Chehade, B., et al. VST ATLAS First Science Results, The Messenger, 154, 38 (2013) (ESO)
- (10) Shanks, T., Metcalfe, N., Chehade, B., et al. The VLT Survey Telescope ATLAS, arXiv:1502.05432 (2015)
- (11) Stoughton, C., Lupton, R. H., Bernardi, M., et al. Sloan Digital Sky Survey: Early Data Release, Astr.J, 123, 485 (2002)
- (12) Sutherland, W. VIKING: the VISTA Kilo-degree INfrared Galaxy survey, Science from the Next Generation Imaging and Spectroscopic Surveys, 40 (2012)
- (13) Sutherland, W., Emerson, J., Dalton, G., et al. The Visible and Infrared Survey Telescope for Astronomy (VISTA): Design, technical overview, and performance, Astr. Astrophys., 575, A25 (2015)
- (14) Tonry, J. L., Stubbs, C. W., Lykke, K. R., et al. The Pan-STARRS1 Photometric System, ApJ, 750, 99 (2012)
- (15) Tyson, A. LSST and Dark Energy, Observing Dark Energy, ASP Conference Series 339, 95 (2005) San Francisco:ASP
- (16) Venemans, B. P., Findlay, J. R., Sutherland, W. J., et al. Discovery of Three z 6.5 Quasars in the VISTA Kilo-Degree Infrared Galaxy (VIKING) Survey, ApJ, 779, 24 (2013)
- (17) Woltjer, L. Schmidt Telescopes as Discovery Instruments, IAU Colloq. 78: Astronomy with Schmidt-Type Telescopes, 110, 3 (1984) Ed. M. Capaccioli. Dordrecht:Reidel