Atomistic details of oxide surfaces and surface oxidation: the example of copper and its oxides
Abstract
The oxidation and corrosion of metals are fundamental problems in materials science and technology that have been studied using a large variety of experimental and computational techniques. Here we review some of the recent studies that have led to significant advances in our atomic-level understanding of copper oxide, one of the most studied and better understood metal oxides. We show that a good atomistic understanding of the physical characteristics of cuprous (Cu2O) and cupric (CuO) oxide and of some key processes of their formation has been obtained. Indeed, the growth of the oxide has been proven to be epitaxial with the surface and to proceed, in most cases, through the formation of oxide nano-islands which, with continuous oxygen exposure, grow and eventually coalesce. We also show how electronic structure calculations have become increasingly useful in helping to characterise the structures and energetics of various Cu oxide surfaces. However a number of challenges remain. For example, it is not clear under which conditions the oxidation of copper in air at room temperature (known as native oxidation) leads to the formation of a cuprous oxide film only, or also of a cupric overlayer. Moreover, the atomistic details of the nucleation of the oxide islands are still unknown. We close our review with a perspective on future work and discuss how recent advances in experimental techniques, bringing greater temporal and spatial resolution, along with improvements in the accuracy, realism and timescales achievable with computational approaches make it possible for these questions to be answered in the near future.
1 Introduction
Copper is a material which has accompanied human pre-history and history, and it is still highly relevant today. Cold working of copper has been performed for at least years and smelting of copper ore for around years 1. Its use as construction materials, e.g. in piping, can be dated back to ancient Egypt, and its importance in this field has not diminished nowadays. In the modern world it has acquired further uses, for example in electrical systems and electronic devices.
Within this long history, the properties of copper have been extensively studied and exploited, however much is still unknown about this important metal. In particular, the oxidation and corrosion of copper, which impacts its performance in industrial and technological applications, is still not completely understood.
Copper is found to readily oxidise at room temperature 2, 3, 4, and the presence of an oxide layer, however thin, can compromise its uses in technology. As an example, copper could be an environmentally friendly and low-cost substitute for the (currently used) tin-lead or (promising) gold- and silver-based solder alloys in electronic packaging, if there was a way to prevent its oxidation 5. Moreover, copper canisters are used for nuclear waste disposal, and understanding the oxidation and corrosion of copper in anaerobic conditions is thus really important 6. On the other hand, the existence of stable copper oxides at room temperature, with a eV band gap, makes them interesting for catalytic 7, gas sensing 8, optoelectronic and solar technologies 9, 10. Thus, there currently is a two-fold interest in understanding copper oxides: from the one hand, to mitigate against technological failure, on the other hand, to exploit their potential industrial applications.
Copper is considered a model system to understand the formation of metal oxides in general. The atomistic details of the oxidation process tend to be system-specific, with some metals showing uniform oxide growth (e.g. Ref. 11), other complex temperature-dependent phenomena such as surface roughening (e.g. Ref. 12) and island formation (e.g. Ref. 13, 235). However, the copper oxidation process is one of the most studied with a large number of experimental and computational methods, and one of the better understood. Therefore, a detailed understanding of copper oxidation, of the techniques used to study it and of the challenges which are still open is invaluable when considering the oxidation process on any other system.
In this review, we discuss the status of knowledge of copper oxidation from the atomistic point of view, which we believe is of key importance if we want to learn how to prevent or manipulate copper oxidation. We cannot hope to provide a complete review of all the work done on this subject since the beginning of the last century 14, 15, 16. We are therefore only going to focus on recent surface science, spectroscopy and atomistic computational work which has been performed to understand the properties of copper oxides and their formation, and on the open challenges that can be addressed using these techniques.
First, a brief overview on the experimental and computational techniques which have been used for the study of oxide structures and oxidation kinetics is given (Sec. 2), in order to clarify some of the terminology used throughout the review. The structural and electronic characteristics of the bulk oxides and their surfaces are then presented (Sec. 3). We subsequently look at the interaction of clean copper surfaces with oxygen and the initial stages of controlled oxidation (Sec. 4) as well as long-term oxidation (Sec. 5). Finally, in Sec. 6, conclusions and perspectives are given.
We hope that it will be clear from the following that tremendous progress has been made in understanding the atomistic details of copper oxides and their formation under different conditions. However, equally important gaps in our understanding remain, especially in terms of the formation kinetics and the structure of the resulting oxide surfaces.
2 Experimental and computational techniques
An enormous number of experimental 17, 18, 19, 20 and computational techniques are available to investigate the physical and chemical characteristics of solids, surfaces and surface kinetic processes. Many of them have been used over the years to e.g., understand oxide structures, characterize oxide surfaces, understand the oxidation kinetics and investigate bulk properties of the oxides. For clarity, in this section we provide a brief introduction to the most relevant techniques which have been used on copper oxide and which are going to be mentioned in the following sections, with an emphasis on strengths and weaknesses of each approach.
In early studies of oxidation, thermogravimetric analysis (TGA), where changes in physical and chemical properties of materials are measured as a function of time, has been widely used to study the onset of oxidation by recording the mass gain of a sample under oxygen exposure. Whilst useful in providing a broad overview of the extent of oxidation, this technique is however unable to provide atom-resolved information.
Imaging techniques such as electron microscopy (EM), transmission electron microscopy (TEM) and their derivatives (e.g., high-resolution transmission electron microscopy (HRTEM) or field emission scanning electron microscopy (FESEM)) and surface-specific techniques such as scanning tunnelling microscopy (STM) can be applied to surfaces and provide atomistic level structural information. As we will see, they have been amply used to image adsorption of oxygen on the copper surface, surface reconstructions and initial oxide formation. The atomic composition and oxidation states of the atoms in a material can be obtained using spectroscopic techniques such as X-ray diffraction (XRD), Auger electron spectroscopy (AES), electron energy loss spectroscopy (EELS), low-energy electron diffraction (LEED), reflection high-energy electron diffraction (RHEED), X-ray photoelectron spectroscopy (XPS or ESCA) and X-ray absorption spectroscopy (XAS). The space- and time-resolution of these techniques has greatly improved since they were first used in this field (in the 1980s), as well as their range of applicability: for example, experiments at relatively high pressures can be performed nowadays salmeron_xas.
Growth of the oxide and its atomic composition has been extensively studied by means of ellipsometry. This technique measures changes in polarization as light interacts with an object and the resulting data are fitted with a ‘guess’ model for the material (e.g. a two-layer Cu2O/Cu model or a three-layer CuO/Cu2O/Cu one).
Computer simulations have also been widely applied to study the structural, optical and vibrational characteristics of copper oxides. When carrying out simulations of materials at the atomic scale, classical empirical potentials (force fields) or more sophisticated quantum (ab initio) approaches, such as density functional theory (DFT), can be used. Force fields are parametrised empirical potentials tuned to reproduce the interactions of the atoms in the system at hand. For certain problems force fields can provide a faithful description. However, the reliability and transferability of such calculations depends primarily on the extent and quality of the data used in their construction. Moreover, force fields cannot generally be applied to study chemical reactions. Current development in force fields are addressing these issues. Indeed, parametrisations obtained by fitting large data sets using e.g., neural network 22 and machine learning methods 23, to name just two, are improving accuracy and transferability. Moreover, bond order potentials (such as ReaxFF 24) and polarisable force fields 25 are making it possible to simulate chemical reactions. It is difficult to make general statements about the sizes of systems that can be explored with various methods. However, with many standard force fields it is now possible to examine systems with atoms on a routine basis. In addition, it is possible to explore the evolution of a system of this size, again on a routine basis, with an approach such as molecular dynamics for several hundreds of nanoseconds.
More accurate approaches are ab initio methods which aim to study the structure and properties of a material by seeking (approximate) solutions to quantum mechanical equations such as the many-electron, many-atom Schroedinger equation. These methods are more general and do not require system-specific parametrisations, however they are computationally more expensive. One of the most widely used methods to study the properties of bulk materials and surfaces is density functional theory (DFT) 27, 28, 29, 30. With DFT it is possible to make genuine predictions about structural properties of a material within a few percent of the experimental value. DFT also provides access to the electronic structure of the systems being considered and related spectroscopic properties. In DFT, the energy of the electronic system is determined from the electronic density by solving Schroedinger-like equations. Whilst exact in principle, in practice approximations have to be introduced since the functional form of the electron-electron interaction, called the exchange-correlation (XC) functional, is unknown. Many approximate XC functionals have been developed 31, the most common ones being the local density approximation (LDA) and the generalised gradient approximation (GGA). A number of deficiencies in DFT arise from these approximations and the choice of an appropriate XC functional is critical in order to obtain meaningful results. As an example, in strongly correlated systems like CuO (typically, where and orbitals are localised), the GGA and LDA functionals provide a poor description of the electronic and bulk crystal structure. Moreover, the band gap obtained using GGA or LDA in semiconductors or insulators is generally underestimated. In these cases it is possible to add simple but somewhat ad hoc corrections to the functionals (e.g. the Hubbard U 32, self-interaction correction SIC 33) or to use more sophisticated hybrid functionals (e.g. HSE06 34, PBE0 35) which incorporate some exact Hartree-Fock exchange. Compared to standard empirical potential methods, DFT is much more computationally demanding, and, on a routine basis, systems with only a few 100 atoms can be examined and the dynamics of such systems explored for only a few tens of picoseconds.
Other computational methods which have been used in copper oxide simulations are the GW method 36, used when optoelectronic properties are of interest, since it is more accurate at predicting band structures than standard DFT XC functionals. In addition there have been a number of Hartree-Fock 37 studies and calculations with simpler approaches, such as the linear combination of atomic orbitals (LCAO) and tight binding methods 38.
3 Oxide structures
We are going to introduce here the bulk and surface structures of the two main copper oxides, Cu2O and CuO. Knowledge of the physical properties of these materials, and especially of the surface structures, is relevant background when trying to understand the formation and growth of the copper oxide.
The two most common forms of the oxide (shown in Fig. 1) are cuprite (or cuprous oxide, Cu2O), the principal oxide at low temperatures and pressure, and tenorite (or cupric oxide, CuO), dominant at high temperatures and pressures 39. Another copper oxide structure, paramelaconite (Cu4O3), exists as a rare mineral found in hydrothermal deposits of copper. Cuprite has long been known to be the primary oxide for copper at ambient conditions and there is considerable interest in its application to catalysis, optoelectronics and gas sensing and therefore a large amount of work has been done to determine its physical and chemical characteristics. Tenorite has been studied less and still relatively little is understood about the structure of its surfaces, with only a handful of experimental and computational studies performed to that aim.
3.1 Cu2O bulk properties
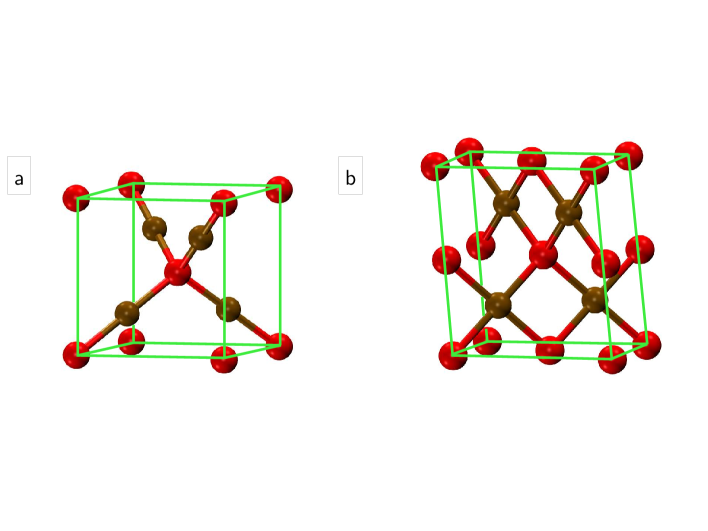
In cuprous oxide (Cu2O, see Fig. 1a), a cubic crystalline solid, copper has a Cu1+ oxidation state. It is a -type semiconductor with a direct band gap of eV and an optical gap of 2.62 eV 40, 10, 41. It is a promising material for a variety of industrial applications because of its band gap and because it shows negative thermal expansion 42, 43.
The properties of cuprous oxide have been extensively studied using empirical potentials 44, tight binding 45 and ab initio methods. Ab initio studies include the use of DFT methods (see Table 1), and good agreement with the experimental bulk structure (i.e. no more than discrepancy between the calculated and experimental value of the lattice constant) and vibrational modes 46 have been found. However, the band gap is underestimated with standard DFT XC functionals, yielding values between and eV 47, 48, 49 and grossly overestimated with Hartree-Fock methods at 9.7 eV 50. Corrections to DFT (e.g. DFT+U or the GW approximation applied to DFT-GGA) give rise to band gaps that are in better agreement with experiment 51, 52, 53, 54, 55, 56, as summarised in Table 1.
| Ref. | [Å] | [GPa] | Band gap [eV] | XC |
| Cortona 57 | 4.221 | 141 | – | LDA |
| Filippetti 53 | 4.23 | – | 0.55 | LDA |
| Gordienko 58 | 4.2696 | – | 2.87 | LDA |
| Nie 59 | 4.216 | – | 0.52 | LDA |
| Heinemann 60 | 4.1656 | – | 0.99 | LDA+U (U-J=6.52) |
| Tran 61 | 4.27* | – | 0.63-0.94 | LDA+U (U-J) |
| Cortona 57 | 4.359 | 106 | – | PBE |
| Islam 47 | 4.312 | – | 0.7 | PBE |
| Isseroff 62 | 4.18 | 145 | 0.68 | LDA |
| Isseroff 62 | 4.10-4.17 | 135-143 | 0.81-1.15 | LDA+U (U-J) |
| Isseroff 62 | 4.31 | 109 | 0.43 | GGA |
| Isseroff 62 | 4.26-4.30 | 96-106 | 0.54-0.84 | GGA+U (U-J) |
| Isseroff 62 | 4.28 | 114 | 2.84 | PBE0 |
| Isseroff 62 | 4.29 | 114 | 2.04 | HSE |
| Le 63 | 4.317 | – | – | PBE |
| Martinez-Ruiz 48 | 4.3 | 108 | 0.5 | PBE |
| Bohnen 42 | 4.30 | 112 | – | PBE |
| Soon 64 | 4.34 | 104 | – | PBE |
| Soon 49 | 4.32 | 104 | 0.64 | PBE |
| Ruiz 50 | 4.435 | 100 | 9.7 | HF |
| Ruiz 50 | 4.277 | 93 | – | HF+LYP |
| Heinemann 60 | 4.2675 | – | 2.02 | HSE06 |
| Scanlon 65 | – | – | 2.12 | HSE |
| Tran 61 | 4.27* | – | 0.79-2.77 | PBE0 |
| Bruneval 66 | – | – | 1.34 | G0W0 |
| Bruneval 66 | – | – | 1.97 | scGW |
| Filippetti 53 | 4.23 | – | 1.8 | SIC |
| Kotani 67 | – | – | 1.97 | scGW |
| Lany 68 | – | – | 2.03 | GW+Vd |
| Experiment 40, 10 | 4.27 | 106-138 | 2.02-2.17 | – |
3.2 Cu2O surfaces
Experimental data are available only for Cu2O(100) and Cu2O(111) low index surfaces of cuprous oxide, by means of XPS (which monitors the Cu to O ratio on the surface), LEED in ultra high vacuum (which identifies the periodicity of the surface), and in the case of Cu2O(111), also with TEM.
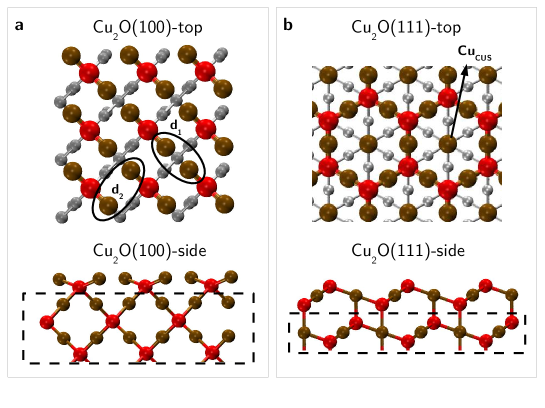
We first consider the polar Cu2O(100) surface, which is formed by a succession of purely Cu or O layers and yields bulk-truncated surfaces which are either O- or Cu-terminated (Fig. 2a). Polar surfaces generally reconstruct 69 and three different reconstructions were observed on Cu2O(100) according to the preparation method 70. The most stable surface in vacuum is a Cu-terminated surface with a reconstruction. The LEED pattern (which however showed many missing spots and the reconstruction is presented as tentative) was interpreted as a relaxation of the top layer of copper cations forming two surface dimers (d1 and d2 in Fig. 2a). Two transient structures were also identified: at 900 K, a reconstruction presenting a layer of terminal oxygen, and, after long oxygen exposures, the stoichiometric () O-terminated surface. Both structures revert to the reconstruction upon further annealing over K. The reconstruction has been reproduced computationally 71, and it is more stable than the Cu- or O-terminated reconstruction 72, 73, 63.
The other experimentally studied surface is Cu2O(111). A Cu2O(111) slab is formed by a succession of O-Cu-O trilayers, ending with either a (stoichiometric, non polar) oxygen or (non-stoichiometric) copper termination (Fig. 2b). Photoemission and LEED experiments on this Cu-terminated (111) surface found, after annealing in UHV, a nearly stoichiometric reconstruction, with periodicity, attributed to an ordered 1/3 of an atomic layer of oxygen vacancies 70, 54. Conversely, annealing in oxygen gives a stoichiometric oxygen-terminated surface (with possibly the loss of the unsaturated copper atoms, CuCUS in Fig. 2b, at the centre of the hexagons) 54. The stability of both polar and non-polar stoichiometric Cu2O(111) surfaces has been studied also computationally47, 74, 75, 76, 77, 78 by means of DFT combined with, in some cases, ab initio thermodynamics. Ab initio thermodynamics (see e.g. 79, 80) is a technique which allows one to estimate relative system stabilities in different environments; in this case, the stability of different oxide surfaces at a range of temperatures and oxygen partial pressures. These studies showed that the experimentally observed Cu2O(111) surfaces are indeed the most stable. 76.
A wider range of low-index surfaces has been probed using DFT methods than experimentally 77. The predicted lowest energy structure in high O2 pressure is the already mentioned Cu2O(111) surface missing the unsaturated CuCUS atom and at low O2 pressure the Cu2O(110) surface with a CuO-like surface reconstruction, which has not been observed experimentally (the (110) surface has not been studied yet).
It is thus evident that there is scope for further experimental work on this topic, to confirm the computational predictions or to propose new reconstructions. Surface-sensitive techniques such as STM and LEED, which allow a direct imaging of the surfaces, would be best suited to this aim. Moreover, theoretical methods would be well suited to understand the reason behind the transitions between different reconstructions at different conditions of temperature and pressure.
3.3 CuO bulk properties
In CuO, the copper atom has oxidation state Cu2+. The unit cell has monoclinic symmetry 81 (see Fig. 1) and it contains four CuO dimers in the crystallographic unit cell, and two CuO units in the primitive cell. Each copper atom is located in the centre of an oxygen parallelogram. Each oxygen atom, in turn, has a distorted tetrahedral copper coordination. CuO is a -type semiconductor 82, 83, 84, 85 and it is antiferromagnetic in its ground state 86, 87, 88, 89.
From a DFT point of view, standard XC functionals alone are not accurate enough to reproduce the distorted nature of the lattice, and, upon structural relaxation, they produce an orthorhombic rather than a monoclinic structure 90. However, the use of more sophisticated functionals 91, 60, 92, 90, 93, 52 allows for the reproduction of the triclinic structure and good agreement with experiments on structural and vibrational data 94, 95, 96, 97 (see Table 2).
| Ref. | lattice (, , ) [Å] | [∘] | mB [] | Band Gap [eV] | XC |
| Peng 90 | 4.05, 4.06, 5.06 | 90.02 | 0.0 | 0.0 | LSDA |
| Peng 90 | 4.56, 3.27, 4.96 | 100.2 | 0.63 | 1.32 | LSDA+U (U=7.5, J=0) |
| Anisimov 98 | – | – | 0.66 | 1.9 | LSDA+U (U=7.5, J=0.98) |
| Debbichi 91 | 4.548, 3.305, 4.903 | 99.652 | – | – | LSDA+U (U=7.5, J=0.98) |
| Ekuma 99 | 4.68, 3.42, 5.13 | 90 | 0.68 | 1.25 | DFT+U (U=7.14) |
| Heinemann 60 | 4.588, 3.354, 5.035 | 99.39 | 0.66 | 1.39 | LDA+U (U=7.5, J=0.98) |
| Wu 93 | 4.55, 3.34, 4.99 | 99.507 | 0.6 | 1.0 | LSDA+U (U=7.5, J=0.98) |
| Hu 92 | — | — | 0.63 | 1.1 | GGA+S+U (U=7.5, J=0.98) |
| Jiang 100 | 4.68, 3.42, 5.13 | 99.54 | 0.80 | – | GGA+U (U=4.5) |
| Nolan 101 | 4.395, 3.846, 5.176 | – | 0.53-0.7 | 0.17-2.11 | GGA+S+U (U=3-9, J=0) |
| Svane 102 | – | – | 0.65 | 1.43 | SIC-LSDA |
| Szotek 103 | – | – | 0.64 | 1.0 | SIC-LSDA |
| Heinemann 60 | 4.513, 3.612, 5.141 | 97.06 | 0.54 | 2.74 | HSE06 |
| Lany 68 | – | – | – | 1.19 | GW+Vd |
| Exp. | 4.684, 3.423, 5.129 81 | 99.54 81 | 0.68 | 1.2-1.9 10, 41, 84, 104, 85 | – |
The research focus for CuO has been for a long time on its optical properties, for phototermal and photoconductive applications, and on magnetic and phase stability properties, for possible high-temperature superconducting applications. The electronic properties of CuO, instead, have been studied only more recently. The band gap of CuO has been experimentally measured to be eV 10, 41, 84, 104, 85, with the results depending on the sample preparation and on the measurement techniques used. Computationally, the band gap is well reproduced with the LDA+U approach (see Table 2), however the results depend strongly on the value of U while the HSE06 hybrid functional overestimates the gap by approximately 1 eV 60.
3.4 CuO surfaces
The potential use of CuO nanostructures for catalysis, sensing or superhydrophobicity and many other applications 106 requires a good knowledge of the surfaces involved in these processes. Only one experimental study has been performed to date on CuO surfaces. In this work, it was found, using LEED, that the CuO(100) surface in UHV conditions does not present a reconstruction 107.
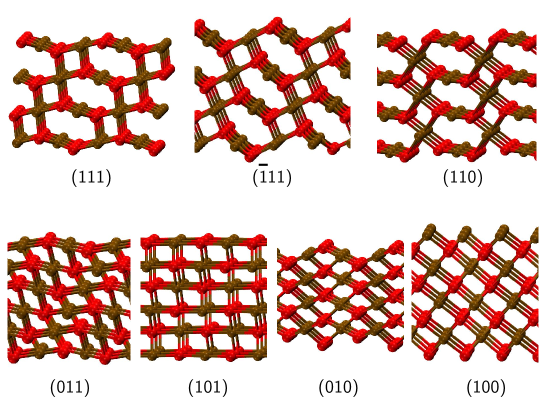
DFT studies (using a GGA XC functional with the Hubbard U correction combined, in some cases, with ab initio thermodynamics) of the stoichiometric and of some defective surfaces have been performed 92, 108, 109. CuO(111) is the most stable surface also compared to defective CuO structures with surface and subsurface vacancies 108, with surface energy J/m2 (although much higher than the lowest energy Cu2O surface 77). This is true for all oxygen partial pressures, except for a narrow range at very low O2 pressures, where the Cu-terminated CuO(110) surface is favourable. The energy order of the stoichiometric surfaces is (shown in Fig. 3) 92. The highest surface energies ( J/m2 for CuO(100)) are associated to large fields between anionic and cationic layers, such as for the (010) and (100) surfaces. Among the non-stoichiometric surfaces, the O- and Cu-terminated CuO(110) and CuO(100) are more stable than their stoichiometric counterpart for high (O-terminated) and low (Cu-terminated) oxygen pressures 92.
While important information on stoichiometric and defective CuO surfaces has been obtained using computational methods, experimental data are lacking and there is room for work to be performed in order to either confirm these predictions or to suggest more possible structures.
4 Initial stages of oxidation: oxygen adsorption on clean copper surfaces
The growth of an oxide can occur when a metal surface comes into contact with an oxygen-rich environment. The reaction sequence leading to oxidation of a clean metal surface is generally accepted to be oxygen chemisorption, nucleation and growth of the surface oxide, and bulk oxide growth.
It is well known that clean copper surfaces in vacuum do not reconstruct 112. However, exposure to oxygen pressure which is low enough not to trigger the formation of oxide-like structures induces reconstructions. We will discuss the details of these reconstructions below, and whether they are important to the initial stages of oxidation is still openly debated. It has been speculated that a reconstructed, O-saturated layer must form before the onset of oxidation, since dwell times, i.e. the lapse of time between the beginning of oxygen deposition and observation of oxide formation, of up to 30 minutes have been observed 113, 114, 115. Moreover, evidence of the existence of the reconstructed copper surfaces and of subsurface growth of the oxide before the onset of island formation, has been produced using STM on Cu(100) 116 and Cu(111) 117. DFT calculations have shown that, on Cu(100), subsurface oxide-like structures are more easily produced when the surface already has pre-adsorbed oxygen atoms, thus suggesting that the reconstruction facilitates oxide formation 118. However, it has also been shown that upon exposure to oxygen at higher pressures 119 copper oxide formation at step sites occurs without prior surface reconstruction thus opening the debate about whether direct formation of oxide islands can occur without the formation of a O/Cu overlayer.
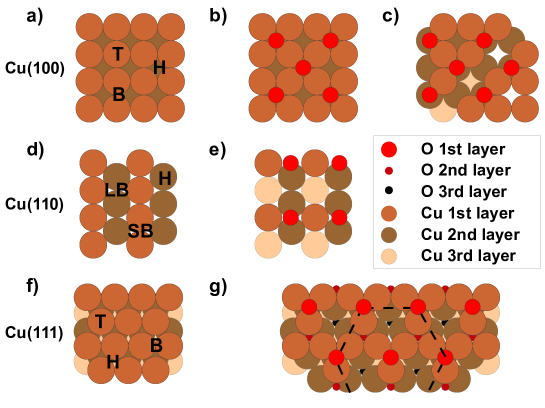
In the following section, the very initial stage of the oxidation process, i.e. the chemisorption of oxygen onto copper surfaces is reviewed. A summary of the overlayer structures formed on Cu after O-dosing is shown in Fig. 4. Cu(100) presents two main reconstructions, one with symmetry (Fig. 4b) and a missing-row reconstruction (Fig. 4c), which are discussed in depth in Sec. 4.1. The main overlayer structure for Cu(110) is the added-row reconstruction shown in Fig. 4e and discussed in Sec. 4.2), while the O/Cu(111) system, presented in Sec. 4.3 shows a distorted hexagonal structure resembling the Cu2O(111) surface (Fig. 4g).
Oxygen adsorption on clean copper has been extensively studied experimentally and computationally, and it has been the subject of a number of reviews over the years, e.g. see Refs. 120, 121. Here we focus only on the studies which are relevant in order to understand the onset of copper oxidation on the Cu(100), (110) and (111) surfaces and on the most recent developments in the field.
4.1 Cu(100)
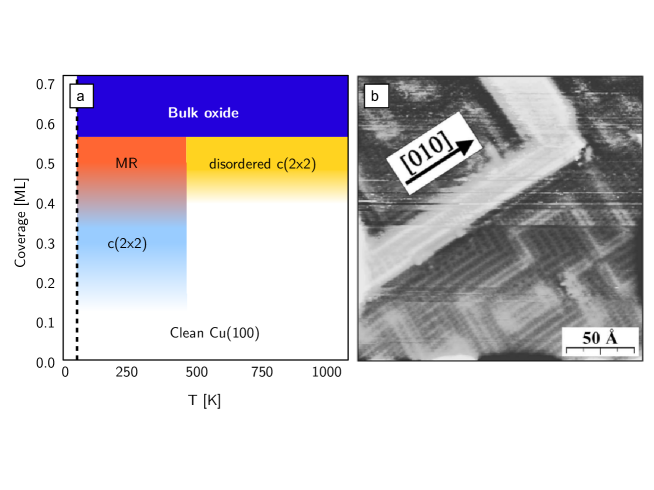
Oxygen adsorption on Cu(100) has been widely studied 121, 116, 122, and an interesting variety of structures is formed depending on temperature and coverage, as shown in the phase diagram in Fig. 5a.
At low temperatures (up to K) and low coverage ( monolayers, ML, defined as one adsorbed oxygen atom for every surface copper atom) experimental and computational evidence has shown that incident oxygen molecules dissociate with the oxygen atoms adsorbing at the hollow site 123, 124, 125, 126, 127, 128. These dissociated oxygen atoms stabilize chemisorption of further incoming oxygen molecules at higher coverages 129, 130, 131, 132.
Below K, two overlayer structures form: a phase 116, 133, 134, 135, 136 at a coverage of ML and a missing-row (MR) reconstruction 137, 138, 139, 140, 141, 142, 143, 144, 145, 146 at ML. In the phase (shown in Fig. 4b) the oxygen atoms occupy four-fold hollow sites on Cu(100) and form nanometre-sized domains separated by oxygen-deficient zig-zag shaped boundaries. The MR reconstruction (Fig. 4c, 5b) can be viewed as a structure with each fourth [100] row of Cu atoms missing. Between 0.3 and 0.5 ML, Cu atoms are ejected from the domains 147, 118 and MR islands start forming on terraces, until, at ML coverage, a network of missing-row reconstruction islands covers the whole surface 116, 133.
At high temperatures ( T K) a -like state, with vacancies in the top Cu layer forms at ML coverage, instead of the MR reconstruction 148.
No further oxygen adsorption occurs above ML for experiments at very low pressures ( Torr). However, at higher pressures, further exposure of the surface to O2 leads to growth of oxide in the subsurface regions, while the surface still exhibits the MR reconstruction 116, 141, validating the hypothesis that oxygen-induced surface reconstruction is indeed the first step of oxide growth.
DFT studies combined with ab initio thermodynamics 126, 149 confirmed that the two experimentally observed reconstructions at lower temperatures are the most stable during the early stages of Cu(100) oxidation prior to the onset of bulk oxidation.
The transition between the two low-temperature reconstructions has been tentatively explained in terms of stress relief, electrostatics and orbital hybridization. Compressive surface stress has been shown, both by means of experiments and DFT calculations 150, 151 to increase with oxygen adsorption, and to be higher in the reconstruction. Therefore the MR reconstruction is more stable at higher oxygen coverages. Electrostatically, the driving mechanism for oxygen overlayer formation has been related to long-range Coulomb interaction 152, 153, 154, 155, 156, 157, and the small size of the domains to repulsion between O adatoms and Cu and O adatoms. At coverages where the O atoms have nowhere to form distinct domains the phase transition occurs to minimize high O-O repulsion. This is in disagreement with the findings of Merrick et al. 158, who argue that the stability of the MR system is determined by orbital hybridization of neighbouring O-Cu which lowers the energy of the system, rather than by long-range interactions.
The transition between the ordered MR to the ‘disordered’ reconstruction has been explained by means of DFT in terms of diffusion of Cu surface vacancies from an ordered array in the MR system to random positions as the temperature increases 148.
An intermediate added row structure was predicted by Kangas et al. 159 which has energies comparable to the MR reconstruction. This reconstruction has however not yet been observed experimentally, possibly because the right conditions of temperature and pressure for this structure have not been used 116. Ab initio thermodynamics calculations could approximately establish at which experimental conditions this reconstruction is expected and could thus inform further experimental work.
It is important to note that simulations have shown that the MR structure is a necessary step towards the formation of a Cu2O-like structure 118, 160. Indeed, Cu2O-like structures were found to form on the MR reconstruction upon O adsorption which were not found on the non-reconstructed surface, thus confirming the experimental results of Lahtonen et al. 116 and fitting well with the work of Zhou et al. 161, who finds the presence of a two-layer thick oxide before the formation of oxide islands of the Cu(100) surface (see Sec. 5.1).
In summary, three reconstructions can form on Cu(100) upon oxygen adsorption, as shown in Fig. 5. Of these, the MR reconstruction is the most stable at room temperature, for coverages ML. Experimental and computational evidence has shown that the formation of this reconstruction is the first step towards the formation of the bulk oxide.
4.2 Cu(110)
Molecular oxygen dissociates when deposited on Cu(110) at temperatures above K 162. Upon dissociation of the O2 molecules a number of overlayer structures are observed, including an added-row structure (Fig. 4e) which is formed at an oxygen coverage of 0.5 ML 121, 145, 163, 164, 165. Another type of surface reconstruction, , has also been reported at high coverage ( ML) 166, 167, 168, 169, 145, 170, 165, 171, 172 or at lower coverage but higher temperature 173.
The phase forms via the creation of Cu-O-Cu-O chains along the direction of the substrate, which eventually become the ‘added rows’ on top of the clean substrate at a coverage of 0.5 ML. The chains start forming above K but do not fully organize until K 162. They are formed from mobile chemisorbed O atoms and Cu adatoms which leave from step edges and diffuse across the terraces 174, 138, 175, 176, 177, 162, 178. The experimental barrier calculated for the formation of these strings, eV 179, is close to the DFT-calculated barriers for Cu ( eV) and O ( eV) diffusion 180.
At oxygen coverages between 0.05 and 0.45 ML these Cu-O-Cu-O chains self-organize in a periodic array (called a supergrating) with a spacing varying between 60 and 140 Å 181, 182, 183, 138, 184. The dependence of the period of the supergrating as a function of oxygen coverage has been explained in terms of electrostatic 185 and elastic interactions 186, 187, 188, 189, 190, 191. In the first case, the period has been related to the difference in work function between the clean and reconstructed sections of the surface, in the second case to stress relief from the mismatch between the preferred period of the Cu-O-Cu-O chains and the period of the Cu(110) substrate in the [001] direction. It could indeed be possible for both mechanisms to be at play.
The stability of the reconstruction at 0.5 ML has been established computationally by means of semiempirical and DFT calculations, where it has been found to be energetically favourable with respect to the unreconstructed surface 179, 192, 180, 193 and to an alternative added row geometry 190. DFT simulations with ab initio thermodynamics 126, 194, 172 found that the Cu-O added row reconstruction is favoured at low oxygen exposures, whereas at higher oxygen exposures, a transition to the structure is predicted to occur. Thus, experiment and theory are in qualitative agreement, although the absolute transition pressures vary enormously (by 10 orders of magnitude). Since it is a major challenge for current DFT XC functionals to accurately predict adsorption energies and the underlying value of the adsorption energy has a huge impact on subsequence pressure estimates, such a quantitive discrepancy is not uncommon vdw_review, kresse_nat_mat, carrasco_nat_mat. The barrier to transition between the two structures has been calculated to be fairly high at eV, which seems to explain why this phase is observed only at high temperatures.
A large amount of work has been performed in order to understand the surface electronic states of the added row reconstruction, using both experimental methods such as photoemission spectroscopy 195, 196, 197, 198 and theory 198, 199, 200 . The character of the O-Cu bonding is found to be predominantly ionic, and the surface O() orbitals hybridize strongly with the Cu() states, forming bonding and antibonding linear combinations, with the antibonding bands not having been identified unambiguously yet.
There is no evidence so far on how the observed reconstruction relates to the initial formation of the oxide, if at all. DFT calculations of subsurface oxygen added beneath both reconstructed surfaces have found that when an O coverage of 1 ML is reached, subsurface oxide formation in the tetrahedral interstitial sites is predicted to occur 201. The presence of oxygen in the tetrahedral site has been linked to oxide formation (since the O in Cu2O resides in the tetrahedral sites), and therefore this is a possible mechanism for the initial formation of the oxide, which should however be confirmed by experimental or further computational work.
4.3 Cu(111)
The clean (111) surface has the lowest surface energy for copper and it is less reactive compared to the other low-index Cu surfaces. It is therefore less studied for oxygen adsorption 202, 203, 114, 130, 204, 205, 129, 206, 207, 110, 208, 209, 111, 210. No ordered structures are observed experimentally for low oxygen exposure 204, 114, 205, 211. Indeed, also DFT studies have found that oxygen adsorbs preferentially at the threefold hollow site for coverages up to 0.75 ML, without forming periodic overlayer structures 212, 49, 213, 214.
At higher coverage, the adsorbed oxygen and copper adatoms that are ejected from step edges and terraces 209, 210, 117 start forming overlayer structures, before the onset of epitaxial growth (see Sec. 5.3). Two main classes of reconstructions have been proposed for the O/Cu(111) surface. The first, seen in LEED studies, involves a Cu(100)-like overlayer, incommensurate with the underlying unreconstructed Cu(111) surface, with the oxygen atoms occupying the hollow sites 215, 216. The second class comprises two long-range ordered structures 207, 110, the so-called ‘29’ and ‘44’ superstructures. They have, respectively, () and () symmetry and very large surface unit cells, 29 and 44 times larger than the cell of clean Cu(111). They exhibit an honeycomb pattern formed by distorted honeycomb units of the ‘ideal’ Cu2O(111) overlayer shown in Fig. 4g. The oxide-like overlayer structure has been confirmed by STM 209, X-ray absorption studies 111 and DFT and ab initio molecular dynamics 78, 49. This differs from the behaviour of other O/transition metal systems such as O/Ag(111) 217, 218 and O/Pd(111) 219, where chemisorbed oxygen adlayers form, before the formation of a surface oxide. Other systems, such as O/Ru(0001) 220 and O/Rh(111) 221, 222, instead never form a surface oxide layer before the onset of bulk oxidation.
Therefore, both experimental and computational studies point to the formation of hexagonal or quasi-hexagonal structures on the Cu(111) surface upon oxygen adsorption, structures which can be viewed as the initial layer of a Cu2O(111) film and which can potentially act as a template for the growth of further Cu2O(111) layers.
5 Oxide film growth
When copper surfaces are exposed to a continuous flow of oxygen for a long time oxidation is expected to occur. It is known in general, from well-defined surface science studies of metals, such as those discussed in Sec. 4, that the O/metal structure which forms at the onset of oxidation can be distinct from the bulk oxide surface structure 14, 223, 224. The growth of oxides in copper has been studied since the early 1920s and early work has been extensively reviewed (see e.g. Ref. 14). In this section, we aim to present an overview of the main topics in the field of copper oxide growth mainly focusing on recent studies and on the present state of experiments and theory.
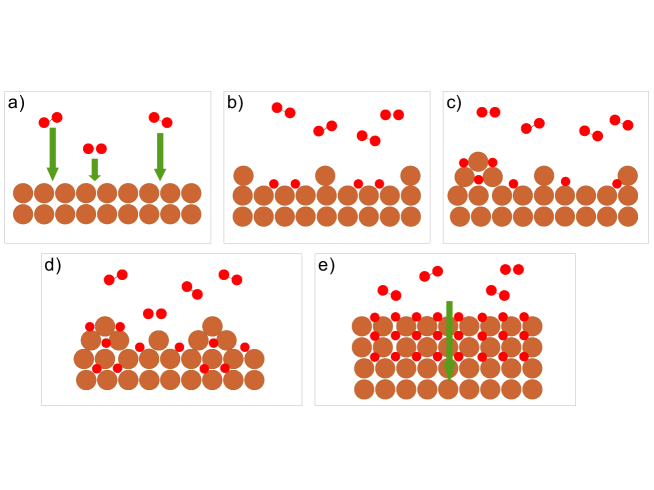
In order to understand the microscopic details of the onset of oxidation, experiments have been performed in controlled laboratory conditions, where the orientation of the surface, temperature and oxygen pressures can be tuned to the required values. The formation of the oxide has been directly observed by means of TEM, and their structure analysed by means of LEED and ellipsometry. At the oxygen pressure, temperature and exposure times used in these studies, only cuprous oxide is expected to form 39, 225, 226. We review studies showing that the growth of cuprous oxide on low-index copper surfaces is epitaxial with the substrate 227, 228, 14, 229, 230, through nucleation and coalescence of nano-islands 231, 232, 202, 114, 227, 113, 203 (as schematically represented in Fig. 6). However, the mechanism of formation of the islands and the resulting shapes and growth rates are strongly dependent on the Cu substrate, as shown in Sec. 5.1 for Cu(100), Sec. 5.2 for Cu(110) and Sec. 5.3 for Cu(111). Key experimental findings are summarised in Tables LABEL:tab:uhv_100, LABEL:tab:uhv_110, LABEL:tab:uhv_111. The kinetic models for the nucleation and coalescence of the nano-islands and for the growth of the oxide thin film are reviewed in Sec. 5.4 and Sec. 5.5.
Growth of the oxide in ambient conditions, when the copper surface is exposed to humid air, has also been extensively studied. The body of work addressing this issue is reviewed in Sec. 5.5 and summarised in Table LABEL:table:native.
Finally, the existence of preferential oxidation sites is discussed (Sec. 5.7) and studies on the initial growth of CuO are reviewed (Sec. 5.8).
5.1 Oxide nano-islands: Cu(100)
As for the formation of O/Cu overlayers, Cu(100) is the most extensively studied surface, both experimentally and computationally. Copper oxidation on this surface proceeds, for low oxygen partial pressures ( Torr), through the formation of islands which are epitaxial with the surface, i.e. Cu2O(100) Cu(100) 233, 234, 115, 235, 231, 113, 236 and have lattice misfit configuration 237, 225. These islands grow and coalesce with further oxygen deposition. The shape of the islands depends on temperature 238 in a rather interesting manner as shown in Fig. 7.
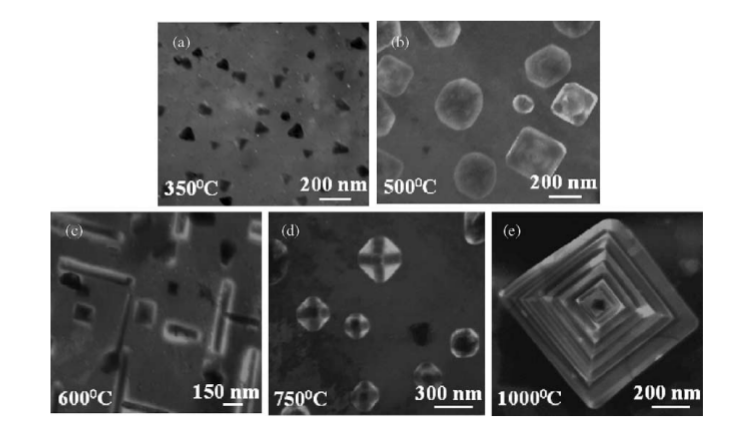
Below ∘C only triangular islands are observed, whereas between ∘C the shape changes to round or square. At around ∘C the islands start to grow until, at a critical size of nm, when they switch to a quasi-one-dimensional elongated rod shape. Between ∘C pyramid-shaped islands are observed and between ∘C hollow pyramids form 239. The big effect of temperature on the morphology of the islands could be either due to the dependence of copper and oxygen diffusion on temperature or to changes in interfacial strains and in the mechanical properties. Indeed, the transition between the round/square to rod shape shown in Fig. 7b,c has been explained as a competition between the surface energy and the strain of the islands due to the mismatch between the clean metal and the oxide lattices, following the so-called Tersoff-Tromp 240 energy model.
TEM, XPS and AES studies looking at the cross section of an oxidising Cu(100) single crystal under low oxygen partial pressure 161, 241, 115, 242 have revealed that the oxide islands form on top of an oxide wetting layer. The wetting layer itself has a missing row reconstruction and forms from the Cu atoms ejected by the missing row reconstruction of the substrate (described in Sec. 4.1) and the further oxygen deposited on the substrate 241. Island growth also occurs beneath the surface, in good agreement with the already reviewed results by Lahtonen et al. 116 (Sec. 4.1) who observed subsurface oxide growth for oxygen coverages above 0.5 ML and pressures above Torr.
In general, when a metal is capable of forming uniform subsurface oxides (as in the case of Ag(110) 243 and Ru(0001) 244), oxide growth proceeds uniformly, rather than via island formation. The reason for the island formation on top of the wetting layer is found in stress mismatch between the Cu(100) substrate and the Cu2O(100) film 161.
The transition between the O/Cu(100) system described in Sec. 4.1 and the oxide islands has been studied to some extent with DFT, and although the full transition has not been modelled yet, insight has been gained into the mechanisms at play. On the MR reconstructed surface, sub-surface adsorption becomes favourable for O coverage above ML, with low barriers for the transport of oxygen atoms below the surface 245, 246, 247. Sub-surface oxygen atoms below the missing-row reconstruction adsorb in the tetrahedral interstitial sites, and thus form an oxide-like structure, unlike the case of sub-surface oxygen atoms below non-reconstructed surfaces, which adsorbs in the octahedral site 160. However, the limiting factor for the oxidation of Cu(100) is the dissociation and on-surface diffusion of the oxygen molecule. The dissociation of the oxygen molecule, although almost barrierless on the clean Cu(100) 124, is blocked by the on-surface oxygen on the reconstructed surface 248, and requires the diffusion of the oxygen molecule towards either a high-Cu concentration area 153 or vacancies and surface defects 249, 250 where the dissociation barrier is lower. Diffusion of O and Cu atoms on the MR reconstructed surface is slow, having barriers of eV for oxygen and eV for Cu 153. The high barriers and slow diffusion make these processes difficult to simulate. Indeed, Devine et al. 251 successfully simulated oxygen molecule dissociation on the clean Cu(100) surface with bond-order potentials, however they did not see any dissociation event on the missing-row reconstructed surface within their (short) 10 ps of molecular dynamics. This highlights the difficulty of reproducing these complex phenomena which include diffusion of oxygen molecules, dissociation, diffusion of oxygen and copper atoms on and through the surface using standard computational approaches. To this end, the combination of an accurate reactive potential with methods which allow for rare events to be probed, such as metadynamics 252 are possibly a way to go for this type of system.
| Reference | Sample thickness | Surface Preparation | Exp. Conditions | Technique | Result |
| Brockway 231 (1972) | nm | Annealing in H2 at T= ∘C | P= Torr, T= ∘C | TEM | Epitaxial growth of oxide islands. |
| Heinemann 113 (1975) | nm | Annealing, argon ion sputter etching | P= Torr, T= ∘C | TEM | Epitaxial growth of square and hexagonal oxide islands. |
| Stefanov 236 (1988) | – | Ion bombardment and heating under UHV | to L, T= ∘C | HREELS, XPS | Cu2O formation at oxygen exposures between L |
| Yang 233 (1997) | nm | Annealing in methanol vapour at ∘C | Torr | TEM | Rate of growth of the oxide islands . |
| Yang 115 (1998) | nm | Annealing in UHV/CH4O vapour at ∘C | Torr | TEM | O monolayer forms before growth of the oxide islands. |
| Yang 253 (1998) | nm | Annealing in methanol vapour at ∘C, Torr | Tor at ∘C | TEM | Epitaxial island formation after surface reconstruction. |
| Yang 234 (1998) | nm | Annealing in CH4O vapour at ∘C, Torr | Tor ∘C | TEM | Nucleation of islands promoted by O diffusion. |
| Yang 254 (1999) | nm | Annealing in CH4O vapour at ∘C, Torr | Tor ∘C | TEM | Preferential nucleation site at the edge of holes. |
| Yang 242 (2001) | nm | Annealing in CH4O vapour at ∘C, Torr | O2/H2O vapour at Tor at ∘C | TEM | Initial surface reconstruction prior to island growth. |
| Yang 235 (2002) | nm | Annealing in CH4O vapour at ∘C, Torr | Torr at ∘C | TEM | Good agreement of kinetic data with the JMAK model. |
| Zhou 238 (2003) | nm | Annealing in CH4O vapour at ∘C, | Torr at ∘C | TEM | Temperature-dependent shape of oxide nano-islands. |
| Eastman 225 (2005) | nm | Annealing in Ar-H2 at ∘C, Torr | Torr at ∘C | X-ray scattering | Epitaxial nano-island formation. |
| Zhou 255 (2005) | nm | Annealing in CH4O vapour at ∘C/vacuum C | Torr, ∘C | TEM | Island nucleation rate faster on (111) than (110) or (100) |
| Zhou 256 (2005) | nm | Annealing in vacuum at ∘C | Torr, ∘C | TEM | Temperature-dependent shape and oxidation rate of the oxide islands. |
| Zhou 239 (2005) | nm | Annealing in CH4O vapour at ∘C/vacuum ∘C | Torr, ∘C | TEM | Island nucleation rate faster on (111) than (110) or (100) |
| Lampimaki 241 | – | Ar+ bombardment, annealing at ∘C | Torr, ∘C | XPS, XAS, STM | Island formation on top of the missing-row reconstruction for O/Cu(100) |
| Lahtonen 116 (2008) | mm | Ar+ bombardment, annealing at ∘C | Torr and Torr, ∘C | STM | Surface reconstruction and oxide island formation at high O2 exposure. |
| Zhou 237 (2009) | nm | Annealing in Ar/H2 at ∘C | Tor, ∘C | TEM | Cu2O islands, nm side. Epitaxial growth with inclined Cu2O/Cu edges. |
| Zhou 119 (2012) | nm | Annealing in H2 at ∘C | Tor, ∘C | TEM | Step-edge induced oxide growth. |
| Zhou 161 (2013) | nm | Annealing in H2 at ∘C | Tor, ∘C | TEM | Cu2O islands grow on an oxide wetting layer nucleated on surface steps. |
5.2 Oxide nano-islands: Cu(110)
The islands formed on Cu(110) single crystals after being exposed to low pressure oxygen ( Torr) are also found to be epitaxial with the substrate 182. The island morphology and the time required to reach saturation density depend on temperature, with higher temperatures requiring much shorter time to saturation. Between and ∘C the lateral size of the islands is almost constant ( nm), however the islands were found to thicken considerably ( nm) beneath the Cu surface, showing that the rise in temperature greatly enhances the interfacial diffusion of oxygen 257. At ∘C, the (110) surface of clean copper roughens with a step height of nm 258. Exposure to oxygen of this rough surface shows the formation of a higher density of oxide islands with a fast nucleation rate but slower lateral growth than for smooth surfaces. This comparison between smooth and rough surfaces supports the idea that the kinetics of nucleation and growth of islands is dependent on the surface diffusion of oxygen atoms on the surface (see Sec. 5.4).
| Reference | Sample thickness | Surface Preparation | Exp. Conditions | Technique | Result |
| Zhou 259 (2002) | nm | Annealing in CH4O vapour at ∘C, Tor | Tor at ∘C | TEM | Rod-shaped nm-thick islands. |
| Zhou 182 (2003) | nm | Annealing in CH4O vapour at ∘C | Tor, ∘C and ∘C | TEM | Faster initial oxidation rate than Cu(100) |
| Zhou 258 (2004) | nm | Annealing in CH4O vapour at ∘C | Tor, ∘C and ∘C | TEM | Higher density and slower lateral growth rate of islands on rougher Cu(110) surfaces. |
| Zhou 257 (2004) | nm | Annealing in CH4O vapour at ∘C | Tor, ∘C | TEM | Faster oxidation at higher temperatures. |
| Zhou 255 (2005) | nm | Annealing in CH4O vapour at ∘C/vacuum C | Tor, ∘C | TEM | Island nucleation rate faster on (111) than (110) or (100) |
| Zhou 256 (2005) | nm | Annealing in vacuum at ∘C | Tor, ∘C | TEM | Temperature-dependent shape and oxidation rate of the oxide islands. |
| Zhou 239 (2005) | nm | Annealing in CH4O vapour at ∘C/vacuum ∘C | Tor, ∘C | TEM | Island nucleation rate faster on (111) than (110) or (100) |
5.3 Oxide nano-islands: Cu(111)
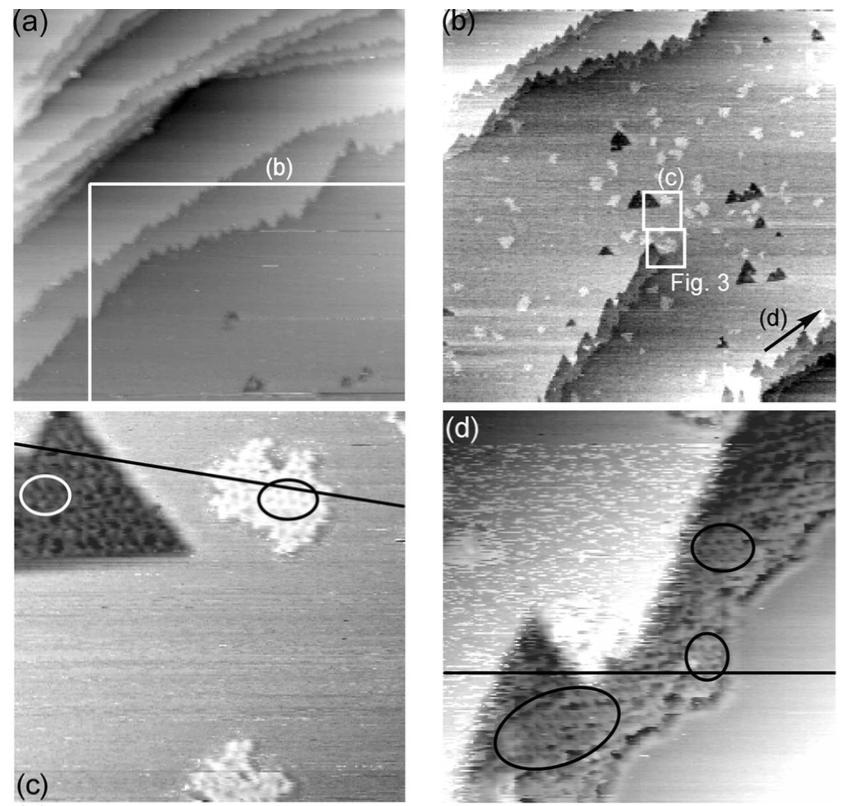
At room temperature the oxidation of Cu(111) also proceeds through the formation of epitaxial oxide islands with a lattice misfit 260, 117, 209 which coalesce with continuous oxygen exposure. Three processes of oxide formation are observed in this regime 117, 209 (Fig. 8): growth from step edges, in-terrace growth ( Å below the terrace surface) from vacancy islands and growth of on-terrace oxide. The formation of randomly placed islands at low temperature agrees well with the existence of a disordered underlying structure observed for low-coverage oxygen adsorption and analysed in Sec. 4.3. At higher temperatures 260, 209 fast formation of the oxide and fast lateral growth leads to the formation of a two-dimensional oxide structure. This uniform growth is templated by the distorted-hexagonal surface reconstruction shown in Sec. 4.3 209.
Zhou et al. observed an interesting phenomenon at intermediate temperatures: the islands nucleate close to existing islands, anisotropically elongating along the [110] direction in a percolating manner, as shown in Fig. 9.
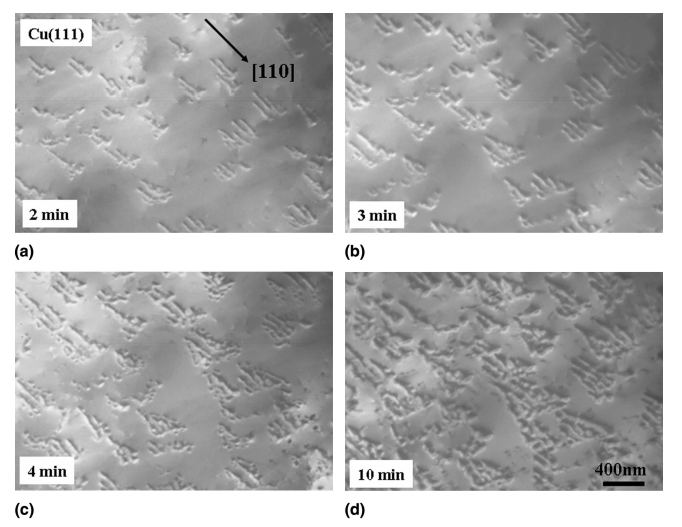
This ‘discontinuous-branched’ shape has been investigated using kinetic Monte Carlo techniques 261, and it appears to be related to restricted diffusion of oxygen on the surface, which might then be related to the surface being reconstructed to the ‘29’ or ‘44’ structures, which are fairly corrugated (they extend up to Å over the clean Cu(111) surface).
| Reference | Sample thickness | Surface Preparation | Exp. Conditions | Technique | Result |
| Lawless 262 (1956) | – | Electropolishing | Torr, ∘C | XRD | Epitaxial Cu2O oxide, disordered CuO. |
| Goulden 227 (1976) | m | Polishing in orthophosphoric acid at 1.4 V | Torr, ∘C | TEM | Epitaxial oxide islands. |
| Ho 203 (1978) | – | Annealing in vacuum at ∘C | Torr, C | TEM | Epitaxial lamellar growth. |
| Dubois 114 (1982) | – | Annealing in H2 at ∘C | Torr, ∘C | EM | Epitaxial oxide islands on defect sites. |
| Milne 232 (1984) | m | Polishing, annealing | Torr, ∘C | RHEED, TEM | Formation of epitaxial oxide islands. |
| Rauh 263 (1993) | nm | Deposition by dc heating. | O2, Tor, ∘C, min | Ellipsom. | Formation of a Cu2O film |
| Matsumoto 209 (2001) | – | Ar+ sputtering and vacuum annealing at ∘C | Torr, RT | STM, LEED | Growth of oxide from step edges. |
| Zhou 255 (2005) | nm | Annealing in CH4O vapour at ∘C/vacuum C | Tor, ∘C | TEM | Island nucleation rate faster on (111) than (110) or (100) |
| Zhou 256 (2005) | nm | Annealing in vacuum at ∘C | Tor, ∘C | TEM | Temperature-dependent shape and oxidation rate of the oxide islands. |
| Zhou 239 (2005) | nm | Annealing in CH4O vapour at ∘C/vacuum ∘C | Tor, ∘C | TEM | Island nucleation rate faster on (111) than (110) or (100) |
| Zhou 261 (2008) | – | Annealing in vacuum at ∘C | Tor, ∘C | TEM | Growth of oxide hollow pyramidal islands. |
| Zhou 260 (2009) | nm | Annealing in CH4O vapour at ∘C/vacuum ∘C | Tor, ∘C | TEM | Epitaxial Cu2O nm-high islands. |
| Leon 117 (2012) | – | Ar+ sputtering and ∘C heating | Torr, RT, pulse injection of air | AES, STM | Oxide growth from step edges. |
5.4 Nano-island formation kinetics
A number of models have been proposed to explain the kinetics governing the initial stages of oxide growth, from island nucleation to their coalescence.
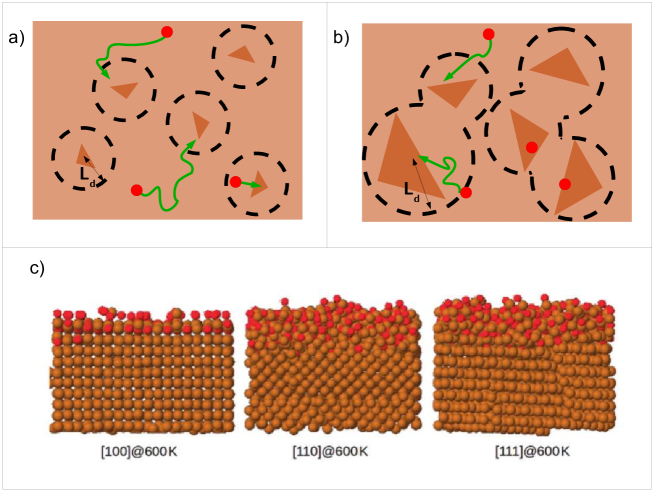
The mechanism of nucleation and initial growth of oxide islands on a clean Cu surface has been proposed in terms of ‘capture zones’, a well-established idea in non-homogeneous film formation theory 264, 265. In this interpretation, schematically shown in Fig. 10a, oxygen atoms landing in a capture zone, i.e. an area with radius surrounding the island, will likely aggregate with the island and contribute to island growth rather than nucleating new islands. Large ‘capture zones’ (i.e. large values of ) are associate with longer path lengths of surface oxygen diffusion. In this framework, the saturation number of islands that can be nucleated, , is expressed as 234:
| (1) |
where is the initial island nucleation rate and is time. This model was found to fit well experimental data for oxidation of Cu(100) and Cu(110) 234, 242, as shown in Table 5.4.
| [] | [] | ||
|---|---|---|---|
| (100) | 0.83 | 0.17 | 1.09 |
| (110) | 4.34 | 1.74 | 0.33 |
The smaller number of islands nucleating on Cu(100) is related to a larger oxygen capture area, i.e. longer path lengths for surface oxygen diffusion. This is consistent with the structure of the missing-row reconstructed Cu(100) surface, which is fairly smooth (it has a corrugation of 0.35 Å 138), see Sec. 4.1, thus favouring surface diffusion. Similarly, the short diffusion path length for Cu(110) is consistent with the added-row reconstruction which protrudes Å over the Cu surface 147, 121 (see Sec. 4.2). Nucleation is seen to be faster on Cu(110) than on Cu(100), see Table 5.4, and even faster on Cu(111) at C 256. The O-induced reconstruction of the Cu(111) surface has been reported to have a disordered surface overlayer at room temperature, with O and Cu atoms at different heights 207, 110 (see Sec 4.3). This could explain a shorter path length for oxygen diffusion on Cu(111) leading to a fast nucleation of a large number of oxide islands.
After island nucleation has reached saturation point, they start growing until coalescence. Island growth models based on oxygen impingement and surface diffusion (schematically represented in Fig. 10b) have been developed 266, 267, 233: oxygen surface diffusion initially dominates the oxide growth, and later oxygen direct impingement becomes significant when the oxide islands grow larger in size. In particular the model proposed by Yang et al. 233 was found to fit well experimental data on Cu(100), with island growth proportional to .
Another well established theory for the formation of thin films is the Avrami (or JMAK) nucleation model 268, 269, 270. It presumes isotropic and homogeneous nucleation of the islands and depends exponentially on time:
| (2) |
where is the oxide thickness. Cu(100) fits this model 242 with and . The value of is much smaller than expected (typically it is ), possibly because of the non-constant island nucleation in cuprous oxide (but rather following the relation in Eq. 1) and the non-linear island growth rate (). Yang et al. modified the JMAK model in order to take into account these two factors and found an excellent fit with Cu(100) experimental data 235.
Although the nucleation of islands is faster on Cu(110), the long term ( minutes) oxidation of the (100) surface of copper is much faster than on the (110) and (111) 262, 228, 230 surfaces. Fast initial nucleation and growth of islands on Cu(110) and Cu(111) leads quickly to a thinner coalesced film, which then continues growing through oxygen diffusion through the oxide layer, a much slower process than surface diffusion. On the contrary, the slow nucleation of islands on Cu(100) leads to slower coalescence to a thicker oxide film with respect to the Cu(110) and Cu(111) and thus quicker oxide growth by means of surface diffusion.
The case of oxidation on Cu(111) at higher temperatures (over ∘C) is the only one where Cu2O two-dimensional thin film growth is observed 256, 117. The O-induced surface reconstruction of Cu(111) at high temperatures, as seen on Sec. 4.3, has a hexagonal morphology similar to the Cu2O(111) plane 207, 110 which can act as a ‘template’ structure for the layered growth of the oxide.
A few computational studies have tried to obtain further insight into the kinetics of oxide growth, with limited success so far. The correct relative rates on the three low-index Cu surfaces have been obtained using molecular dynamics with ReaxFF, a bond order potential 271. However the calculation led to the formation of a uniform amorphous thin film (as shown in Fig. 10c), thus not reproducing crystalline island formation as seen in experiments, and the role of the surface reconstruction was not taken into account.
As already mentioned, Devine et al. 251, looked to reproduce oxidation on an O-reconstructed Cu(100) surface, using molecular dynamics and a bond order potential. However, the process was too slow and the simulation too short for it to be modelled.
5.5 Long-term copper oxidation
After nucleation, growth and coalescence of copper oxide islands, oxidation proceeds through the diffusion of oxygen atoms through the oxide and the character of the oxidation process changes.
The kinetics and mechanism of copper oxidation, after the exposure of the copper surface to oxygen flow for an extended period (up to 32 hours) have been extensively studied 14, 272, 273, however no consensus on a single rate law describing the oxidation dynamics has been established.
Clean copper surfaces have been found to oxidize at different rates, with the Cu(100) face reported to have the fastest rate of oxidation, at odds with the oxidation rates measured for the formation and growth of oxide nano-islands. Indeed, Young 228 et al. and Gwathmey 229 et al. found that the order of oxidation rate for the low-index surfaces is (100), (111), (110) with (100) the fastest oxidising facet, for a wide range of temperatures. Rhodin 274 found instead the order to be (100), (110), (111) with (100). This difference in ordering could be due to several factors, for example the use of very different experimental analysis techniques. Gwathmey 229 et al. used diffuse white light to analyse the oxidized surfaces, observing different interference colours corresponding to different oxide thicknesses, Young 228 et al. used ellipsometry which relies on a ‘guess’ of a surface model and Rhodin 274 calculated the film thickness from weight changes in the sample. All three methods present some drawbacks (diffuse white light does not provide a value for the thickness and relies on visual checking of the surface colour, ellipsometry relies on a guess model and Rhodin’s method depends on an accurate estimation of the effective area of the resulting oxide) and it is difficult to tell which of the three is more reliable. The difference observed could also be the result of environmental factors such as the presence of impurities or different sample preparations, which have been shown to lead to different resulting metal oxides 275, 276 which makes oxidizing metals very challenging to study.
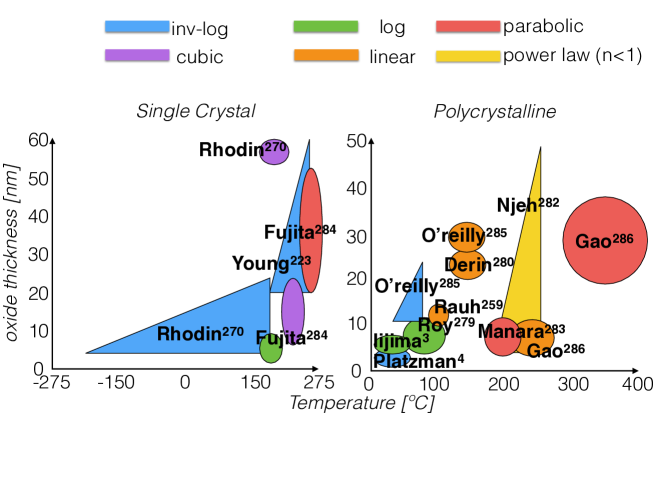
Very large discrepancies are observed in models for oxidation rates, i.e. growth of thickness of the oxide as a function of time, and they are summarised in Fig 11. A number of theories have been proposed 277, 278, 279, 280, mostly based on the Cabrera and Mott 281 theory and they postulate that, under the assumption of uniform epitaxial growth, the thickness of a metal oxide increases following an inverse logarithmic rate law for very thin films (up to nm for Cu) and a cubic law for thicker films (up to m). A number of works 274, 282, 228, 283 find qualitative agreement with the Cabrera-Mott theory, however linear oxide growth has been observed in other studies 263, 284, 285, as well as power () 286 or parabolic law 287.
Many factors can affect the experimental measurements of oxide kinetics, such as the environment and the type of initial copper sample. Indeed, it was found that polycrystalline film oxidation kinetics is almost twice as slow as single crystal oxidation kinetics 285. The oxidation temperature is another factor 288, 289, 290. O’Reilly 289 et al. found for a polycrystalline sample in dry synthetic air (O2/Ar mixture) that at temperatures between and ∘C the oxidation followed a cubic law, at ∘C an inverse log rate and at ∘C a linear growth rate. Gao 290 et al. found a linear oxidation rate between ∘C with a fine-grained Cu2O being the resultant oxide, and parabolic above that, with CuO the final oxidation product.
Although a lot of work has been performed in this field, it is clear from Fig. 11 that there is no consistency in the results obtained. Systematic work looking at the influence of crystal structure (single crystal, polycrystalline, different grain size), of the experimental set-up (humidity, temperature, oxygen pressure) and composition of the oxide product need to be performed in order to clarify where the contributions to these different oxidation rates originate from.
5.6 Native oxidation of copper in ambient conditions
Structural details of the room temperature oxidation of copper under ambient conditions, including the possible influence of humidity and crystal structure, are not very clear.
In order to study copper in ambient conditions (room-temperature, 1 atm pressure) precise measurement techniques are required, since surface oxide films are generally only a few nm thick. Experiments studying oxidation in these conditions have been performed for an enormous range of exposure times, between 30 minutes to 9 months, in air at ambient conditions (referred to as ambient air hereafter), obtaining results which are not always consistent (see Table LABEL:table:native). As we will see, the outcome of the studies differs in the thickness of the final oxide, in the presence or not of a CuO overlayer on top of the Cu2O oxide layer and in the order of formation of the oxides. The reason for this non-uniformity is probably to be found in the method of preparation of the film, on the type of film used (thin/bulk, polycrystalline/single crystal), the ambient humidity (which is rarely reported) and the surface roughness.
Native oxidation has been extensively studied in copper thin films (of the order of a few hundred nms), because of the important role it plays in the passivation of nano-sized electronic copper parts, using XAS and XPS to identify the composition of the top layer and ellipsometry to measure the film thickness. Platzman et al. 4 proposed a three-stage oxidation mechanism involving: (a) the formation of a Cu2O layer, most likely due to Cu metal ionic transport toward the oxide-oxygen interface; (b) the formation of a Cu(OH)2 metastable overlayer, due to the interactions of Cu ions with hydroxyl groups present at the surface; and (c) the transformation of the Cu(OH)2 metastable phase to a more stable CuO layer. Indeed, the formation of a Cu2O layer first, followed by a CuO overlayer has been reported 4, 3, 291, 292. However, Lim et al. 276 showed that the texture and microstructure of a thin copper film have a direct influence on the oxidation products. When oxidising a sample with a columnar structure and small grains the Cu2O/CuO bylayer was obtained, when oxidising a uniform sample with no obvious columnar structure and grain boundaries the cuprous oxide layer only was observed and oxidation was slower.
The oxidation of bulk copper studies was studied by means of XPS, XRD and ellipsometry, and the results obtained are mixed. A number of studies 3, 293, 294 found only the formation of nm thick Cu2O even after long exposure times. However, other studies of passivated Cu after exposure at room-temperature air 2, 295 observed the formation of a few ML of CuO, which was found to start growing only after the Cu2O growth process has finished. The different results obtained by these experiments can be due to the texture and microstructure of the copper film 276, by the surface roughness or by defects present at the surface. Indeed, the surface roughness of metal oxide surfaces has been shown to have a direct influence on their wetting properties towards water, which in turn could have a direct influence on the formation of the native oxide 296. In particular, very smooth copper surfaces are hydrophobic while rough surfaces ( nm-high roughness) are hydrophilic 297. Furthermore the orientation of the crystallites at the surface influences the wetting properties and the distribution and coverage of water on the surface, especially in the case of copper 298. Moreover, polycrystalline structures with nanosized grains have higher surface energy at the grain boundaries than structures that are made of micrometric grains or crystalline lattice, which in turns affect the wettability of the surface.
| Author | Cu thickness | Environment | Surface treatment | Exposure time | Technique | Resulting oxide structure |
| Barr 2 (1978) | Commercial film | RT air, humidity | Sputter etching | min/days | ESCA spectrometry | nm Cu2O/a few ML CuO- nm Cu2O |
| Chawla 293 (1992) | Commercial film | Air | Electropolishing | 24h in a desiccator | XPS | nm Cu2O layer. |
| Chu 294 (1999) | Commercial film | RT air | Electropolishing | 23h | XRD | Cu2O only (both in air and in solution) |
| Iijima 3 (2006) | Cu bulk 0.5mm/ Cu film | RT air | Electrochemical polishing, annealing in dry H at 600°. | 30 min- 1300h | XPS/ ellipsometry | Cu2O only on Cu bulk, outer CuO film on the Cu thin film |
| Keil 292, 291 (2010) | 90 nm | RT air | DC sputtering on glass. | 48h/9months | XAS | Oxide bilayer: 2.0 nm CuOover 3.5 nm Cu2O |
| Lim 276 (2008) | 100 nm | RT air, humidity | ion beam deposition, argon ion sputtering | 30 min/1280h | XPS, SEM, HRTEM | Cu deposited with V bias voltage at the substrate shows both Cu2O and CuO, with V only Cu2O. |
| O’Reilly 289 (1995) | bulk (2mm), film:80-500 nm | T=50-150, dry synthetic air. | Bulk: ground surfaces. Film: electroless deposition, sputtering. | 300 min | TGA, XRD | ∘C, only Cu2O, ∘C, Cu2O and CuO. |
| Platzman 4 (2008) | nm | RT air, humidity. | Thermal filament evaporation deposition on Si wafers. | 1h-112 days | XPS, TEM, SEM | After 1h only Cu2O observed, CuO starts occurring after 24h. |
| Suzuki 295 (1997) | 0.5mm | RT air | Electrolytical polishing | 10min-12d | XPS | and oxidation states present. |
5.7 Nucleation sites
A number of studies have tried to establish the role of surface defects on the nucleation of the oxide, in order to understand whether island nucleation is a heterogeneous process, triggered by specific surface features, or a homogeneous process. While some metals and semimetals can grow oxide layers homogeneously without the aid of impurities or surface defects (such as Ru(0001) 244, Ag(110) 243 or Si(111) 299, 300) it has been shown that other metals, like Pb 301 or Ge(111) 302, 303, cannot oxidise without the presence of surface features (impurities or defects) which trigger the dissociation of O2 molecules.
For copper it has been shown 114, 255, 161, 209 that defect sites play a role in oxide island nucleation. Grain boundaries 255, vacancy islands 209 and the edges of pits 254 are found to be nucleating sites for island formation, however no preferential nucleation sites have been found at dislocations, stacking faults or impurities 254, 113, 255. The importance of step edges was initially inferred by Milne and Howie 232, and it was then demonstrated on Cu(111) by means of STM and TEM 117, 209. However, TEM work by Yang et al. 254, 255 showed that this is not the case on Cu(100) and Cu(110) films. It is indeed possible, considering the different nature of oxide formation on the three low-index surfaces, that different defects play a more or less important role in different oxide nucleation conditions.
More work is needed to clarify further the correlation between defect sites and oxide formation and remove doubts on whether small, non-structured dislocations and impurities have a role in the nucleation of copper oxide islands, and, from a theory point of view, why some type of defects seem more efficient at nucleating oxide islands than others.
5.8 CuO formation
CuO is expected to form after exposure of a copper surface to oxygen at high temperatures and pressure 39, 225. Much work has gone into understanding high temperature oxidation of copper () and it has been recently reviewed 304, 305. Most work shows the growth of CuO on top of Cu2O, following a parabolic rate law for the thickness as a function of time. However, no studies of the atomistic details of the formation of CuO at high temperatures have been performed to date.
In controlled conditions, evidence of a CuO overlayer was found by exposing a Cu sample to a controlled flow of O2 at high pressure and the dependence of oxidation on oxygen pressure was analysed. Boggio 306 investigated the pressure dependence ( Torr) on the oxidation of Cu(111), and in particular the film thickness, using ellipsometry. The film growth (thought to be Cu2O), after minutes exposure at , was related to the Cabrera-Mott expression of growth. However, a dramatic decrease in the oxidation rate with increased oxygen pressure was observed and related to the formation of a passivating CuO film at the oxide-oxygen interface. Pierson 226 et al. looked at the reactivity of a number of noble metals when subject to a flow of gases. In the case of Cu in an O2 flow, the formation of oxidised structures was found to depend on the flow rate of O2. The formation of Cu2O (at oxygen partial pressure p(O2)= Torr), CuO (p(O2)= Torr) and metastable Cu4O3 (p(O2)= Torr), was observed by XRD analysis.
6 Conclusion and discussion
The oxidation of copper and the physical properties of the resulting oxides are fundamental scientific problems which are still not completely understood today. Since there has currently been a surge of interest in the use of copper oxide for catalysis, optoelectronics and gas sensing, the need for a detailed understanding of the surface structures of these oxides has become even more pressing. In addition, uncontrolled copper oxidation is still an issue in e.g. electronic applications, and understanding the oxide growth process is the first step towards mitigating it.
In this review we have discussed the state of the knowledge regarding the structure and formation of copper oxides and we have seen that the structural, optic and vibrational characteristics of bulk copper oxides are well understood. A good amount of computational work (mainly from DFT) has been performed on both Cu2O and CuO, providing important information on the structures of the surfaces at different temperature and pressure conditions. A hexagonal structure presenting Cu surface vacancies was found to be the most stable on Cu2O and the stoichiometric (111) surface was the most stable for CuO. Few experimental studies are available to either confirm or disprove these suggestions from theory. Considering the potential technological applications of these oxides, this is an area which should be looked at more with experimental techniques such as STM, XPS or LEED.
Many atomistic aspects of the formation of the oxides have been established. Indeed, the oxygen-induced surface reconstructions on copper surfaces with low Miller index are well known. In addition, STM studies have revealed certain atomic level details of the initial stages of Cu surface oxidation. Other experiments at low oxygen pressure show that the initial oxide growth happens through the formation of cuprous oxide islands which eventually coalesce. The kinetics of the oxide formation depends on the temperature and on the copper surface and it is dominated by oxygen surface diffusion and direct impingement in the first instance, and after coalescence by oxygen diffusion into the bulk.
There is however scope for further work as many fundamental aspects of copper oxidation are still unclear. In fact, there is no consensus on how the transition from oxygen-reconstructed copper surfaces to the onset of oxidation occurs, whether this is after the surface has been reconstructed or if the islands start forming on the clean surface. At least for the case of Cu(100) and Cu(110), there is good evidence that the onset of oxidation will occur after the formation of an O-reconstructed overlayer which affects the growth kinetics of the islands themselves. The precise understanding of the formation of these copper islands is not only important to understand the onset of oxidation, but also to exploit the oxide islands as nano-templates for technological applications. In order to do that, the precise mechanism of nucleation needs to be understood.
It is also unclear where the different behaviour between metals such as Ag or Al, which grow uniform oxide layers, and copper stems from. The O-induced surface reconstructions of different fcc metals have been extensively studied 121 and the differences found in their electronic structures 307 or surface configurations 308 could provide hints to their different behaviour upon higher exposure to oxygen. However, dedicated theoretical studies to this aim have not been performed so far.
The kinetics of long-term oxide growth, both in controlled conditions and in ambient air is an issue that remains poorly understood. Copper oxide formation does not simply follow the Cabrera-Mott law, especially at the initial stages when oxide growth is not uniform across the surface. Many studies have been performed in order to establish the oxide formation kinetics at low temperatures, however they are difficult to compare to one another, because of the different conditions in use. Indeed temperature, humidity, oxygen partial pressure, structure of the initial copper film/coupon, the presence of defects and impurities seem to affect the growth of the oxide as well as the final oxide product. Moreover, the structure of copper oxide when grown in ambient air, which is very important to the practical uses of copper, is still not clearly understood, with the formation of a CuO overlayer on top of a Cu2O layer still being debated. Further systematic experimental studies, looking at disentagling the environmental factors influencing oxide growth are needed. Computationally, additional studies of copper and copper oxide surfaces and their interaction with the environment (e.g. water, O2, N2) would provide valuable information in support of the experimental work. Work in this direction has recently been reported, e.g. water and hydroxide adsorption on Cu and Cu oxide 309, 310, 311, 312.
Part of the challenges that have been faced by scientists in studying these systems are due to the limitations of theoretical and experimental technology available to them. It is indeed clear that massive steps forward have been made since the first calorimetry experiments on Cu2O crystals, and nanometre scale resolution has been obtained with STM and TEM and structural atomistic structures can be explored with XPS and LEED. Moreover, development of experimental techniques, such as X-ray lasers with extremely high spatial and temporal resolution 313 or near-ambient pressure photoelectron spectroscopy 314 might enable mechanisms of initial stages of oxidation to be explored.
Computational techniques also present challenges from the point of view of accuracy of calculated structures and physical properties, as well as time length of molecular dynamics simulations. Moreover developments in theory, especially ab initio molecular dynamics, accelerated sampling techniques and more sophisticated non ab initio approaches mean that similar studies on the first steps of oxidation are possible. Ab initio molecular dynamics, along with a free energy sampling approach has been used to examine the initial stages of NaCl dissolution in liquid water nacl_diss: it is not inconceivable that similar techniques could be applied to copper oxidation in ambient and even aqueous conditions.
Finally, another important challenge, is bridging the gap between highly controlled studies performed in ultra-high vacuum and work aiming to understand the formation of the oxide in industrially relevant conditions. At the moment, these two aspects of the oxidation problem are addressed using different techniques at different resolutions. In order to fully understand the oxidation of copper it is important to be able to relate the results obtained in these different conditions to one another and build a unified picture of the problem.
Acknowledgements
A.M.’s work is partly supported by the European Research Council under the European Union’s Seventh Framework Programme (FP/2007-2013)/ERC Grant Agreement No. 616121 (HeteroIce project) and the Royal Society through a Wolfson Research Merit Award.
References
- Miodownik 2014 M. Miodownik, Stuff Matters: The Strange Stories of the Marvellous Materials that Shape Our Man-made World, Penguin, 2014.
- Barr 1977 T. L. Barr, J. Vac. Sci. Tech., 1977, 14, 660.
- Iijima et al. 2006 J. Iijima, J. W. Lim, S. H. Hong, S. Suzuki, K. Mimura and A. Isshiki, Appl. Surf. Sci., 2006, 253, 2825.
- Platzman et al. 2008 I. Platzman, R. Brener, H. Haick and R. Tannenbaum, J. Phys. Chem. C, 2008, 112, 1101.
- Song et al. 2012 J. Song, L. L. Wang, A. Zibart and C. Koch, Metals, 2012, 2, 450.
- Szakalos et al. 2007 P. Szakalos, G. Hultquist and G. Wikmark, Electrochem. Sol. St. Lett., 2007, 10, C63.
- Reitz and Solomon 1998 J. B. Reitz and E. I. Solomon, J. Am. Chem. Soc., 1998, 120, 11467.
- Nakamura et al. 1990 Y. Nakamura, H. Yoshioka, M. Miyayama, H. Yanagida, T. Tsurutani and Y. Nakamura, J. Electrochem. Soc., 1990, 137, 940.
- Rai 1988 B. Rai, Solar Cells, 1988, 25, 265.
- Meyer et al. 2012 B. K. Meyer, A. Polity, D. Reppin, M. Becker, P. Hering, P. J. Klar, T. Sander, C. Reindl, J. Benz, M. Eickhoff, C. Heiliger, M. Heinemann, J. Blaesing, A. Krost, S. Shokovets, C. Mueller and C. Ronning, Physica Stat. Sol. B, 2012, 249, 1487.
- Hunter and Fowle 1956 M. S. Hunter and P. Fowle, J. Electrochem. Soc., 1956, 103, 482.
- Lu et al. 1996 H. Lu, E. Gusev, E. Garfunkel and T. Gustafsson, Surf. Sc., 1996, 351, 111.
- Palacio and Mathieu 1990 C. Palacio and H. J. Mathieu, Surf. Interf. Anal., 1990, 16, 178.
- Lawless 1974 K. R. Lawless, Rep. Prog. Phys., 1974, 37, 231.
- Freund et al. 1996 H. J. Freund, H. Kuhlenbeck and V. Staemmler, Rep. Prog. Phys., 1996, 59, 283.
- Diebold et al. 2010 U. Diebold, S. C. Li and M. Schmid, in Annual Review Of Physical Chemistry, ed. S. Leone, P. Cremer, J. Groves, M. Johnson and G. Richmond, Annual Reviews, 2010, vol. 61, p. 129.
- Somorjai 1994 G. A. Somorjai, Introduction to Surface Chemistry and Catalysis, Wiley, 1994.
- Gross 2003 A. Gross, Theoretical Surface Science: A Microscopic Perspective ; with 11 Tables and 32 Exercises, Springer, 2003.
- Wandelt 2012 K. Wandelt, Surface and Interface Science, Wiley, 2012.
- Bracco and Holst 2013 G. Bracco and B. Holst, Surf. Sci. Techniques, Springer, 2013.
- Frenkel and Smit 2002 D. Frenkel and B. Smit, Understanding Molecular Simulation: From Algorithms to Applications, Academic Press, 2002.
- Behler 2009 J. Behler, in Multiscale Simulation Methods in Molecular Sciences, ed. J. Grotendorst, N. Attig, S. Bluegel and D. Marx, Julich Supercomputing Centre, 2009, vol. 42, p. 247.
- Szlachta et al. 2014 W. J. Szlachta, A. P. Bartók and G. Csányi, Phys. Rev. B, 2014, 90, 104108.
- van Duin et al. 2001 A. C. T. van Duin, S. Dasgupta, F. Lorant and W. A. Goddard, J. Phys. Chem. A, 2001, 105, 9396.
- Warshel and Levitt 1976 A. Warshel and M. Levitt, J. Mol. Biol., 1976, 103, 227.
- Friesner 2005 R. A. Friesner, Proc. Nat. Acad. Sc., 2005, 102, 6648.
- Kohn and Sham 1965 W. Kohn and L. J. Sham, Phys. Rev., 1965, 140, A1133.
- Hohenberg and Kohn 1964 P. Hohenberg and W. Kohn, Phys. Rev., 1964, 136, B864.
- Brazdova and Bowler 2013 V. Brazdova and D. R. Bowler, Atomistic Computer Simulations: A Practical Guide, Wiley, 2013.
- Curtarolo et al. 2013 S. Curtarolo, G. L. W. Hart, M. B. Nardelli, N. Mingo, S. Sanvito and O. Levy, Nat. Mat., 2013, 12, 191.
- Burke 2012 K. Burke, J. Chem. Phys., 2012, 136, 150901.
- Himmetoglu et al. 2014 B. Himmetoglu, A. Floris, S. de Gironcoli and M. Cococcioni, Int. J. Quant. Chem., 2014, 114, 14.
- Perdew and Zunger 1981 J. P. Perdew and A. Zunger, Phys. Rev. B, 1981, 23, 5048.
- Heyd et al. 2003 J. Heyd, G. E. Scuseria and M. Ernzerhof, J. Chem. Phys., 2003, 118, 8207.
- Paier et al. 2005 J. Paier, R. Hirschl, M. Marsman and G. Kresse, J. Chem. Phys., 2005, 122, 234102.
- Aryasetiawan and Gunnarsson 1998 F. Aryasetiawan and O. Gunnarsson, Rep. Prog. Phys., 1998, 61, 237.
- Slater 1930 J. C. Slater, Phys. Rev., 1930, 35, 210.
- Slater and Koster 1954 J. C. Slater and G. F. Koster, Phys. Rev., 1954, 94, 1498.
- Honjo 1949 G. Honjo, J. Phys. Soc. Japan, 1949, 4, 330.
- Tandon and Gupta 1970 S. P. Tandon and J. P. Gupta, Phys. Stat. Sol., 1970, 37, 43.
- Ghijsen et al. 1988 J. Ghijsen, L. H. Tjeng, J. Vanelp, H. Eskes, J. Westerink, G. A. Sawatzky and M. T. Czyzyk, Phys. Rev. B, 1988, 38, 11322.
- Bohnen et al. 2009 K. P. Bohnen, R. Heid, L. Pintschovius, A. Soon and C. Stampfl, Phys. Rev. B, 2009, 80, 134304.
- Mittal et al. 2007 R. Mittal, S. L. Chaplot, S. K. Mishra and P. P. Bose, Phys. Rev. B, 2007, 75, 174303.
- Hallil et al. 2014 A. Hallil, J.-M. Raulot and M. Cherkaoui, Comp. Mat. Sci., 2014, 81, 366.
- Robertson 1983 J. Robertson, Phys. Rev. B, 1983, 28, 3378.
- Sanson 2011 A. Sanson, Sol. State Comm., 2011, 151, 1452.
- Islam et al. 2009 M. M. Islam, B. Diawara, V. Maurice and P. Marcus, J. Mol. Struct.-Theochem, 2009, 903, 41.
- Martinez-Ruiz et al. 2003 A. Martinez-Ruiz, M. G. Moreno and N. Takeuchi, Sol. State Sci., 2003, 5, 291.
- Soon et al. 2006 A. Soon, M. Todorova, B. Delley and C. Stampfl, Phys. Rev. B, 2006, 73, 165424.
- Ruiz et al. 1997 E. Ruiz, S. Alvarez, P. Alemany and R. A. Evarestov, Phys. Rev. B, 1997, 56, 7189.
- Raebiger et al. 2007 H. Raebiger, S. Lany and A. Zunger, Phys. Rev. B, 2007, 76, 045209.
- Laskowski et al. 2003 R. Laskowski, P. Blaha and K. Schwarz, Phys. Rev. B, 2003, 67, 8.
- Filippetti and Fiorentini 2005 A. Filippetti and V. Fiorentini, Phys. Rev. B, 2005, 72, 8.
- Onsten et al. 2009 A. Onsten, M. Gothelid and U. O. Karlsson, Surf. Sci., 2009, 603, 257.
- Hu et al. 2008 J. P. Hu, D. J. Payne, R. G. Egdell, P. A. Glans, T. Learmonth, K. E. Smith, J. Guo and N. M. GHarrison, Phys. Rev. B, 2008, 77, 155115.
- van Schilfgaarde et al. 2006 M. van Schilfgaarde, T. Kotani and S. Faleev, Phys. Rev. Lett., 2006, 96, 226402.
- Cortona and Mebarki 2011 P. Cortona and M. Mebarki, J. Phys.-Cond. Mat., 2011, 23, 8.
- Gordienko et al. 2007 A. B. Gordienko, Y. N. Zhuravlev and D. G. Fedorov, Phys. Sol. State, 2007, 49, 223.
- Nie et al. 2002 X. L. Nie, S. H. Wei and S. B. Zhang, Phys. Rev. B, 2002, 65, 075111.
- Heinemann et al. 2013 M. Heinemann, B. Eifert and C. Heiliger, Phys. Rev. B, 2013, 87, 5.
- Tran and Blaha 2011 F. Tran and P. Blaha, Phys. Rev. B, 2011, 83, 235118.
- Isseroff and Carter 2012 L. Y. Isseroff and E. A. Carter, Phys. Rev. B, 2012, 85, 235142.
- Le et al. 2009 D. Le, S. Stolbov and T. S. Rahman, Surf. Sci., 2009, 603, 1637.
- Soon et al. 2005 A. Soon, T. Sohnel and H. Idriss, Surf. Sci., 2005, 579, 131.
- Scanlon et al. 2009 D. O. Scanlon, B. J. Morgan, G. W. Watson and A. Walsh, Phys. Rev. Lett., 2009, 103, 096405.
- Bruneval et al. 2006 F. Bruneval, N. Vast, L. Reining, M. Izquierdo, F. Sirotti and N. Barrett, Phys. Rev. Lett., 2006, 97, 4.
- Kotani et al. 2007 T. Kotani, M. van Schilfgaarde and S. V. Faleev, Phys. Rev. B, 2007, 76, 165106.
- Lany 2013 S. Lany, Phys. Rev. B, 2013, 87, 085112.
- Noguera 2000 C. Noguera, J. Phys. Cond. Mat., 2000, 12, R367.
- Schulz and Cox 1991 K. H. Schulz and D. F. Cox, Phys. Rev. B, 1991, 43, 1610.
- Islam et al. 2010 M. M. Islam, B. Diawara, V. Maurice and P. Marcus, Surf. Sci., 2010, 604, 1516.
- Nygren et al. 1996 M. A. Nygren, L. G. M. Pettersson, A. Freitag, V. Staemmler, D. H. Gay and A. L. Rohl, J. Phys. Chem., 1996, 100, 294.
- McClenaghan et al. 2000 N. D. McClenaghan, P. J. Hu and C. Hardacre, Surf. Sci., 2000, 464, 223.
- Islam et al. 2009 M. M. Islam, B. Diawara, V. Maurice and P. Marcus, Surf. Sci., 2009, 603, 2087.
- Li et al. 2011 M. Li, J. Y. Zhang, Y. Zhang, G. F. Zhang and T. M. Wang, Appl. Surf. Sci., 2011, 257, 10710.
- Li et al. 2010 C. Li, F. Wang, S. F. Li, Q. Sun and Y. Jia, Phys. Lett. A, 2010, 374, 2994.
- Soon et al. 2007 A. Soon, M. Todorova, B. Delley and C. Stampfl, Phys. Rev. B, 2007, 75, 125420.
- Soon et al. 2007 A. Soon, M. Todorova, B. Delley and C. Stampfi, Surf. Sci., 2007, 601, 5809.
- Reuter and Scheffler 2002 K. Reuter and M. Scheffler, Phys. Rev. B, 2002, 65, 035406.
- Lozovoi et al. 2001 A. T. Lozovoi, A. Alavi and M. W. Finnis, Comp. Phys. Comm., 2001, 137, 174.
- Asbrink and Norrby 1970 S. Asbrink and L. J. Norrby, Acta Crystallogr. Sec. B, 1970, B 26, 8.
- Ray 2001 S. C. Ray, Sol. En. Mat. And Sol. Cells, 2001, 68, 307.
- Hardee and Bard 1977 K. L. Hardee and A. J. Bard, J. Electrochem. Soc., 1977, 124, 215.
- Koffyberg and Benko 1982 F. P. Koffyberg and F. A. Benko, J. Appl. Phys., 1982, 53, 1173.
- Marabelli et al. 1995 F. Marabelli, G. B. Parravicini and F. Salghettidrioli, Phys. Rev. B, 1995, 52, 1433.
- Forsyth et al. 1988 J. B. Forsyth, P. J. Brown and B. M. Wanklyn, J. Phys. C, 1988, 21, 2917.
- Yang et al. 1988 B. X. Yang, J. M. Tranquada and G. Shirane, Phys. Rev. B, 1988, 38, 174.
- Brown et al. 1991 P. J. Brown, T. Chattopadhyay, J. B. Forsyth, V. Nunez and F. Tasset, J. Phys.-Cond. Mat., 1991, 3, 4281.
- Ain et al. 1992 M. Ain, A. Menelle, B. M. Wanklyn and E. F. Bertaut, J. Phys.-Cond. Mat., 1992, 4, 5327.
- Peng et al. 2012 Y. Peng, Z. Zhang, T. V. Pham, Y. Zhao, P. Wu and J. L. Wang, J. Appl. Phys., 2012, 111, 5.
- Debbichi et al. 2012 L. Debbichi, M. C. M. de Lucas, J. F. Pierson and P. Kruger, J. Phys. Chem. C, 2012, 116, 10232.
- Hu et al. 2010 J. Hu, D. D. Li, J. G. Lu and R. Q. Wu, J. Phys. Chem. C, 2010, 114, 17120.
- Wu et al. 2006 D. X. Wu, Q. M. Zhang and M. Tao, Phys. Rev. B, 2006, 73, 6.
- Reichardt et al. 1990 W. Reichardt, F. Gompf, M. Ain and B. M. Wanklyn, Zeitschrift Fur Physik B, 1990, 81, 19.
- Dar et al. 2009 M. A. Dar, Q. Ahsanulhaq, Y. S. Kim, J. M. Sohn, W. B. Kim and H. Shin, Appl. Surf. Sci., 2009, 255, 6279.
- Chen et al. 1995 X. K. Chen, J. C. Irwin and J. P. Franck, Phys. Rev. B, 1995, 52, 13130.
- Kliche and Popovic 1990 G. Kliche and Z. V. Popovic, Phys. Rev. B, 1990, 42, 10060.
- Anisimov et al. 1991 V. I. Anisimov, J. Zaanen and O. K. Andersen, Phys. Rev. B, 1991, 44, 943.
- Ekuma et al. 2014 C. E. Ekuma, A. V. I., M. J. and J. M., Europ. Phys. J. B, 2014, 87, 23.
- Jiang et al. 2013 P. Jiang, D. Prendergast, F. Borondics, S. Porsgaard, L. Giovanetti, E. Pach, J. Newberg, H. Bluhm, F. Besenbacher and M. Salmeron, J. Chem. Phys., 2013, 138, 024704.
- Nolan and Elliott 2006 M. Nolan and S. D. Elliott, Phys. Chem. Chem. Phys., 2006, 8, 5350.
- Svane and Gunnarsson 1990 A. Svane and O. Gunnarsson, Phys. Rev. Lett., 1990, 65, 1148.
- Szotek et al. 1993 Z. Szotek, W. M. Temmerman and H. Winter, Phys. Rev. B, 1993, 47, 4029.
- Pierson et al. 2003 J. F. Pierson, A. Thobor-Keck and A. Billard, Appl. Surf. Sci., 2003, 210, 359.
- Dudarev et al. 1998 S. L. Dudarev, G. A. Botton, S. Y. Savrasov, C. J. Humphreys and A. P. Sutton, Phys. Rev. B, 1998, 57, 1505.
- Zhang et al. 2014 Q. Zhang, K. Zhang, D. Xu, G. Yang, H. Huang, F. Nie, C. Liu and S. Yang, Progr. Mat. Sci., 2014, 60, 208.
- Warren et al. 1999 S. Warren, W. R. Flavell, A. G. Thomas, J. Hollingworth, P. L. Wincott, A. F. Prime, S. Downes and C. K. Chen, J. Phys.-Cond. Mat., 1999, 11, 5021.
- Maimaiti et al. 2014 Y. Maimaiti, M. Nolan and S. D. Elliott, Phys. Chem. Chem. Phys., 2014, 16, 3036.
- Monte et al. 2014 M. Monte, D. Gamarra, A. Lopez Camara, S. B. Rasmussen, N. Gyorffy, Z. Schay, A. Martinez-Arias and J. C. Conesa, Catalysis Today, 2014, 229, 104.
- Jensen et al. 1992 F. Jensen, F. Besenbacher and I. Stensgaard, Surf. Sci., 1992, 269, 400.
- Johnston et al. 2002 S. M. Johnston, A. Mulligan, V. Dhanak and M. Kadodwala, Surf. Sci., 2002, 519, 57.
- Crljen et al. 2003 Z. Crljen, P. Lazic, D. Sokcevic and R. Brako, Phys. Rev. B, 2003, 68, 195411.
- Heinemann et al. 1975 K. Heinemann, D. B. Rao and D. L. Douglass, Oxid. Met., 1975, 9, 379.
- Dubois 1982 L. H. Dubois, Surf. Sci., 1982, 119, 399.
- Yang et al. 1998 J. C. Yang, M. Yeadon, B. Kolasa and J. M. Gibson, Microsc. and Microanal., 1998, 4, 334.
- Lahtonen et al. 2008 K. Lahtonen, M. Hirsimaki, M. Lampimaki and M. Valden, J. Chem. Phys., 2008, 129, 124703.
- Leon et al. 2012 C. P. Leon, C. Surgers and H. von Lohneysen, Phys. Rev. B, 2012, 85, 035434.
- Lee and McGaughey 2011 M. Lee and A. J. H. McGaughey, Phys. Rev. B, 2011, 83, 165447.
- Zhou et al. 2012 G. W. Zhou, L. Luo, L. Li, J. Ciston, E. A. Stach and J. C. Yang, Phys. Rev. Lett., 2012, 109, 235502.
- Rous 1995 P. J. Rous, in Cohesion and Structure of Surfaces, ed. F. de Boer and D. Pettifor, North-Holland, 1995, vol. 4, p. 1.
- Besenbacher and Nørskov 1993 F. Besenbacher and J. K. Nørskov, Progr. Surf. Sci., 1993, 44, 5.
- Sun 2001 C. Q. Sun, Surf. Rev. Lett., 2001, 8, 367.
- Lederer et al. 1993 T. Lederer, D. Arvanitis, G. Comelli, L. Troger and K. Baberschke, Phys. Rev. B, 1993, 48, 15390.
- Alatalo et al. 2004 M. Alatalo, S. Jaatinen, P. Salo and K. Laasonen, Phys. Rev. B, 2004, 70, 6.
- Chen et al. 2006 W. K. Chen, C. H. Lu, Z. H. Chen, Y. Li and J. Q. Li, Chin. J. Chem. Phys., 2006, 19, 54.
- Duan et al. 2010 X. Duan, O. Warschkow, A. Soon, B. Delley and C. Stampfl, Phys. Rev. B, 2010, 81, 075430.
- Yagyu et al. 2009 K. Yagyu, X. Liu, Y. Yoshimoto, K. Nakatsuji and F. Komori, J. Phys. Chem. C, 2009, 113, 5541.
- Puisto et al. 2005 A. Puisto, H. Pitkanen, M. Alatalo, S. Jaatinen, P. Salo, A. S. Foster, T. Kangas and K. Laasonen, Catalysis Today, 2005, 100, 403.
- Rajumon et al. 1990 M. K. Rajumon, K. Prabhakaran and C. N. R. Rao, Surf. Sci., 1990, 233, L237.
- Spitzer and Luth 1982 A. Spitzer and H. Luth, Surf. Sci., 1982, 118, 136.
- Yokoyama et al. 1993 T. Yokoyama, D. Arvanitis, T. Lederer, M. Tischer, L. Troger, K. Baberschke and G. Comelli, Phys. Rev. B, 1993, 48, 15405.
- Katayama et al. 2007 T. Katayama, D. Sekiba, K. Mukai, Y. Yamashita, F. Komori and J. Yoshinobu, J. Phys. Chem. C, 2007, 111, 15059.
- Fujita et al. 1996 T. Fujita, Y. Okawa, Y. Matsumoto and K. Tanaka, Phys. Rev. B, 1996, 54, 2167.
- Arvanitis et al. 1993 D. Arvanitis, G. Comelli, T. Lederer, H. Rabus and K. Baberschke, Chem. Phys. Lett., 1993, 211, 53.
- Sotto 1992 M. Sotto, Surf. Sci., 1992, 260, 235.
- Kittel et al. 2001 M. Kittel, M. Polcik, R. Terborg, J. T. Hoeft, P. Baumgartel, A. M. Bradshaw, R. L. Toomes, J. H. Kang, D. P. Woodruff, M. Pascal, C. L. A. Lamont and E. Rotenberg, Surf. Sci., 2001, 470, 311.
- Zeng et al. 1989 H. C. Zeng, R. A. Mcfarlane and K. A. R. Mitchell, Surf. Sci., 1989, 208, L7.
- Jensen et al. 1990 F. Jensen, F. Besenbacher, E. Laegsgaard and I. Stensgaard, Phys. Rev. B, 1990, 42, 9206.
- Woll et al. 1990 C. Woll, R. J. Wilson, S. Chiang, H. C. Zeng and K. A. R. Mitchell, Phys. Rev. B, 1990, 42, 11926.
- Leibsle 1995 F. M. Leibsle, Surf. Sci., 1995, 337, 51.
- Yata et al. 1997 M. Yata, H. Rouch and K. Nakamura, Phys. Rev. B, 1997, 56, 10579.
- Wuttig et al. 1989 M. Wuttig, R. Franchy and H. Ibach, Surf. Sci., 1989, 213, 103.
- Wuttig et al. 1989 M. Wuttig, R. Franchy and H. Ibach, Surf. Sci., 1989, 224, L979.
- Robinson et al. 1990 I. K. Robinson, E. Vlieg and S. Ferrer, Phys. Rev. B, 1990, 42, 6954.
- Liu et al. 1995 W. Liu, K. C. Wong, H. C. Zeng and K. A. R. Mitchell, Progr. in Surf. Sci., 1995, 50, 247.
- Bonini et al. 2006 N. Bonini, A. Kokalj, A. Dal Corso, S. de Gironcoli and S. Baroni, Surf. Sci., 2006, 600, 5074.
- Tanaka et al. 1998 K. Tanaka, Y. Matsumoto, T. Fujita and Y. Okawa, Appl. Surf. Sci., 1998, 130, 475.
- Iddir et al. 2007 H. Iddir, D. D. Fong, P. Zapol, P. H. Fuoss, L. A. Curtiss, G. W. Zhou and J. A. Eastman, Phys. Rev. B, 2007, 76, 241404.
- Saidi et al. 2012 W. A. Saidi, M. Lee, L. Li, G. W. Zhou and A. J. H. McGaughey, Phys. Rev. B, 2012, 86, 245429.
- Harrison et al. 2006 M. J. Harrison, D. P. Woodruff, J. Robinson, D. Sander, W. Pan and J. Kirschner, Phys. Rev. B, 2006, 74, 165402.
- Tanaka et al. 1998 K. Tanaka, T. Fujita and Y. Okawa, Surf. Sci., 1998, 401, L407.
- Jaatinen et al. 2007 S. Jaatinen, M. Rusanen and P. Salo, Surf. Sci., 2007, 601, 1813.
- Jaatinen et al. 2007 S. Jaatinen, J. Blomqvist, P. Salo, A. Puisto, M. Alatalo, M. Hirsimaki, M. Ahonen and M. Valden, Phys. Rev. B, 2007, 75, 8.
- Colbourn and Inglesfield 1991 E. A. Colbourn and J. E. Inglesfield, Phys. Rev. Lett., 1991, 66, 2006.
- Stolbov and Rahman 2002 S. Stolbov and T. S. Rahman, J. Chem. Phys., 2002, 117, 8523.
- Stolbov and Rahman 2002 S. Stolbov and T. S. Rahman, Phys. Rev. Lett., 2002, 89, 116101.
- Stolbov et al. 2002 S. Stolbov, A. Kara and T. S. Rahman, Phys. Rev. B, 2002, 66, 245405.
- Merrick et al. 2004 I. Merrick, J. E. Inglesfield and H. Ishida, Surf. Sci., 2004, 551, 158.
- Kangas and Laasonen 2012 T. Kangas and K. Laasonen, Surf. Sci., 2012, 606, 192.
- Lee and McGaughey 2010 M. Lee and A. J. H. McGaughey, Surf. Sci., 2010, 604, 1425.
- Zhou et al. 2013 G. W. Zhou, L. Luo, L. Li, J. Ciston, E. A. Stach, W. A. Saidi and J. C. Yang, Chem. Comm., 2013, 49, 10862.
- Sun et al. 2007 L. D. Sun, M. Hohage, R. Denk and P. Zeppenfeld, Phys. Rev. B, 2007, 76, 245412.
- Feidenshansl et al. 1990 R. Feidenshansl, F. Grey, R. L. Johnson, S. G. J. Mochrie, J. Bohr and M. Nielsen, Phys. Rev. B, 1990, 41, 5420.
- Parkin et al. 1990 S. R. Parkin, H. C. Zeng, M. Y. Zhou and K. A. R. Mitchell, Phys. Rev. B, 1990, 41, 5432.
- Sun et al. 2004 L. D. Sun, M. Hohage and P. Zeppenfeld, Phys. Rev. B, 2004, 69, 045407.
- Ertl 1967 G. Ertl, Surf. Sci., 1967, 6, 208.
- Kishimoto et al. 2008 S. Kishimoto, M. Kageshima, Y. Naitoh, Y. J. Li and Y. Sugawara, Surf. Sci., 2008, 602, 2175.
- Feidenhansl et al. 1990 R. Feidenhansl, F. Grey, M. Nielsen, F. Besenbacher, F. Jensen, E. Laegsgaard, I. Stensgaard, K. W. Jacobsen, J. K. Nórskov and R. L. Johnson, Phys. Rev. Lett., 1990, 65, 2027.
- Coulman et al. 1990 D. Coulman, J. Wintterlin, J. V. Barth, G. Ertl and R. J. Behm, Surf. Sci., 1990, 240, 151.
- Dorenbos et al. 1993 G. Dorenbos, M. Breeman and D. O. Boerma, Phys. Rev. B, 1993, 47, 1580.
- Liu et al. 1995 W. Liu, K. C. Wong and K. A. R. Mitchell, Surf. Sci., 1995, 339, 151.
- Liu et al. 2014 Q. Liu, L. Li, N. Cai, W. A. Saidi and G. W. Zhou, Surf. Sci., 2014, 627, 75.
- Carley et al. 2005 A. F. Carley, P. R. Davies and M. W. Roberts, Phil. Trans. Royal Soc. A, 2005, 363, 829.
- Coulman et al. 1990 D. Coulman, J. Wintterlin, J. V. Barth, G. Ertl and R. J. Behm, Surf. Sci., 1990, 240, 151.
- Chua et al. 1989 F. M. Chua, Y. Kuk and P. J. Silverman, Phys. Rev. Lett., 1989, 63, 386.
- Kuk et al. 1990 Y. Kuk, F. M. Chua, P. J. Silverman and J. A. Meyer, Phys. Rev. B, 1990, 41, 12393.
- Mocuta et al. 1999 D. Mocuta, J. Ahner, J. G. Lee, S. Denev and J. T. Yates, Surf. Sci., 1999, 436, 72.
- Li et al. 2014 L. Li, N. Cai, W. A. Saidi and G. W. Zhou, Chem. Phys. Lett., 2014, 613, 64.
- Jacobsen and Norskov 1990 K. W. Jacobsen and J. K. Norskov, Phys. Rev. Lett., 1990, 65, 1788.
- Liem et al. 1998 S. Y. Liem, G. Kresse and J. H. R. Clarke, Surf. Sci., 1998, 415, 194.
- Kern et al. 1991 K. Kern, H. Niehus, A. Schatz, P. Zeppenfeld, J. George and G. Comsafguif, Phys. Rev. Lett., 1991, 67, 855.
- Zhou and Yang 2003 G. W. Zhou and J. C. Yang, Surf. Sci., 2003, 531, 359.
- Blanchard et al. 2005 N. Blanchard, D. Martin and P. Weightman, Phys. Stat. Sol. C - Conferences and Critical Reviews, 2005, p. 4017.
- Buisset et al. 1996 J. Buisset, H. P. Rust, E. K. Schweizer, L. Cramer and A. M. Bradshaw, Surf. Sci., 1996, 349, L147.
- Vanderbilt 1992 D. Vanderbilt, Surf. Sci., 1992, 268, L300.
- Zeppenfeld et al. 1994 P. Zeppenfeld, M. Krzyzowski, C. Romainczyk, G. Comsa and M. G. Lagally, Phys. Rev. Lett., 1994, 72, 2737.
- Prevot et al. 2004 G. Prevot, B. Croset, Y. Girard, A. Coati, Y. Garreau, M. Hohage, L. D. Sun and P. Zeppenfeld, Surf. Sci., 2004, 549, 52.
- Berge and Goldmann 2003 K. Berge and A. Goldmann, Surf. Sci., 2003, 540, 97.
- Bobrov and Guillemot 2008 K. Bobrov and L. Guillemot, Phys. Rev. B, 2008, 78, 121408.
- Harl and Kresse 2006 J. Harl and G. Kresse, Surf. Sci., 2006, 600, 4633.
- Guillemot and Bobrov 2011 L. Guillemot and K. Bobrov, Phys. Rev. B, 2011, 83, 075409.
- Frechard and van Santen 1998 F. Frechard and R. A. van Santen, Surf. Sci., 1998, 407, 200.
- Liem et al. 2000 S. Y. Liem, J. H. R. Clarke and G. Kresse, Surf. Sci., 2000, 459, 104.
- Bamidele et al. 2013 J. Bamidele, J. Brndiar, A. Gulans, L. Kantorovich and I. Stich, J. Chem. Theo. Comp., 2013, 9, 5578.
- Didio et al. 1984 R. A. Didio, D. M. Zehner and E. W. Plummer, J. Vac. Sci. Tech. A, 1984, 2, 852.
- Cortona and Sapet 2005 P. Cortona and C. Sapet, Surf. Sci., 2005, 585, 155.
- Courths et al. 1987 R. Courths, B. Cord, H. Wern, H. Saalfeld and S. Hufner, Sol. State Comm., 1987, 63, 619.
- Matzdorf and Goldmann 1998 R. Matzdorf and A. Goldmann, Surf. Sci., 1998, 412, 61.
- Cabrera-Sanfelix et al. 2013 P. Cabrera-Sanfelix, C. Lin, A. Arnau and D. Sanchez-Portal, J. Phys.-Cond. Mat., 2013, 25, 135003.
- Pforte et al. 2001 F. Pforte, A. Gerlach, A. Goldmann, R. Matzdorf, J. Braun and A. Postnikov, Phys. Rev. B, 2001, 63, 165405.
- Li and Zhou 2013 L. Li and G. W. Zhou, Surf. Sci., 2013, 615, 57.
- Simmons et al. 1967 G. W. Simmons, D. F. Mitchell and K. R. Lawless, Surf. Sci., 1967, 8, 130.
- Ho and Vook 1978 J. H. Ho and R. W. Vook, J. Crys. Growth, 1978, 44, 561.
- Niehus 1983 H. Niehus, Surf. Sci., 1983, 130, 41.
- Haase and Kuhr 1988 J. Haase and H. J. Kuhr, Surf. Sci., 1988, 203, L695.
- Luo and Urban 1991 B. Luo and J. Urban, J. Phys. - Cond. Matt., 1991, 3, 2873.
- Jensen et al. 1991 F. Jensen, F. Besenbacher, E. Laegsgaard and I. Stensgaard, Surf. Sci., 1991, 259, L774.
- Vankooten et al. 1993 W. E. J. Vankooten, O. L. J. Gijzeman and J. W. Geus, Surf. Sci., 1993, 280, L243.
- Matsumoto et al. 2001 T. Matsumoto, R. A. Bennett, P. Stone, T. Yamada, K. Domen and M. Bowker, Surf. Sci., 2001, 471, 225.
- Wiame et al. 2007 F. Wiame, V. Maurice and P. Marcus, Surf. Sci., 2007, 601, 1193.
- Jacob et al. 1986 W. Jacob, V. Dose and A. Goldmann, Appl. Phys. A, 1986, 41, 145.
- Xu and Mavrikakis 2001 Y. Xu and M. Mavrikakis, Surf. Sci., 2001, 494, 131.
- C. et al. 2013 M. L. C., Z. J. M. and X. K. W., Science China-Phys. Mech. Astron., 2013, 56, 573.
- Pang et al. 2007 X. Y. Pang, L. Q. Xue and G. C. Wang, Langmuir, 2007, 23, 4910.
- Judd et al. 1986 R. W. Judd, P. Hollins and J. Pritchard, Surf. Sci., 1986, 171, 643.
- Toomes et al. 2000 R. L. Toomes, D. P. Woodruff, M. Polcik, S. Bao, P. Hofmann and K. M. Schindler, Surf. Sci., 2000, 445, 300.
- Michaelides et al. 2005 A. Michaelides, K. Reuter and M. Scheffler, J. Vac. Sci. Tech. A, 2005, 23, 1487.
- Schnadt et al. 2006 J. Schnadt, A. Michaelides, J. Knudsen, R. T. Vang, K. Reuter, E. Lægsgaard, M. Scheffler and F. Besenbacher, Phys. Rev. Lett., 2006, 96, 146101.
- Todorova et al. 2004 M. Todorova, K. Reuter and M. Scheffler, J. Phys. Chem. B, 2004, 108, 14477.
- Stampfl 2005 C. Stampfl, Catal. Tod., 2005, 105, 17–35.
- Gustafson et al. 2004 J. Gustafson, A. Mikkelsen, M. Borg, E. Lundgren, L. Kohler, G. Kresse, M. Schmid, P. Varga, J. Yuhara, X. Torrelles, C. Quiros and J. N. Andersen, Phys. Rev. Lett., 2004, 92, 126102.
- Kohler et al. 2004 L. Kohler, G. Kresse, M. Schmid, E. Lundgren, J. Gustafson, A. Mikkelsen, M. Borg, J. Yuhara, J. N. Andersen, M. Marsman and P. Varga, Phys. Rev. Lett., 2004, 93, 266103.
- Michaelides et al. 2003 A. Michaelides, M. L. Bocquet, P. Sautet, A. Alavi and D. A. King, Chem. Phys. Lett., 2003, 367, 344.
- Todorova et al. 2005 M. Todorova, K. Reuter and M. Scheffler, Phys. Rev. B, 2005, 71, 195403.
- Eastman et al. 2005 J. A. Eastman, P. H. Fuoss, L. E. Rehn, P. M. Baldo, G. W. Zhou, D. D. Fong and L. J. Thompson, App. Phys. Lett., 2005, 87, 051914.
- Pierson et al. 2005 J. F. Pierson, D. Wiederkehr and A. Billard, Thin Solid Films, 2005, 478, 196.
- Goulden 1976 D. A. Goulden, Phil. Mag., 1976, 33, 393.
- Young et al. 1956 F. W. Young, J. V. Cathcart and A. T. Gwathmey, Acta Metall., 1956, 4, 145.
- Gwathmey and Benton 1942 A. T. Gwathmey and A. F. Benton, J. of Phys. Chem., 1942, 46, 969.
- Rhodin 1950 T. N. Rhodin, J. Am. Chem. Soc., 1950, 72, 5102.
- Brockway and Adler 1972 L. O. Brockway and I. M. Adler, J. Electrochem. Soc., 1972, 119, 899.
- Milne and Howie 1984 R. H. Milne and A. Howie, Phil. Mag. A, 1984, 49, 665.
- Yang et al. 1997 J. C. Yang, M. Yeadon, B. Kolasa and J. M. Gibson, App. Phys. Lett., 1997, 70, 3522.
- Yang et al. 1998 J. C. Yang, M. Yeadon, B. Kolasa and J. M. Gibson, Scr. Mat., 1998, 38, 1237.
- Yang et al. 2002 J. C. Yang, D. Evan and L. Tropia, App. Phys. Lett., 2002, 81, 241.
- Stefanov and Marinova 1988 P. Stefanov and T. Marinova, Appl. Surf. Sci., 1988, 31, 445.
- Zhou 2009 G. W. Zhou, Acta Mat., 2009, 57, 4432.
- Zhou and Yang 2003 G. W. Zhou and J. C. Yang, Applied Surf. Sci., 2003, 210, 165.
- Zhou et al. 2005 G. W. Zhou, W. S. Slaughter and J. C. Yang, Phys. Rev. Lett., 2005, 94, 246101.
- Tersoff and Tromp 1993 J. Tersoff and R. M. Tromp, Phys. Rev. Lett., 1993, 70, 2782.
- Lampimaki et al. 2007 M. Lampimaki, K. Lahtonen, M. Hirsimaki and M. Valden, J. Chem. Phys., 2007, 126, 034703.
- Yang et al. 2001 J. C. Yang, M. D. Bharadwaj, G. W. Zhou and L. Tropia, Microsc. and Microanal., 2001, 7, 486.
- Bao et al. 1995 X. Bao, M. Muhler, B. Pettinger, Y. Uchida, G. Lehmpfuhl, R. Schlogl and G. Ertl, Catal. Lett., 1995, 32, 171.
- Bottcher and Niehus 1999 A. Bottcher and H. Niehus, J. Chem. Phys., 1999, 110, 3186.
- Kangas and Laasonen 2008 T. Kangas and K. Laasonen, Surf. Sci., 2008, 602, 3239.
- Kangas et al. 2005 T. Kangas, K. Laasonen, A. Puisto, H. Pitkanen and M. Alatalo, Surf. Sci., 2005, 584, 62.
- Lee and McGaughey 2009 M. Y. Lee and J. H. McGaughey, Surf. Sc., 2009, 603, 3404.
- Alatalo et al. 2006 M. Alatalo, A. Puisto, H. Pitkanen, A. S. Foster and K. Laasonen, Surf. Sci., 2006, 600, 1574.
- Ahonen et al. 2008 M. Ahonen, M. Hirsimaki, A. Puisto, S. Auvinen, M. Valden and M. Alatalo, Chem. Phys. Lett., 2008, 456, 211.
- Junell et al. 2004 P. Junell, M. Ahonen, M. Hirsimaki and M. Valden, Surf. Rev. and Lett., 2004, 11, 457.
- Devine et al. 2011 B. Devine, T. R. Shan, Y. T. Cheng, A. J. McGaughey, M. Y. Lee, S. Phillpot and S. B. Sinnot, Phys.Rev.B, 2011, 84, 125308.
- Laio and Parrinello 2002 A. Laio and M. Parrinello, Proc. Nat. Acad. Sc., 2002, 99, 12562.
- Yang et al. 1998 J. C. Yang, B. Kolasa, J. M. Gibson and M. Yeadon, App. Phys. Lett., 1998, 73, 2841.
- Yang et al. 1999 J. C. Yang, M. Yeadon, B. Kolasa and J. M. Gibson, J. Electrochem. Soc., 1999, 146, 2103.
- Zhou et al. 2005 G. W. Zhou, L. Wang and J. C. Yang, J. Appl. Phys., 2005, 97, 063509.
- Zhou and Yang 2005 G. W. Zhou and J. C. Yang, J. Mat. Res., 2005, 20, 1684.
- Zhou and Yang 2004 G. W. Zhou and J. C. Yang, Applied Surf. Sci., 2004, 222, 357.
- Zhou and Yang 2004 G. W. Zhou and J. C. Yang, Surf. Sci., 2004, 559, 100.
- Zhou and Yang 2002 G. W. Zhou and J. C. Yang, Phys. Rev. Lett., 2002, 89, 4.
- Zhou 2009 G. W. Zhou, App. Phys. Lett., 2009, 94, 233115.
- Zhou et al. 2008 G. W. Zhou, X. D. Chen, D. Gallagher and J. C. Yang, App. Phys. Lett., 2008, 93, 3.
- Lawless and Gwathmey 1956 K. R. Lawless and A. T. Gwathmey, Acta Metall., 1956, 4, 153.
- Rauh and Wissmann 1993 M. Rauh and P. Wissmann, Thin Solid Films, 1993, 228, 121.
- Mulheran and Blackman 1995 P. A. Mulheran and J. A. Blackman, Phil. Mag. Lett., 1995, 72, 55.
- Bartelt and Evans 1996 M. C. Bartelt and J. W. Evans, Phys. Rev. B, 1996, 54, R17359.
- Orr 1964 W. H. Orr, J. Electrochem. Soc., 1964, 111, C184.
- Holloway and Hudson 1974 P. H. Holloway and J. B. Hudson, Surf. Sci., 1974, 43, 123.
- Kolmogorov 1937 A. N. Kolmogorov, Bull. Acad. Sci. URSS, 1937, 3, 355.
- Avrami 1939 M. Avrami, J. Chem. Phys., 1939, 7, 1103.
- Johnson and Mehl 1939 W. A. Johnson and R. F. Mehl, Trans. Am. Inst. Mining And Metal. Eng., 1939, 135, 416.
- Jeon et al. 2011 B. Jeon, S. K. R. S. Sankaranarayanan, A. C. T. van Duin and S. Ramanathan, Phil. Mag., 2011, 91, 4073.
- Leidheiser 1971 H. Leidheiser, The corrosion of copper, tin, and their alloys, Wiley, 1971.
- Ronnquist and Fischmeister 1960 A. Ronnquist and H. Fischmeister, J. Inst. Met., 1960, 89, 65.
- Rhodin 1951 T. N. Rhodin, J. Am. Chem. Soc., 1951, 73, 3143.
- Bouzidi and Slavin 2005 L. Bouzidi and A. J. Slavin, Surf. Sci., 2005, 580, 195.
- Lim et al. 2002 J. W. Lim, Y. Ishikawa, K. Miyake, M. Yamashita and M. Isshiki, Mat. Trans., 2002, 43, 1403.
- Landsberg 1955 P. T. Landsberg, J. Chem. Phys., 1955, 23, 1079.
- Grimley and Trapnell 1956 T. B. Grimley and B. M. W. Trapnell, Proc. Royal Soc. A, 1956, 234, 405.
- Uhlig 1956 H. H. Uhlig, Acta Metall., 1956, 4, 541.
- Evans 1947 U. R. Evans, Trans. Electrochem. Soc., 1947, 91, 547.
- Cabrera and Mott 1948 N. Cabrera and N. F. Mott, Rep. Prog. Phys., 1948, 12, 163.
- Hu et al. 2000 Y. Z. Hu, R. Sharangpani and S. P. Tay, J. Vac. Sci. Tech. A-Vac. Surf. and Films, 2000, 18, 2527.
- Roy and Sircar 1981 S. K. Roy and S. C. Sircar, Oxid. Met., 1981, 15, 9.
- Derin and Kantarli 2002 H. Derin and K. Kantarli, Appl. Phys. A, 2002, 75, 391.
- vanWijk et al. 1996 R. vanWijk, O. L. J. Gijzeman and J. W. Geus, Applied Surf. Sci., 1996, 93, 237.
- Njeh et al. 2002 A. Njeh, T. Wieder and H. Fuess, Surf. Interf. Anal., 2002, 33, 626.
- Manara et al. 1992 A. Manara, V. Sirtori and L. Mammarella, Surf. Interf. Anal., 1992, 18, 32.
- Fujita et al. 2013 K. Fujita, D. Ando, M. Uchikoshi, K. Mimura and M. Isshiki, Appl. Surf. Sci., 2013, 276, 347.
- O’Reilly et al. 1995 M. O’Reilly, X. Jiang, J. T. Beechinor, S. Lynch, C. N. Nidheasuna, J. C. Patterson and G. M. Crean, Appl. Surf. Sci., 1995, 91, 152.
- Gao et al. 2001 W. Gao, H. Gong, J. He, A. Thomas, L. Chan and S. Li, Mat. Lett., 2001, 51, 78.
- Keil et al. 2010 P. Keil, R. Frahm and D. Lutzenkirchen-Hecht, Corr. Sci., 2010, 52, 1305.
- Keil et al. 2007 P. Keil, D. Lutzenkirchen-Hecht and R. Frahm, 13th International Conference on X-Ray Absorption Fine Structure (XAFS13), Melville, 2007, p. 490.
- Chawla et al. 1992 S. K. Chawla, B. I. Rickett, N. Sankarraman and J. H. Payer, Corr. Sci., 1992, 33, 1617.
- Chu et al. 1999 Y. S. Chu, I. K. Robinson and A. A. Gewirth, J. Chem. Phys., 1999, 110, 5952.
- Suzuki et al. 1997 S. Suzuki, Y. Ishikawa, M. Isshiki and Y. Waseda, Mat. Trans. Jim, 1997, 38, 1004.
- Rico et al. 2009 V. Rico, A. Borrás, F. Yubero, J. P. Espinós, F. Frutos and A. R. González-Elipe, J. Phys. Chem. C, 2009, 113, 3775.
- Platzman et al. 2010 I. Platzman, C. Saguy, R. Brener, R. Tannenbaum and H. Haick, Langmuir, 2010, 26, 191.
- Yamamoto et al. 2008 S. Yamamoto, H. Bluhm, K. Andersson, G. Ketteler, H. Ogasawara, M. Salmeron and A. Nilsson, J. Phys.-Cond. Mat., 2008, 20, 14.
- Ross and Gibson 1992 F. M. Ross and J. M. Gibson, Phys. Rev. Lett., 1992, 68, 1782.
- Dujardin et al. 1996 G. Dujardin, A. Mayne, G. Comtet, L. Hellner, M. Jamet, E. LeGoff and P. Millet, Phys. Rev. Lett., 1996, 76, 3782.
- Thurmer et al. 2002 K. Thurmer, E. Williams and J. Reutt-Robey, Science, 2002, 297, 2033.
- Dujardin et al. 1999 G. Dujardin, A. J. Mayne and F. Rose, Phys. Rev. Lett., 1999, 82, 3448.
- Mayne et al. 2003 A. J. Mayne, F. Rose and G. Dujardin, Surf. Sci., 2003, 523, 157.
- Zhu et al. 2006 Y. F. Zhu, K. Mimura, J. W. Lim, M. Isshiki and Q. Jiang, Metall. Mat. Trans. A, 2006, 37A, 1231.
- Belousov and Klimashin 2013 V. V. Belousov and A. A. Klimashin, Russ. Chem. Rev., 2013, 82, 273.
- Boggio 1979 J. E. Boggio, J. Chem. Phys., 1979, 70, 5054.
- Courths et al. 1997 R. Courths, S. Hufner, P. Kemkes and G. Wiesen, Surf. Sci., 1997, 376, 43.
- Schimizu and Tsukada 1993 T. Schimizu and M. Tsukada, Surf. Sci., 1993, 295, L1017.
- Forster et al. 2012 M. Forster, R. Raval, J. Carrasco, A. Michaelides and A. Hodgson, Chem. Sc., 2012, 3, 93.
- Kronawitter et al. 2014 C. X. Kronawitter, C. Riplinger, X. B. He, P. Zahl, E. A. Carter, P. Sutter and B. E. Koel, J. Am. Chem. Soc., 2014, 136, 13283.
- Deng et al. 2008 X. Y. Deng, A. Verdaguer, T. Herranz, C. Weis, H. Bluhm and M. Salmeron, Lang., 2008, 24, 9474.
- Jiang et al. 2010 P. Jiang, J. L. Chen, F. Borondics, P. A. Glans, M. W. West, C. L. Chang, M. Salmeron and J. H. Guo, Elec. Comm., 2010, 12, 820.
- Dell’Angela et al. 2013 M. Dell’Angela, T. Anniyev, M. Beye, R. Coffee, A. Foehlisch, J. Gladh, T. Katayama, S. Kaya, O. Krupin, J. LaRue, A. Møgelhøj, D. Nordlund, J. K. Nørskov, H. Öberg, H. Ogasawara, H. ÖstrÖm, L. G. M. Pettersson, W. F. Schlotter, J. A. Sellberg, F. Sorgenfrei, J. J. Turner, M. Wolf, W. Wurth and A. Nilsson, Science, 2013, 339, 1302.
- Schnadt et al. 2012 J. Schnadt, J. Knudsen, J. N. Andersen, H. Siegbahn, A. Pietzsch, F. Hennies, N. Johansson, N. Mårtensson, G. Öhrwall, S. Bahr, S. Mähl and O. Schaff, Journal of Synchrotron Radiation, 2012, 19, 701.