Electroabsorption study of index-defined semiconducting carbon nanotubes
Abstract
Electroabsorption spectroscopy of well identified index-defined semiconducting carbon nanotubes is reported. The measurement of high definition electroabsorption spectrum allows direct indexation with unique nanotube chirality. Results show that at least for a limited range of diameter, electroabsorption is directly proportional to the exciton binding energy of nanotubes. Electroabsorption is a powerful technique which directly probes into carbon nanotubes excitonic states, and may become an useful tool for in-situ study of excitons in future nanotube based photonic devices such as electroabsorption modulators.
Keywords:
nanotube ; electroabsorption ; modulator1 Introduction
Single Wall Carbon Nanotubes (SWNT) are nano-sized unidimensional structures which have been considerably studied in the past ten years for their very peculiar electrical and optical properties. Semiconducting single-wall carbon nanotubes (s-SWNT) with their direct band-gap, present a special interest for nanophotonic and electro-optic applicationsPSSB-Avouris ; apl-Gaufres . Electron confinement in one dimensional nanotube leads to strong electron-hole localization with binding energy as high as 0.5 eV, and the formation of the so-called excitonic statesScience-Wang . Exciton binding energy strongly depends on the nanotube intrinsic parameters (diameter, chirality)prb-Lebedkin , and on external parameters such as strainprl-Yang ; nano-Leeuw or dielectric constant of the surrounding mediumapa-Lefebvre ; prb-Izard . Therefore, the environnement can be used to tailor s-SWNT optical properties; which could strongly affect s-SWNT properties, making them very efficient sensorsScience-Kong . As excitonic processes are fundamental, numerous studies buckle down to elucidate themprb-Maultzsch ; nano-Mohite ; nano-Lefebvre . Usually, excitons could be classified under two categories, dipole-allowed “bright” excitons, and dipole-forbidden “dark” excitons, the former being probed by linear absorption spectra while the latter are probed by two-photon absorption spectroscopyScience-Wang . In contrast, electroabsorption (EA) spectroscopy should allow access to full nanotube excitonic states, and would be directly related to excitonic binding energyprl-Zhao ; nano-Perebeinos .
Experimentally, EA spectroscopy of carbon nanotubes is quite challenging due to the mixing of metallic and semiconducting nanotubes, and the mutually overlapped absorptions of different chirality tubes having proximate excitonic energiesapl-Takenobu ; nano-Gadermaier ; prl-Kishida . However, recent advances in SWNT separation techniques, either by density gradient ultracentrifugationnano-Arnold ; naturenano-Ghosh or by polymer-assisted extractionNaturenano-Nish ; nano-Chen , allows to obtain well defined semiconducting nanotubes with a limited extent of chiral index, without detectable traces of metallic nanotubesapl-Izard . In this paper, we report the first electroabsorption experiments performed on well identified index-defined semiconducting tubes, which give a direct insight into s-SWNT electronic structure and excitonic states.
2 Materials and Experimental details
The current study uses two different kinds of s-SWNT, prepared using a polymer-assisted selective extraction techniqueapl-Izard . The first sample was made to be as close as possible to a single index nanotube distribution. A narrow diameter SWNT distribution synthesized by the CoMoCAT process (from SouthWest NanoTech. Inc.) was used as a starting material. This raw material was dispersed with poly-9,9-di-n-octyl-fluorenyl-2,7-diyl (PFO) polymer in a toluene / acetic acid solution using sonication which, after an ultracentrifugation step, leads to sample “CoMoCAT/PFO” made of almost exclusively of (7,5) chirality s-SWNTprb-Murakami .
The second sample was made such as to have the widest possible range of s-SWNT chiralities, but at the same time having a distribution of well-defined single chirality peaks. For that purpose, a large diameter SWNT distribution of as-prepared HiPCO SWNT powder (from Unidym Inc.) was used as a starting material. Details of this sample preparation procedure are reported elsewhereapl-Izard . Briefly, the preparation procedure involves a homogeneization step (1 h with a water-bath sonicator and 15 min with a tip sonicator) of the PFO-SWNT mixture, followed by an ultracentrifugation step (2 h, 150.000 g). This method leads to sample “HiPCO/PFO”, with a majority of (8,6), (8,7) and (7,6) s-SWNT chiralities, as well as few (7,5) and (9,7) chiralitiesOptLett-Gaufres ; OptExp-Gaufres .
Both samples were drop casted on a 2x2 mm quartz substrate, with 100 m spaced interdigitated Cr/Au electrodes prealably deposited, to form thin layers. Those s-SWNT-doped PFO thin layers were subsequently annealed at 180∘C for 15 min, resulting in highly fluorescent layer, with homogeneous s-SWNT densityapl-Gaufres ; SynthMet-Campoy .
Electromodulation spectroscopy experiments were then madeprb-Aspnes ; prl-Campbell . The sample was set inside a vacuum chamber ( torr) to prevent air breakdown under high electric fields. The light source was a high power Halogen/Xenon white lamp, with a Nikkon monochromator. Electrical modulation was assured by a function generator at a frequency of 333 Hz, with a voltage amplification up to 300 V. Liquid nitrogen-cooled Si and Ge detectors were used for the detection of the second harmonic () component. No signal was measured at and . We experimentally obtained the variation of transmission which could be related to the change in absorption by the relation: .
3 Results and Discussion
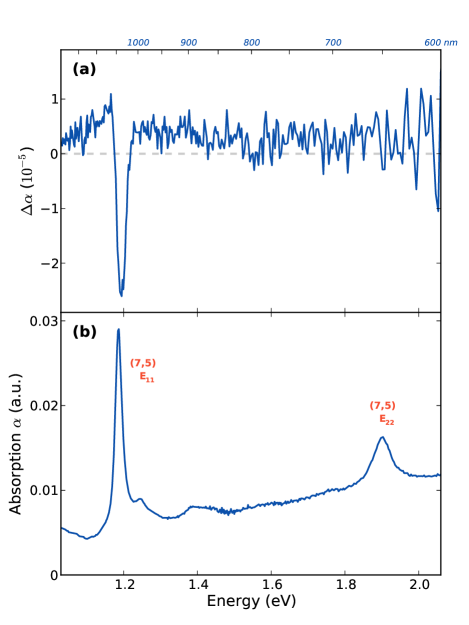
Room temperature electroabsorption spectrum (EA) of CoMoCAT/PFO at 12 kV/cm is reported in Fig. 1a, while the corresponding absorption spectrum is shown in Fig. 1b. A striking feature in the EA spectrum is the unique and well defined peak at 1.18 eV. Interestingly, there is a corresponding feature in the absorption spectrum, also at 1.18 eV. The CoMoCAT/PFO absorption spectra is mainly constituted by two main peaks at 1.18 eV and 1.9 eV. Those peaks correspond to the and optical exciton transitions below the and continuums. Using well-known assignation rulesScience-Oconnell , one can assign the observed excitonic transitions to index-defined nanotubes. In the case of CoMoCAT/PFO sample, peaks at 1.18 eV and 1.9 eV could respectively be attributed to the (7,5)’s and the (7,5)’s excitons. The other two small features around 1.24 eV and 1.4 eV are attributed to trace of different nanotubes, probably (6,5) and (6,4) s-SWNT. Therefore, the observed peak in the EA spectrum could be assigned to the (7,5) SWNT’s first exciton.
In order to further investigate the origin of this EA peak, a series of EA spectrum were performed on sample CoMoCAT/PFO, while varying the applied field from 6 to 16.5 kV/cm. Below 6 kV/cm, the EA signal was hardly distinguishable from noise, while above 16.5 kV/cm the voltage amplification system saturates. The (7,5) s-SWNT EA peak was fitted by a single lorenzian, and amplitude , peak position, and its full width half maximum (FWHM) were extracted. Peak amplitude as a function of the square electrical field is shown on Fig. 2a, while peak position and FWHM as a function of the electrical field are shown in Fig. 2b and c, respectively.
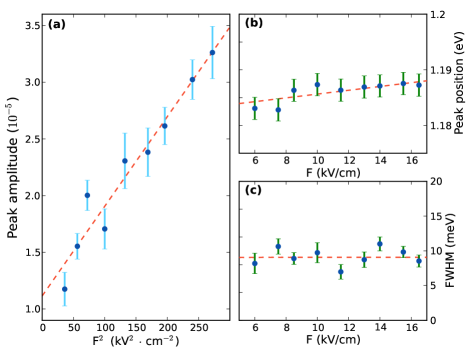
No significant peak shift or peak broadening could be detected while applying the electrical field from 6 to 16.5 kV/cm. This means that the field applied to the system remains low, and that the excitonic dissociation is negligible. In that case, EA theoryprl-Zhao ; nano-Perebeinos states that obey the following relation:
| (1) |
where is the excitonic binding energy, the SWNT diameter, the applied electric field, and and , constants. As in the current case, there is only one kind of nanotube, and are both constant, and should be linear with , which is what it was experimentally obtained (Fig. 2a). This demonstrate that the observed EA peak at 1.18 eV in Fig. 1a is from excitonic origin, as it was also observed by Kishida et al.prl-Kishida
Relations between nanotube diameter and EA spectra were also investigated. Previously prepared HiPCO/PFO sample, which contains several well identified s-SWNT chiralities with well separated absorption features, is ideal for that study. Room temperature EA spectrum at 12 kV/cm and the corresponding absorption spectrum are reported in Fig. 3.
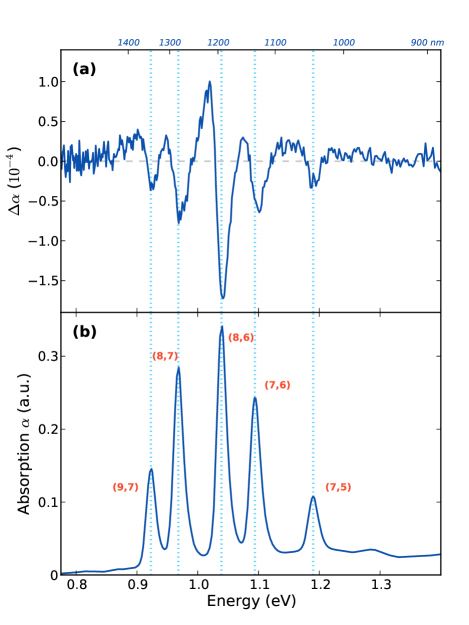
EA spectrum is mainly composed of five peaks, with five corresponding peaks in the absorption spectrum. As it was previously demonstrated, it is possible to assign optical transitions to individual s-SWNT excitons, ranging from (7,5) to (9,7) s-SWNT, with diameter ranging from 0.83 to 1.10 nm. As the absorption peaks of the HiPCO/PFO sample are well separated from each other, the resulting EA spectrum is constituted by the individual contribution from those five s-SWNT, making the assignment of EA peaks straightforward. An asymmetry could be observed on all EA peaks in the HiPCO/PFO sample, as well as to a lesser extent in the CoMoCAT/PFO sample. This effect is particularly clear with the (8,6) EA peak at 1.039 eV, which is very intense with a clear asymetric feature at lower energy. This asymetric feature in EA peaks is expected by theoretical results from Zhao et al.prl-Zhao , and our experimental results are in good agreement with those calculations.
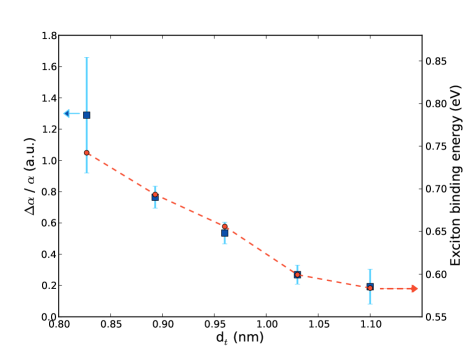
An interesting way to analyze EA relations with s-SWNT diameter consists on normalizing the EA amplitude at a given field by the absorption amplitude for each nanotube. Indeed, this gives the intrinsic EA response of each s-SWNT independently from its concentration in the samples. Plot of this normalized EA amplitude as a function of the nanotube diameter is reported in Fig. 4.
Exciton binding energy could be given by the following analytical expression from Capaz et al.prb-Capaz :
| (2) |
where is the tube diameter, and represents the chirality dependence. , , and are numerical constants, and their values are respectivelyprb-Capaz :
Exciton binding energy for the five s-SWNT in which we had measured normalized EA amplitude were calculated using Eq. 2 and reported in Fig. 4. Normalized EA response is in very good agreement with the calculated exciton binding energy . However, this relationship currently holds true only for a limited extent of nanotube diameters and exciton binding energies. In particular, s-SWNT with diameter above 1.10 nm and exciton binding energy below 550 meV may not follow this rule. Even if challenging, additional experiments needs to be performed on higher diameter s-SWNT to extend the boundaries of the current study. This could allow establishing a definite connection between electroabsorption and exciton binding energy. Nevertheless, electroabsorption spectroscopy is a powerful technique to directly probe carbon nanotubes excitonic states, and it may become a useful experimental tool to investigate the modification of s-SWNT’s excitons under changes in surrounding medium or chemical functionalization.
4 Summary
We report the first electroabsorption experiments performed on well identified index-defined semiconducting nanotubes. The electroabsorption response is sufficiently defined to allow a peak-to-peak correspondence with the absorption spectrum, leading to an unprecedented indexation of electroabsorption spectrum. Due to its excitonic nature, electroabsorption amplitude is quadratic with the applied electric field. Our results show that at least for a limited range of diameter, electroabsorption is proportional to exciton binding energy, in good agreement with theoretical works. Electroabsorption is an interesting technique to directly probe excitons in carbon nanotubes. From that aspect, electroabsorption proves to be an invaluable tool for the direct study of excitonic-based effects in future carbon nanotubes-based photonics devices, and in particular, to develop optical modulators based on electroabsorption effects.
Acknowledgements.
N. Izard thanks the Japan Society for the Promotion of Science and CNRS for financial support.References
- (1) P. Avouris, J. Chen, M. Freitag, V. Perebeinos, J. Tsang, Phys. Stat. Sol. B 243, 3197 (2006)
- (2) E. Gaufrès, N. Izard, X. Le-Roux, D. Marris-Morini, S. Kazaoui, E. Cassan, L. Vivien, Appl. Phys. Lett. 96, 231105 (2010)
- (3) F. Wang, G. Dukovic, L. Brus, T. Heinz, Science 308, 838 (2005)
- (4) S. Lebedkin, F. Hennrich, O. Riowski, M. Kappes, Phys. Rev. B 77, 165429 (2008)
- (5) L. Yang, J. Han, Phys. Rev. Lett. 85, 154 (2000)
- (6) T. Leeuw, D. Tsyboulski, P. Nikolaev, S. Bachilo, S. Arepalli, R. Weisman, Nano Letters 8, 826 (2008)
- (7) J. Lefebvre, J. Fraser, Y. Homma, P. Finnie, Appl. Phys. A 78, 1107 (2004)
- (8) N. Izard, D. Riehl, E. Anglaret, Phys. Rev. B 71, 195417 (2005)
- (9) J. Kong, N. Franklin, C. Zhou, M. Chapline, S. Peng, K. Cho, H. Dai, Science 287, 622 (2000)
- (10) J. Maultzsch, R. Pomraenke, S. Reich, E. Chang, D. Prezzi, A. Ruini, E. Molinari, M. Strano, C. Thomsen, C. Lienau, Phys. Rev. B 72, 241402 (2005)
- (11) A. Mohite, P. Gopinath, H. Shah, B. Alphenaar, Nano Letters 8, 142 (2008)
- (12) J. Lefebvre, P. Finnie, Nano Letters 8, 1890 (2008)
- (13) H. Zhao, S. Mazumdar, Phys. Rev. Lett. 98, 166805 (2007)
- (14) V. Perebeinos, P. Avouris, Nano Letters 7, 609 (2007)
- (15) T. Takenobu, Y. Murayama, Y. Iwasa, Appl. Phys. Lett. 89, 263510 (2006)
- (16) C. Gadermaier, E. Menna, M. Meneghetti, W. Kennedy, Z. Vardeny, G. Lanzani, Nano Letters 6, 301 (2006)
- (17) H. Kishida, Y. Nagasawa, S. Imamura, A. Nakamura, Phys. Rev. Lett. 100, 097401 (2008)
- (18) M. Arnold, S. Stupp, M. Hersam, Nano Letters 5, 713 (2005)
- (19) S. Ghosh, S.M. Bachilo, R.B. Weisman, Nature Nanotechnology 5, 443 (2010)
- (20) A. Nish, J.Y. Hwang, J. Doig, R. Nicholas, Nature Nanotechnology 2, 640 (2007)
- (21) F. Chen, B. Wang, Y. Chen, L.J. Li, Nano Letters 7, 3013 (2007)
- (22) N. Izard, S. Kazaoui, K. Hata, T. Okazaki, T. Saito, S. Iijima, N. Minami, Appl. Phys. Lett. 92, 243112 (2008)
- (23) Y. Murakami, B. Lu, S. Kazaoui, N. Minami, T. Okubo, S. Maruyama, Phys. Rev. B 79, 195407 (2009)
- (24) E. Gaufrès, N. Izard, L. Vivien, S. Kazaoui, D. Marris-Morini, E. Cassan, Opt. Lett. 34, 3845 (2009)
- (25) E. Gaufrès, N. Izard, X. Le-Roux, D. Marris-Morini, S. Kazaoui, E. Cassan, L. Vivien, Opt. Express 18, 5740 (2010)
- (26) M. Campoy-Quiles, P. Etchegoin, D. Bradley, Synth. Met. 155, 279 (2005)
- (27) D. Aspnes, J. Rowe, Phys. Rev. B 5, 4022 (1972)
- (28) I. Campbell, T. Hagler, D. Smith, J. Ferraris, Phys. Rev. Lett. 76, 1900 (1996)
- (29) M.J. O’Connell, S.M. Bachilo, C.B. Huffman, V.C. Moore, M.S. Strano, E.H. Haroz, K.L. Rialon, P.J. Boul, W.H. Noon, C. Kittrell et al., Science 297, 593 (2002)
- (30) R.B. Capaz, C.D. Spataru, S. Ismail-Beigi, S.G. Louie, Phys. Rev. B 74, 121401 (2006)