Towards a Mg lattice clock: Observation of the transition and determination of the magic wavelength
Abstract
We optically excite the electronic state in 24Mg atoms, laser-cooled and trapped in a magic-wavelength lattice. An applied magnetic field enhances the coupling of the light to the otherwise strictly forbidden transition. We determine the magic wavelength, the quadratic magnetic Zeeman shift and the transition frequency to be 468.463(207), / and 655 058 646 691(101), respectively. These are compared with theoretical predictions and results from complementary experiments. We also developed a high-precision relativistic structure model for magnesium, give an improved theoretical value for the blackbody radiation shift and discuss a clock based on bosonic magnesium.
pacs:
06.30.Ft, 42.62.Fi, 31.15.ac, 37.10.JkThe frequencies of optical clocks are currently measured with a fractional accuracy and precision of nearly Chou et al. (2010); Hinkley et al. (2013); Bloom et al. (2014); Ushijima et al. (2015). A potentially limiting systematic frequency shift of both ion and optical lattice clocks is the AC Stark shift from room-temperature black body radiation (BBR) Nicholson et al. (2015); Beloy et al. (2014). Clock transitions with small BBR sensitivities are an attractive approach to even higher accuracies. Among these are neutral Hg and Mg, In+, and especially the Al+ ion clock transition, which all have significantly smaller BBR sensitivities than Sr and Yb lattice clocks and Cs microwave clocks.
In this Letter we report the spectroscopy of the Mg clock transition in a magic wavelength optical lattice, which gives equal AC Stark shifts of the clock states. We measure the transition frequency Godone and Novero (1993); Friebe et al. (2011) and its magic wavelength and quadratic Zeeman shift, which were recently predicted Santra et al. (2004); Ovsyannikov et al. (2006); Derevianko et al. (2009); Taichenachev et al. (2006).
Along with our measurements, we developed a more refined atomic structure model to calculate both the magic wavelength as well as the static BBR shift. For less massive atoms, such as Mg, these models are more accurate than for heavier elements like Sr and Yb, and spectroscopy of low-mass elements generally represents an interesting testbed for validating improved theoretical models Mitroy et al. (2010). Both our theoretical and experimental results for the magic wavelength agree at a level of better than 1% and restrict the value, which was estimated to fall in the range between 466 and 480 Santra et al. (2004); Ovsyannikov et al. (2006); Derevianko et al. (2009). Our model for Mg predicts a static BBR shift to be eight and five times lower than those of Sr and Yb, which were recently measured Middelmann et al. (2012); Sherman et al. (2012). Apart from the static contribution, the total BBR shift also includes a dynamic contribution, which is derived from the combination of theoretical calculations and measurements of state lifetime Nicholson et al. (2015); Beloy et al. (2012). Ref. Porsev and Derevianko (2006) estimated the dynamic contribution in Mg to be 0.1 a.u. for the state, being remarkably smaller than for Yb (1.86 a.u.) and Sr (12.37 a.u.).
For bosonic atoms, optical dipole excitation of the electronic ground state to is strongly suppressed. A magnetic field enhances the dipole coupling, enabling nHz linewidth by mixing the electronic state Taichenachev et al. (2006); Barber et al. (2006). Refs. Taichenachev et al. (2006); Taichenachev calculated the associated second order Zeeman effect for Mg to be (equivalent to a fractional frequency shift of ), a systematic effect that must be evaluated. We precisely measured the magnetic field dependence, which is consistent within the uncertainty of Taichenachev et al. (2006), estimated to be 5 Taichenachev . This second-order Zeeman shift is larger than those of Yb ( or Barber et al. (2006)) and Sr ( or Westergaard et al. (2011)).
In this way we directly measure the transition frequency, which agrees with the difference of the measured frequencies of the and transitions Friebe et al. (2011); Godone and Novero (1993). Due to its low mass and the short magic wavelength, Mg has a large photon recoil frequency shift, , where is the magic wavelength, as well as greater tunneling. A deeper lattice is therefore required to suppress tunneling Lemonde and Wolf (2005), as compared to heavier species.
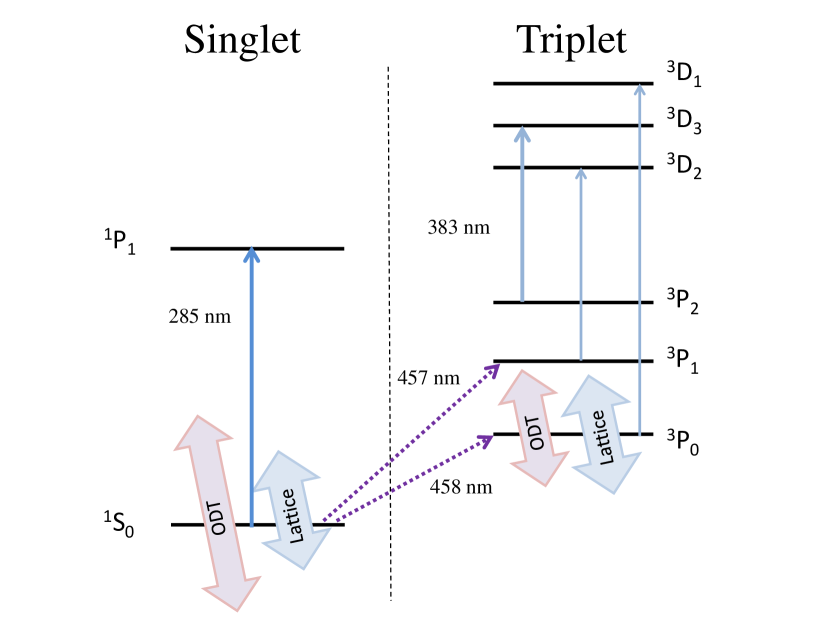
We briefly summarize the steps required for the optical lattice spectroscopy in Fig. 1. A thermal beam of Mg atoms is slowed and loaded into a ”singlet”-magneto-optical trap (MOT) using laser light tuned near the transition. Atoms are optically transferred, after excitation to the state, into a second, simultaneously operated ”triplet” MOT. There atoms can decay to the state (see Fig. 1) during MOT operation Hansen et al. (2008) and have to be recycled with light exciting them to the state. This yields 105 atoms in the state at 100 in a 1064 dipole trap as in Riedmann et al. (2012). The atoms are then optically pumped to the state and decay to the electronic ground state via the state. After this, a spatially-overlapped 1D optical lattice with a waist of 89 is adiabatically turned on before the dipole trap is rapidly switched off. To select the coldest atoms, the optical lattice intensity is ramped down to a certain depth and subsequently increased to a final value for the clock transition spectroscopy. This procedure reproducibly generates about 1000 atoms at 4.
We generate 160 of lattice light near the magic wavelength at with a frequency-doubled Ti:Sa laser. A horizontal build-up cavity, with a finesse of 80, twines around the vacuum chamber and, with a circulating power of 2.3, produces trap depths of 10 recoil energies . The cavity length is stabilized to the frequency of the laser with a Pound-Drever-Hall Drever et al. (1983) lock driving an electro-optical modulator (EOM) and a piezo-controlled mirror. An additional feedback loop driving an acousto-optical modulator (AOM) can set and stabilize the depth of the lattice. The light transmitted through the cavity is used to measure the circulating light intensity in the cavity.
The clock transition spectroscopy is performed with a home-built external cavity diode laser stabilized to an ultrastable resonator with at 916, similar to Pape et al. (2010). The infra-red light is fiber-guided to the spectroscopy setup, a tapered amplifier chip, and a commercial second-harmonic generation (SHG) stage. The system generates 10 of 458 light with a short-term frequency instability as low as in 1. The spectroscopy is performed by irradiating the atoms for 100 with a pulsed, Gaussian shaped laser beam with a waist of 300 and a peak intensity of 7.07. The MOT coils, operated in Helmholtz configuration, generate a magnetic field of 2.49(1) G/A, determined via optical Zeeman spectroscopy of the transitions, increasing the dipole coupling of and . We normally use a magnetic field of 249 G, which yields a predicted linewidth of 8.07 and a Rabi frequency of 205 Taichenachev et al. (2006). In this way, we resonantly excite up to a thousand atoms to , which are then optically pumped to and detected with a few ms of fluorescence from the ”triplet”-MOT. This detection scheme yields a sensitivity of a few tens of atoms. To obtain the line centre and profile of the transition, we record the number of excited atoms as we step the frequency of the 458 laser. Using the atoms, the linear drift of the laser is determined at the beginning and end of the spectroscopic measurements. The initial drift is compensated with a feed-forward of an AOM that shifts the laser frequency to a resonance of our ultrastable cavity. A scan over the resonance typically comprises 30 measurements, each lasting 1.9.
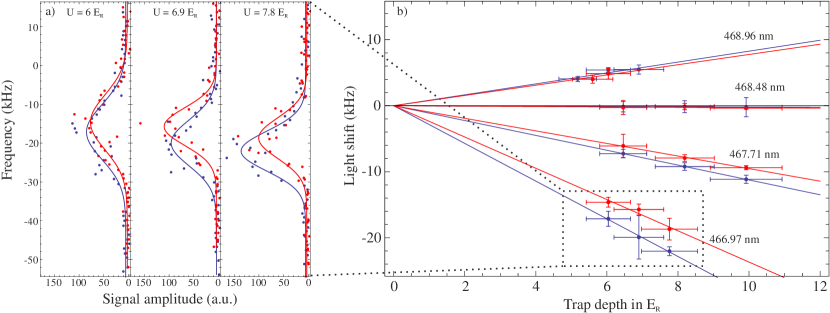
The magic wavelength for 24Mg is inferred from measurements of the line centre for different lattice depths and several wavelengths. Figure 2 a) shows two sets of measurements of the transition probability (red and blue dots) versus clock laser frequency and corresponding Gaussian fits (red and blue solid curves) for three depths of a 466.97 lattice. The line profiles for different trap depths were measured successively. To evaluate and correct the residual laser drift, the measurement sequence was repeated three times and the shift of the line centers for a specific trap depth is determined from the Gaussian fits. From the frequencies for a specific lattice depth, we infer the residual clock laser drift, which can be as large as 2-3 within several minutes. The line profiles in Figure 2 a) are three superposed scans. The linewidth of each profile, on the order of a few kHz, is mostly due to tunneling in our shallow optical lattice. Figure 2 b) shows the line centers (dots) and the corresponding linear regression (solid lines) of the AC Stark shifts versus lattice depth for different lattice wavelengths. An offset frequency was subtracted from the linear regressions for each lattice wavelength to account for the laser drift between measurements. The uncertainty of the experimental determination of the lattice depth is about 5 dominated by the uncertainty of the lattice waist. The uncertainty of the AC Stark shift is a combination of the statistical uncertainty of the linear regression and the systematic uncertainty of residual (non-linear) frequency drifts of the clock laser, on the order of a few kHz. The differences in the linear regression from the two measurement campaigns agree within these uncertainties. Separately, the two data sets yield magic wavelengths of 468.472(224) (blue data) and 468.452(192) (red data). Applying a linear regression to the combination of both measurement sets, we determine the magic wavelength of the 24Mg transition to be 468.463(207) and the linear AC Stark shift dependence on lattice depth and wavelength to be (equivalent to a fractional frequency shift of ).
The experimental results agree well with our theoretical model using a state-of-the-art relativistic approach that combines configuration interaction and all-order linearized coupled-cluster methods (CI+all-order). Our final recommended value for the theoretical Mg magic wavelength includes the replacement of the calculated values of the transition energies of the dominant contributions by experimental values. While our calculated Mg transition energies agree with the observed values to a few cm-1, even these small differences affect the magic wavelength in the fourth significant figure. To evaluate the uncertainty of our theoretical calculations, we carried out the calculations using a combination of the CI and second-order many body perturbations theory (CI+MBPT), which does not include all-order corrections to the effective Hamiltonian. The difference of the CI+MBPT and CI+all-order values serves as an estimate of the theoretical accuracy Safronova et al. (2011, 2012, 2013). The results are summarized in Table 1. We give CI+MBPT and CI+all-order values for the magic wavelength , as well as the static ground state and excited clock state polarizabilities, and their difference , which is proportional to the static BBR shift Porsev and Derevianko (2006). To demonstrate the extremely high accuracy of the theoretical calculations in Mg, we compare the magic wavelength and polarizabilities of Mg, Sr, and Yb in Table 1. The large differences between CI+MBPT and CI+all-order Sr and Yb values illustrate the significance of higher-order effects in these heavier systems. The excellent agreement of the CI+MBPT and CI+all-order polarizabilities indicates an uncertainty of the Mg BBR shift of less than 1%.
| Quantity | Method | Mg | Sr | Yb |
|---|---|---|---|---|
| CI+MBPT | 468.45 | 847 | 789 | |
| CI+all | 468.68 | 820 | 754 | |
| Final | 468.45(23) | |||
| Expt. | 468.463(207) | 813.427a | 759.354a | |
| CI+MBPT | 71.257 | 195.4 | 138.3 | |
| CI+all | 71.251 | 197.8 | 140.9 | |
| CI+MBPT | 100.812 | 482.1 | 305.9 | |
| CI+all | 100.922 | 458.1 | 293.2 | |
| CI+all | 29.671 | 260.3b | 152.3 | |
| Expt. | 247.379(7) | 145.726(3) |
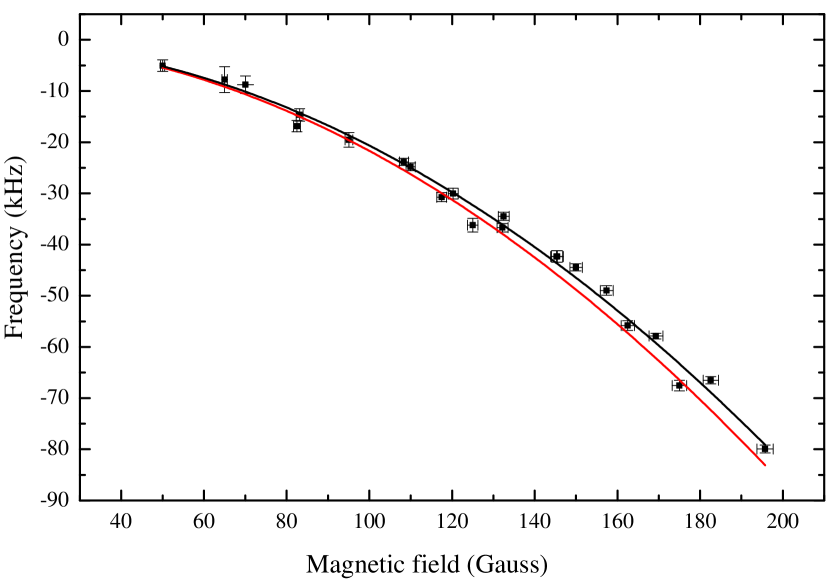
The second order Zeeman shift drops out of the determination of the magic wavelength but is a significant correction to our measured transition frequency. Fig. 3 shows the measured transition frequency versus applied magnetic field (squares), a parabolic fit (black curve) of the measurements, and a theoretical prediction by Taichenachev et al. (2006) (red curve). The experimental parabolic coefficient is (equivalent to ) and agrees within 5 with a theoretical value, which is consistent with its estimated uncertainty Taichenachev . The measurement accuracy of the magnetic field strength, via the Zeeman spectroscopy of the transition, is 1 and limited by our present accuracy in measuring the MOT coils’ electrical current.
Our measurements at the magic wavelength, with the correction of the second-order Zeeman shift, yield a direct measurement of the optical transition frequency of 655 058 646 691(101). The absolute frequency is measured by beating the spectroscopy laser with an optical frequency comb that is stabilized to a 10 GPS frequency reference. Within the dominant uncertainty from the GPS reference, the transition frequency agrees with the difference of previous spectroscopic measurements of the and transitions of 655 659 923 839 730(48) and 601 277 157 870.0(0.1) Friebe et al. (2011); Godone and Novero (1993).
In summary, we report the direct optical spectroscopy of the clock transition of laser cooled bosonic 24Mg in a magic-wavelength optical lattice. Our measurements determine precisely the magic wavelength and confirm the high precision obtained with a new theoretical atomic model of Mg. Our experimental determination of the quadratic Zeeman effect and clock transition frequency agree with a prediction Taichenachev et al. (2006) and previous indirect frequency measurements. Planned future spectroscopy in a deeper lattice of more than 40 recoil energies, will reduce the width of the lowest vibrational band to 20 and thus allow high clock accuracies.
The demonstrated agreement of our combination of theory and experimental measurements is an important ingredient for exploring a future bosonic and fermionic Mg optical lattice clock. For bosonic magnesium, atoms can be optically prepared at temperatures, which has not yet been demonstrated for the fermionic isotope 25Mg. In our experiment, a dilute atomic cloud of 1000 atoms is distributed over 130.000 lattice sites ( atoms per lattice site), which is a factor of 100 lower density than that reported for other clocks with approximately the same number of atoms Ludlow et al. (2011); Falke et al. (2014), significantly reducing the limitations from collisional shifts. The second order Zeeman shift can be sufficiently controlled foo , especially with higher clock laser intensity. A clock laser intensity of 7.07 will yield a reasonable Rabi frequency of 20.5 requiring a 10 times smaller magnetic field, with a corresponding reduction in the uncertainty of the quadratic Zeeman shift. Further, magnesium offers suitable narrow transitions for precise Zeeman spectroscopy to calibrate the magnetic field. These techniques can exploit the small blackbody radiation shift to make highly accurate and stable lattice clocks and further precisely test atomic models for precision spectroscopy.
We thank A. Bauch and H. Schnatz from Physikalisch Technische Bundesanstalt (PTB) for providing a passive H-maser and assistance for the frequency measurement during the early stage of the experiment as well as C. Lisdat for helpful discussions.
This work was supported in part by Deutsche Forschungsgemeinschaft within QUEST, Center for Quantum Engineering and Space-Time Research (APK, SR, SS, WE and EMR), NASA (KG) and U. S. NSF Grant Nos. PHY-1404156 (MSS and SGP) and PHY-1311570 (KG). DF and KHZ acknowledge financial support from Research Training Group RTG1729. NJ is supported by the Marie Curie Initial Training Networks (ITN) Program, call: FP7-PEOPLE-2013-ITN.
References
- Chou et al. (2010) C. W. Chou, D. B. Hume, J. C. J. Koelemeij, D. J. Wineland, and T. Rosenband, Phys. Rev. Lett 104, 070802 (2010).
- Hinkley et al. (2013) N. Hinkley, J. A. Sherman, N. B. Phillips, M. Schioppo, N. D. Lemke, K. Beloy, M. Pizzocaro, C. W. Oates, and A. D. Ludlow, Science 341, 1215 (2013).
- Bloom et al. (2014) B. J. Bloom, T. L. Nicholson, J. R.Williams, S. L. Campbell, M. Bishof, X. Zhang, W. Zhang, S. L. Bromley, and J. Ye, Nature 506, 71 (2014).
- Ushijima et al. (2015) I. Ushijima, M. Takamoto, M. Das, T. Ohkubo, and H. Katori, Nature Photonics 9, 185 (2015).
- Nicholson et al. (2015) T. Nicholson, S. Campbell, R. Hutson, G. Marti, B. Bloom, R. McNally, W. Zhang, M. Barrett, M. Safronova, G. Strouse, W. Tew, and J. Ye, Nature Comm. 6, 6896 (2015).
- Beloy et al. (2014) K. Beloy, N. Hinkley, N. B. Phillips, J. A. Sherman, M. Schioppo, J. Lehman, A. Feldman, L. M. Hanssen, C. W. Oates, and A. D. Ludlow, Phys. Rev. Lett. 113, 260801 (2014).
- Godone and Novero (1993) A. Godone and C. Novero, Metrologia 30, 163 (1993).
- Friebe et al. (2011) J. Friebe, M. Riedmann, T. Wübbena, A. Pape, H. Kelkar, W. Ertmer, U. Sterr, S. Weyers, G. Grosche, H. Schnatz, and E. M. Rasel, New J. Phys. 13, 125010 (2011).
- Santra et al. (2004) R. Santra, K. V. Christ, and C. H. Greene, Phys. Rev. A 69, 042510 (2004).
- Ovsyannikov et al. (2006) V. D. Ovsyannikov, V. G. Pal’chikov, H. Katori, and M. Takamoto, Quantum Electronics 36, 3 (2006).
- Derevianko et al. (2009) A. Derevianko, B. Obreshkov, and V. A. Dzuba, Phys. Rev. Lett. 103, 133201 (2009).
- Taichenachev et al. (2006) A. V. Taichenachev, V. I. Yudin, C. W. Oates, C. W. Hoyt, Z. W. Barber, and L. Hollberg, Phys. Rev. Lett. 96, 083001 (2006).
- Mitroy et al. (2010) J. Mitroy, M. S. Safronova, and C. W. Clark, J. Phys. B 43, 202001 (2010).
- Middelmann et al. (2012) T. Middelmann, S. Falke, C. Lisdat, and U. Sterr, Phys. Rev. Lett. 109, 263004 (2012).
- Sherman et al. (2012) J. A. Sherman, N. D. Lemke, N. Hinkley, M. Pizzocaro, R. W. Fox, A. D. Ludlow, and C. W. Oates, Phys. Rev. Lett. 108, 153002 (2012).
- Beloy et al. (2012) K. Beloy, J. A. Sherman, N. D. Lemke, N. Hinkley, C. W. Oates, and A. D. Ludlow, Phys. Rev. A 86, 051404 (2012).
- Porsev and Derevianko (2006) S. G. Porsev and A. Derevianko, Phys. Rev. A 74, 020502(R) (2006).
- Barber et al. (2006) Z. W. Barber, C. W. Hoyt, C. W. Oates, L. Hollberg, A. V. Taichenachev, and V. I. Yudin, Phys. Rev. Lett. 96, 083002 (2006).
- (19) A. V. Taichenachev, Private communication.
- Westergaard et al. (2011) P. G. Westergaard, J. Lodewyck, L. Lorini, A. Lecallier, E. A. Burt, M. Zawada, J. Millo, and P. Lemonde, Phys. Rev. Lett. 106, 210801 (2011).
- Lemonde and Wolf (2005) P. Lemonde and P. Wolf, Phys. Rev. A 72, 033409 (2005).
- Riedmann et al. (2012) M. Riedmann, H. Kelkar, T. Wübbena, A. Pape, A. Kulosa, K. Zipfel, D. Fim, S. Rühmann, J. Friebe, W. Ertmer, and E. Rasel, Physical Review A 86, 043416 (2012).
- Hansen et al. (2008) P. L. Hansen, K. T. Therkildsen, N. Malossi, B. B. Jensen, E. D. van Ooijen, A. Brusch, J. H. Müller, J. Hald, and J. W. Thomsen, Phys. Rev. A 77, 062502 (2008).
- Drever et al. (1983) R. W. P. Drever, J. L. Hall, F. V. Kowalski, J. Hough, G. M. Ford, A. J. Munley, and H. Ward, Appl. Phys. B 31, 97 (1983).
- Pape et al. (2010) A. Pape, O. Terra, J. Friebe, M. Riedmann, T. Wübbena, E. M. Rasel, K. Predehl, T. Legero, B. Lipphardt, H. Schnatz, and G. Grosche, Opt. Express 18, 21477 (2010).
- Safronova et al. (2011) M. S. Safronova, M. G. Kozlov, and C. W. Clark, Phys. Rev. Lett. 107, 143006 (2011).
- Safronova et al. (2012) M. S. Safronova, S. G. Porsev, and C. W. Clark, Phys. Rev. Lett. 109, 230802 (2012).
- Safronova et al. (2013) M. S. Safronova, S. G. Porsev, U. I. Safronova, M. G. Kozlov, and C. W. Clark, Phys. Rev. A 87, 012509 (2013).
- Ludlow et al. (2008) A. D. Ludlow et al., Science 319, 1805 (2008), arXiv:0801.4344 [physics.atom-ph] .
- Barber et al. (2008) Z. W. Barber et al., Phys. Rev. Lett. 100, 103002 (2008).
- Ludlow et al. (2011) A. D. Ludlow, N. D. Lemke, J. A. Sherman, C. W. Oates, G. Quéméner, J. von Stecher, and A. M. Rey, Phys. Rev. A 84, 052724 (2011).
- Falke et al. (2014) S. Falke, N. Lemke, C. Grebing, B. Lipphardt, S. Weyers, V. Gerginov, N. Huntemann, C. Hagemann, A. Al-Masoudi, S. Häfner, S. Vogt, U. Sterr, and C. Lisdat, New J. Phys. 16, 073023 (2014).
- (33) Other clock spectroscopy schemes can suppress it, as has been explored in Zanon-Willette et al. (2014); Huntemann et al. (2012).
- Zanon-Willette et al. (2014) T. Zanon-Willette, S. Almonacil, E. de Clercq, A. D. Ludlow, and E. Arimondo, Phys. Rev. A 90, 053427 (2014).
- Huntemann et al. (2012) N. Huntemann, B. Lipphardt, M. Okhapkin, C. Tamm, E. Peik, A. V. Taichenachev, and V. I. Yudin, Phys. Rev. Lett 109, 213002 (2012).