High Resolution Chandra HETG spectroscopy of V404 Cygni in Outburst
Abstract
As one of the best-characterized stellar-mass black holes, with good measurements of its mass, distance and inclination, V404 Cyg is the ideal candidate to study Eddington-limited accretion episodes. After a long quiescent period, V404 Cyg underwent a new outburst in June 2015. We obtained two Chandra HETG exposures of 20 ksec and 25 ksec. Many strong emission lines are observed; the ratio of Si He-like triplet lines gives an estimate for the formation region distance of cm, while the higher ionization Fe XXV He-like triplet gives an estimate of cm. A narrow Fe K line is detected with an equivalent width greater than 1 keV in many epochs, signaling that we do not directly observe the central engine. Obscuration of the central engine and strong narrow emission lines signal that the outer disk may be illuminated, and its structure may help to drive the strong variability observed in V404 Cyg. In the highest flux phases, strong P-Cygni profiles consistent with a strong disk wind are observed. The kinetic power of this wind may be extremely high.
1. Introduction
Stellar-mass black holes are known for extreme behaviors, but V404 Cyg stands out even within this class. V404 Cyg, also known as GS 2023338, was discovered with the all-sky monitor aboard Ginga on 1989 May 22 (Makino, 1989). The transient was extremely bright and observed extensively, varying by a factor of on timescales of seconds (Kitamoto et al., 1989). A low-mass companion was found in a wide, 6.5-day binary, and dynamical constraints verified that V404 Cyg indeed harbors a black hole of M☉ with a binary inclination of (Casares et al., 1992; Sanwal et al., 1996). Recent radio parallax measurements give a distance of kpc (Miller-Jones et al., 2009). The Eddington luminosity for V404 Cyg is ergs s-1
Observations of disk winds in stellar-mass black holes in the Chandra era find them to be dense, equatorial, to originate as close as (Miller et al., 2006a, 2008), and to be anti-correlated with jets (Miller et al., 2006b, 2008; Neilsen & Lee, 2009; King et al., 2012; Ponti et al., 2012). Winds may be related to the basic physics of disk accretion, and offer a view into feedback between massive black hole and host galaxies (e.g. King et al., 2013). New results find P-Cygni profiles and evidence of Keplerian rotation in the wind, and that components with velocities of may be fairly common (Miller et al., 2015). However, although mass outflow rates may exceed the accretion rate at the inner disk, the kinetic power in winds is (so far) a small fraction of the radiated power (King et al., 2013). In this sense, even the most extreme stellar-mass black hole winds (with velocities approaching 0.03-0.05; King et al., 2012), differ from the powerful outflows observed in broad absorption line quasars (BALQSOs) and active galactic nuclei (AGN) such like PDS 456 (Nardini et al., 2015).
A new outburst of V404 Cyg was discovered using the Swift/BAT on 2015 June 15 (Barthelmy et al., 2015). Rapid, extreme variability was again observed; flaring up to several tens of Crab was observed with INTEGRAL (Natalucci et al., 2015; Rodriguez et al., 2015). Remarkably, this does not automatically correspond to a super-Eddington luminosity, but rather a luminosity of . Motivated by the opportunity to understand the origin of the extreme behaviors observed from V404 Cyg in terms of its accretion inflow and outflows, we obtained an observation using the Chandra High Energy Transmission Grating Spectrometer (HETGS; Canizares et al., 2005). Initial results from our analysis of the incredibly rich spectra that were obtained by King et al. (2015) are the focus of this Letter.
2. Methods
We obtained two observations with the Chandra High Energy Transition Grating Spectrometer (HETGS) on 22 June 2015 and 23 June 2015, for 21 ksec and 25 ksec, respectively. Owing to the extraordinary flux levels exhibited by the source, the observations were taken with the ACIS-S array in continuous clocking mode with the 0th order position located off the detector array. This was a necessary precaution needed to avoid radiation damage to the ACIS CCDs. Used once before to observe Sco X-1, this is an unusual instrumental configuration that requires careful reduction procedures.
The resulting spectra from our setup include the positive orders of the medium energy grating (MEG) and the negative orders of the high energy grating (HEG). We used the ciao tools, version 4.7, to reduce the data. The pha files were extracted with tgextract using a masked region that was centered on the nominal point source position (RA 20h 24m 3.834s, DEC 33∘ 52′ 2.33′′). This position was then manually iterated in successive reductions, so that the narrow Fe K line measured centroid energy (as measured with a Gaussian) was aligned in both the first and third MEG positive orders as well as the HEG first negative orders, to within measurement errors.
The response files were created with mktgresp. Prominent dips in the high energy of the MEG light curve were observed to coincide with the dither pattern period (707 seconds). We therefore excluded the last 10 rows of the masked files to remove this periodic behavior. Periodic steepening of the spectra owing to this effect was thereby eliminated.
The configuration also impacted the useful energy range in each dispersed spectrum. We analyzed data from the MEG between 1.4–6 keV, and from the HEG between 5.6–10 keV in the first observation. In the second observation, we utilized data from the MEG between 1.4–4 keV, and from the HEG between 3.5–10 keV. The selected energy ranges vary between the observations due to differences in the effective area curves resulting from the specific pointings, and strong backgrounds observed in the HEG. In a follow-up paper, we will perform a more in-depth analysis of this background with an aim at extending the bandpass to lower energies in order to study Ne, Mg, and Fe L-shell lines.
All spectra were grouped to require at least 10 counts per bin, as per Cash (1979). Grouping only improved the fits above 7 keV.
3. Analysis
3.1. Time-Averaged Spectra
The time-averaged spectra for the two separate observations are depicted in Figure 1a&b. The observed 2–10 fluxes of these observations are 9.5 ergs s-1 cm-2 and 1.3 ergs s-1 cm-2, respectively. This corresponds to an observed luminosity of 6.5 ergs s-1 and 8.9 ergs s-1, respectively, and does not take into account any absorption along our line-of-sight.
We initially fit the broadband continuum with a phenomenological power-law and a broad Gaussian line (restricted to the 5–7 keV range), as a relativistically broadened Fe K line is likely present (See Figure 1a & 1b). Narrow Gaussians lines were then fit to Mg XII, Si XIII, Si XIV, SXV, SXVI, Fe K, Fe XXV, Fe XVVI, and Fe K (See Table 1). The energy, line width, and normalizations of these lines were allowed to vary. However, the energies and line widths of the forbidden (f) and inter-combination (i) lines were tied to each other.
The lower ionization lines are generally slightly red-shifted at 200 , with FWHM at roughly 1700 . The higher ionizations lines, especially Fe XXVI are blue shifted at 1000 with FWHM line widths of 3000 . Finally, the neutral Fe K line is at line center with a FWHM of 3400 , while the Fe K is redshifted by 700 with a FWHM of 2500 .
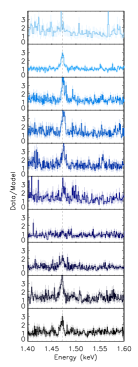
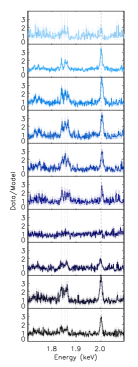
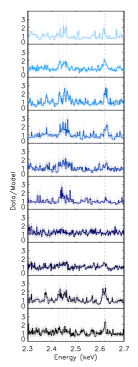
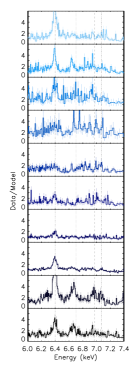
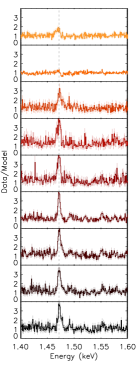
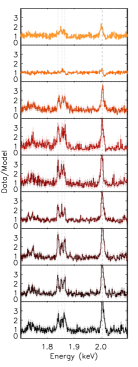
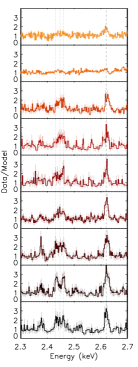
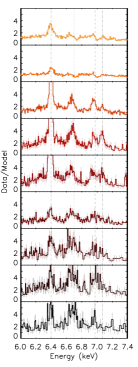
3.2. Time-Resolved Spectra
After examining the time-averaged spectra, we divided each observation into 3.2 ksec segments. This afforded a minimum of 13400 counts in the even the lowest flux segment, while still enabling us to track the large scale variations in both the flux and spectral hardness.
Figures 2a–h plot the ratio of each spectrum to a simple power-law. Both the spectral index, , and normalization were allowed to vary in these fits. One can see changes in the ratios of the lines to the continuum and the ratio of the neutral Fe K & lines to Fe XXV & XXVI, indicating changes in the highest ionization ions. In addition, several observations show clear absorption features (the fourth panel from the bottom in Figure 2 b and the top two panels of Figure 2 e–h).
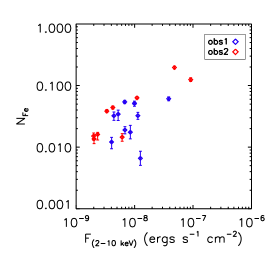
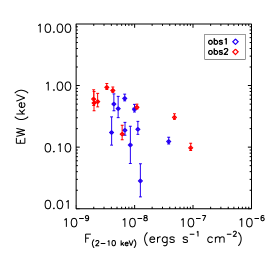
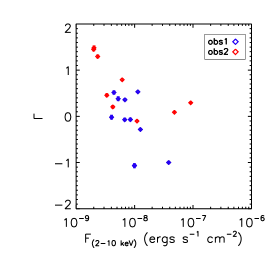
Measuring the line strength of the narrow Fe K, which is the line with the highest signal to noise ratio, we find that the line strength is positively correlated with the observed flux (Figure 3a). A positive correlation may indicate the line is responding to the continuum. In contrast, the equivalent width of the line is inversely correlated with the observed flux, and exceeds 1 keV at the lowest continuum fluxes (Figure 3b). An inverse correlation between equivalent width and observed flux suggests the continuum is varying independently of a relatively constant Fe K line, thus illustrating the complexity of this system. The fact that the equivalent width of the Fe K line sometimes exceeds 1 keV signals that we are likely not viewing the direct continuum that is photoexciting the Fe K line, but rather a reflected or scattered flux into our line of sight. For reference an equivalent width of 0.1 keV is expected when directly viewing the central source (George & Fabian, 1991). A high equivalent width is consistent with the low spectral indices for most of the observations (Figure 3c). Reflection may play an important role in these spectra. In a follow-up paper, we will further discuss the continuum variations.
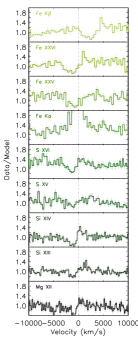
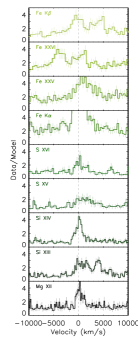
Finally, in addition to emission features, there are clear absorption features in several of the brightest epochs. Figure 4a shows the absorption in the 8th epoch of the second observation. A P-Cygni profile is observed, with absorption blue-ward of the red-shifted emission lines. This type of line profile is detected in all but the neutral Fe K and Fe K lines, which likely originate at a larger radius than the other ions. The absorption features broaden from 1000 in the Mg XII line, to nearly 4000 in the Fe XXVI line. There is clearly a complex structure to the wind that is generated during this outburst. For contrast, line profiles of the 6th epoch are shown in Figure 3b: lines from that epoch are narrow, close to their rest energy values, and seen only in emission.
3.3. Emission and Absorption Lines
Three sorts of narrow spectral lines are observed. First, there are forbidden and intercombination lines (f and i) of He-like ions formed by recombination in photoionized gas. Resonance lines of He-like ions (labeled r) and Lyman lines of H-like ions can be formed in the same way, but recombination produces r lines that are only about 1/3 as strong as the sum of f plus i. Second, P-Cygni profiles with blue edges corresponding to reaching 4000 are apparent in the time-resolved spectra. While a spherical wind gives P-Cygni emission weaker than absorption, a wind from a disk seen at high inclination can give emission much stronger than absorption, as is seen in high Ṁ cataclysmic variables (Mauche & Raymond, 1987). Third, the Fe K and K lines are formed by inner shell photoionization of weakly ionized iron in relatively cold gas.
The ratio of f to i lines is a density diagnostic, but in the presence of a strong UV radiation field the ratio is determined by photoexcitation between the upper levels of those lines (Mauche et al., 2003). The Si XIII f to i ratio in the first observation of 0.9 would indicate a density of about , while the Fe XXV f to i ratio of the first observation of 0.5, would indicate a density of cm-3. Of course this assumes the UV radiation field is unimportant. However, the peak V-band magnitude of about 11.3 from AAVSO observations that day together with = 3.0 (Shahbaz et al., 1996) and an accretion disk spectrum imply a UV continuum luminosity that gives an Si XIII f to i ratio of 0.9 at cm from the UV source, and a Fe XXV f to i ratio of 0.5 at cm. The apparent brightness should be corrected for the 70∘ inclination of the disk and the obscuration of part of the disk by its edge, suggesting that the actual UV luminosity is an order of magnitude larger, and the diffuse, emitting gas is located at about 1012 cm and cm from the source for the Si XII and Fe XXV, respectively. Interestingly this points to two different regions separated by nearly two orders of magnitude in distance, consistent the wide range in ionization between these two ions.
The ratio of He-like to H-like lines serves as an indicator of the ionization parameter, . If the lines are primarily formed by recombination, the approximate equality of the intensities of the He-like complex and H-like Ly of silicon implies approximately equal amounts of H-like S XIV and ion Si XV, which in turn implies log 3.0 (Kallman & McCray, 1982). The presence of Fe XXV and Fe XXVI implies a higher ionization parameter, log at least 4.0, while the presence of P-Cygni absorption in the Si XIII r line in some time-resolved spectra implies log below 3. There is likely a continuous range of ionization parameters in the emitting gas.
The f and i lines of Si XIII are formed by recombination of Si XIV to the excited triplet states of Si XIII. Their observed intensities, a distance of 2.39 kpc (Miller-Jones et al., 2009) and a factor of 1.4 correction for interstellar absorption, give an emission measure (EM) of . For a density distribution, , and we can roughly approximate the emission measure as under the assumption that much of the emitting volume is obscured by the disk. Then
| (1) |
yields cm-2, cm, and cm-3. These are fairly crude estimates considering the enormous variability in both the lines and the continuum, but they are consistent with the diagnostics given above.
3.4. Wind parameters
As a starting point, we assume that all the lines are formed in wind. Then
| (2) |
and
| (3) |
or
| (4) |
where is the covering fraction of the wind and is the mean atomic mass. While is on the order of 0.1 in GRO J1655-40 (Miller et al., 2006a), the emission lines and the strong absorption at a lower inclination indicate that is closer to 1 in V404 Cyg. Thus the ionization parameter and determined above imply is about 0.1. V404 Cyg may be reaching its Eddington limit, providing enough radiation pressure to disrupt the outer disk, generating these features. It is interesting to note that this is comparable to the level of feedback required in some simulations to explain the well-known relationship (Di Matteo et al., 2005).
We can also estimate the column density of the wind. The P-Cygni absorption of Si XIV Ly extends beyond 4000 in some spectra. The optical depth is about 0.1 at high speeds, which requires a Si XIV column density of about and a hydrogen column of if half the silicon is Si XIV. The lack of a clear Si XIV absorption edge at 2.67 keV implies a limit to its optical depth of , giving , in agreement with the column density estimate in the previous section.
3.5. Line Origins
While the above is a reasonable interpretation of the emission and absorption features, the wild variability of the line strengths (Figure 3) means that it is (at best) some sort of average description of the wind, and alternate interpretations seem quite possible.
The most basic question is whether the emission lines (in particular the f and i lines of He-like ions) are formed in the wind where the P Cygni profiles form. The f and i lines are relatively narrow, 1700 FWHM, compared with from the blue edge of the P Cygni profile and the FWHM=3400 higher ionization Fe XXVI lines. The narrow width is compatible with Keplerian rotation at the radius of cm (3.1) inferred above, considering that the narrow peak requires emission from larger radii. This is a plausible size for the outer edge of the disk.
A possibility that would explain the relatively narrow line widths, would be that the Si and S f and i lines arise in the X-ray-illuminated outer disk, as in Her X-1 in the low state (Jimenez-Garate et al., 2005), while the P-Cygni lines form in a more or less unrelated wind. To match the line-to-continuum ratios and equivalent widths, especially in the fainter spectra in Figures 2 and 3, this picture requires that the outer edge of the disk block our line of sight to the central X-ray source, so that we observe continuum produced by scattering from the disk or in an Accretion Disk Corona (ADC). In that case , which already appears to be up to one tenth , must be even higher. This means that the observed mass accretion rate Ṁg s-1 (assuming 0.1 efficiency) is also likely much higher. In this picture, the continuum variability, which is stronger than the variability in the emission lines (Figures 2 a–h & 3) could be attributed to changes in the height of the edge of the disk rather than changes in accretion rate. This is also evidenced by the changing spectral hardness (Figure 3c), which suggests a variable absorption and/or reflection contribution to the continuum.
4. Summary
The two Chandra HETG observations taken on the 22 and 23 of June 2015, show strong spectral emission and absorption features. Mg XII, Si XIII, Si XIV, S XV, S XVI, Fe K & K, Fe XXV, and Fe XXVI are detected in the time-averaged spectra, as well as the time-resolved spectra. Variability of the line strengths compared to the continuum as well as changes in Fe K to Fe XXV ratios suggests changes in equivalent widths as well as the highest ionizations during the observations. In addition, the extreme equivalent widths of the Fe K line (EW keV) and continuum spectral hardness, indicates that we are not directly observing the ionizing continuum, and that the total luminosity can exceed the apparent luminosity.
The ratio of the Si XIII f to i lines gives a distance from the central source of cm, while the ratio of the Fe XXV f to i lines gives a distance of cm. The emission measure, luminosity and ionization parameter of Si XIII yields a somewhat larger distance, along with a density of cm-3. The low ionization density estimate is several orders of magnitude smaller than the density seen in an outburst of GRO1655-40 (Miller et al., 2006a), presumably because the gas is much farther from the central source. In addition, the winds from V404 Cyg could be associated with disruption of the outer disk from the radiation pressure of the central region as it reaches or exceeds the Eddington luminosity. In contrast, radiation pressure is negligible in typical X-ray binary winds (Miller et al., 2006a; King et al., 2013).
In a follow-up paper, we will further discuss the continuum, quantifying the amount of reprocessed scattered or reflected light that is directed into our line of sight. In addition, we will include a physically motivated, photo-ionization model to characterize the ions observed in both emission and absorption described in this paper.
Acknowledgements
The authors would like to thank thank Belinda Wilkes for this DDT, as well as Herman Marshall, David Huenemoerder, and the Chandra team for their invaluable help. ALK would like to thank the support for this work, which was provided by NASA through Einstein Postdoctoral Fellowship grant number PF4-150125 awarded by the Chandra X-ray Center, operated by the Smithsonian Astrophysical Observatory for NASA under contract NAS8-03060.
| Observation 1 | Observation 2 | E0 (keV) | Line ID | |
|---|---|---|---|---|
| Energy (keV) | 1.4725 | 1.4715 | 1.472 | Mg XII (Lyman ) |
| (eV) | 3.7 | 2.0 | ||
| Norm ( photons cm-2 s-1) | 1.84 | 2.4 | ||
| Energy (keV) | 1.8411* | 1.8401* | 1.839 | Si XIII (f) |
| (eV) | 3.0* | 2.8* | ||
| ( photons cm-2 s-1) | 0.79 | 1.7 | ||
| Energy (keV) | 1.8557 | 1.8547 | 1.854 | Si XIII (i) |
| (eV) | 3.0 | 2.8 | ||
| ( photons cm-2 s-1) | 0.84 | 1.6 | ||
| Energy (keV) | 1.8651 | 1.8642 | 1.865 | Si XIII (r) |
| (eV) | 2.3 | 1.8 | ||
| ( photons cm-2 s-1) | 0.63 | 1.2 | ||
| Energy (keV) | 2.0050 | 2.0042 | 2.005 | Si XIV (Lyman ) |
| (eV) | 3.4 | 2.7 | ||
| Norm ( photons cm-2 s-1) | 2.05 | 3.7 | ||
| Energy (keV) | 2.4336* | 2.4362* | 2.430 | S XV (f) |
| (eV) | 3.5* | 6* | ||
| ( photons cm-2 s-1) | 0.8 | 2.1 | ||
| Energy (keV) | 2.4513 | 2.454 | 2.447 | S XV (i) |
| (eV) | 3.5 | 6 | ||
| ( photons cm-2 s-1) | 0.9 | 1.3 | ||
| Energy (keV) | 2.4625 | 2.461 | 2.461 | S XV (r) |
| (eV) | 0.07 | 1 | ||
| ( photons cm-2 s-1) | 0.4 | 0.7 | ||
| Energy (keV) | 2.4336* | 2.4362* | 2.430 | S XV (f) |
| (eV) | 3.5* | 6* | ||
| ( photons cm-2 s-1) | 0.8 | 2.1 | ||
| Energy (keV) | 2.620 | 2.6197 | 2.620 | S XVI (Lyman ) |
| (eV) | 4.3 | 4.8 | ||
| Norm ( photons cm-2 s-1) | 1.1 | 3.6 | ||
| Energy (keV) | 6.395 | 6.3970 | 6.403/6.391 | Fe K, |
| (eV) | 21 | 18 | ||
| ( photons cm-2 s-1) | 24.7 | 28.1 | ||
| Energy (keV) | 6.613* | 6.613* | 6.637 | Fe XXV (f) |
| (eV) | 16* | 16* | ||
| Norm ( photons cm-2 s-1) | 1.5 | 1.8 | ||
| Energy (keV) | 6.651* | 6.651* | 6.682 | Fe XXV (i) |
| (eV) | 16* | 16* | ||
| Norm ( photons cm-2 s-1) | 2.8 | 2.8 | ||
| Energy (keV) | 6.677* | 6.677* | 6.700 | Fe XXV (r) |
| (eV) | 16 * | 16* | ||
| Norm ( photons cm-2 s-1) | 3.6 | 3.2 | ||
| Energy (keV) | 6.948* | 6.948 | 6.973 | Fe XXVI (Lyman ) |
| (eV) | 17* | 17 | ||
| ( photons cm-2 s-1) | 5.3 | 7.2 | ||
| Energy (keV) | 7.074* | 7.074 | 7.058 | Fe K |
| (eV) | 14* | 14 | ||
| Norm ( photons cm-2 s-1) | 3.9 | 4.1 |
Note. — These are the best fit parameters to the emission lines in both observations. The * refers to the components that are frozen.


References
- Barthelmy et al. (2015) Barthelmy, S. D., D’Ai, A., D’Avanzo, P., Krimm, H. A., Lien, A. Y., Marshall, F. E., Maselli, A., & Siegel, M. H. 2015, GRB Coordinates Network, 17929, 1
- Canizares et al. (2005) Canizares, C. R., et al. 2005, PASP, 117, 1144
- Casares et al. (1992) Casares, J., Charles, P. A., & Naylor, T. 1992, Nat, 355, 614
- Di Matteo et al. (2005) Di Matteo, T., Springel, V., & Hernquist, L. 2005, Nat, 433, 604
- George & Fabian (1991) George, I. M., & Fabian, A. C. 1991, MNRAS, 249, 352
- Jimenez-Garate et al. (2005) Jimenez-Garate, M. A., Raymond, J. C., Liedahl, D. A., & Hailey, C. J. 2005, ApJ, 625, 931
- Kallman & McCray (1982) Kallman, T. R., & McCray, R. 1982, ApJS, 50, 263
- King et al. (2015) King, A. L., Miller, J. M., & Morningstar, W. 2015, The Astronomer’s Telegram, 7745, 1
- King et al. (2012) King, A. L., et al. 2012, ApJL, 746, L20
- King et al. (2013) —. 2013, ApJ, 762, 103
- Kitamoto et al. (1989) Kitamoto, S., Tsunemi, H., Miyamoto, S., Yamashita, K., & Mizobuchi, S. 1989, Nat, 342, 518
- Makino (1989) Makino, F. 1989, IAU Circ., 4782, 1
- Mauche et al. (2003) Mauche, C. W., Liedahl, D. A., & Fournier, K. B. 2003, ApJL, 588, L101
- Mauche & Raymond (1987) Mauche, C. W., & Raymond, J. C. 1987, ApJ, 323, 690
- Miller et al. (2015) Miller, J. M., Fabian, A. C., Kaastra, J., Kallman, T., King, A. L., Proga, D., Raymond, J., & Reynolds, C. S. 2015, ApJ
- Miller et al. (2006a) Miller, J. M., Raymond, J., Fabian, A., Steeghs, D., Homan, J., Reynolds, C., van der Klis, M., & Wijnands, R. 2006a, Nat, 441, 953
- Miller et al. (2008) Miller, J. M., Raymond, J., Reynolds, C. S., Fabian, A. C., Kallman, T. R., & Homan, J. 2008, ApJ, 680, 1359
- Miller et al. (2006b) Miller, J. M., et al. 2006b, ApJ, 646, 394
- Miller-Jones et al. (2009) Miller-Jones, J. C. A., Jonker, P. G., Dhawan, V., Brisken, W., Rupen, M. P., Nelemans, G., & Gallo, E. 2009, ApJL, 706, L230
- Nardini et al. (2015) Nardini, E., et al. 2015, Science, 347, 860
- Natalucci et al. (2015) Natalucci, L., Fiocchi, M., Bazzano, A., Ubertini, P., & Kuulkers, E. 2015, The Astronomer’s Telegram, 7759, 1
- Neilsen & Lee (2009) Neilsen, J., & Lee, J. C. 2009, Nat, 458, 481
- Ponti et al. (2012) Ponti, G., Fender, R. P., Begelman, M. C., Dunn, R. J. H., Neilsen, J., & Coriat, M. 2012, MNRAS, 422, L11
- Rodriguez et al. (2015) Rodriguez, J., et al. 2015, ArXiv e-prints
- Sanwal et al. (1996) Sanwal, D., Robinson, E. L., Zhang, E., Colome, C., Harvey, P. M., Ramseyer, T. F., Hellier, C., & Wood, J. H. 1996, ApJ, 460, 437
- Shahbaz et al. (1996) Shahbaz, T., Bandyopadhyay, R., Charles, P. A., & Naylor, T. 1996, MNRAS, 282, 977