Neutral Impurities in a Bose-Einstein Condensate for Simulation of the Fröhlich-Polaron
Abstract
We present an experimental system to study the Bose polaron by immersion of single, well-controllable neutral Cs impurities into a Rb Bose-Einstein condensate (BEC). We show that, by proper optical traps, independent control over impurity and BEC allows for precision relative positioning of the two sub-systems as well as for independent read-out. We furthermore estimate that measuring the polaron binding energy of Fröhlich-type Bose polarons in the low and intermediate coupling regime is feasible with our experimental constraints and limitations discussed.
pacs:
…I Introduction
The immersion of single, controllable atoms into a Bose-Einstein condensate (BEC) realizes a paradigm of quantum physics - individual quantum objects interacting coherently with a single or few mode bath. This system allows to experimentally address various questions of quantum engineering, including local, non-demolition measurement of a quantum many-body system NgBose2008 ; cooling of qubits while preserving internal state coherence Daley2004 ; Griessner2006 ; or engineering bath-mediated, long-range interaction between two or more impurities Klein2005 . An impurity strongly interacting with the quantum gas will loose its single particle properties and it is rather described in terms of quasi particles, which are known as Bose polarons Cucchietti2006 ; Tempere2009 ; Grusdt2014 . Particularly for strong interaction, such systems have been predicted to show remarkable properties such as self-trapping Cucchietti2006 or polaron clustering Klein2007 . Experimentally, impurities in BECs have been introduced, for example, as many atoms of different internal state Palzer2009 ; Fukuhara2013 or different atomic species Ospelkaus2006 ; Scelle2013 , or as individual ions Zipkes2010 ; Schmid2010 or electrons Balewski2013 .
The system we report on here considers a single, neutral impurity in an ultracold gas, where the effect of impurity-impurity interactions, either direct or mediated by the bath, can be neglected. The corresponding Hamiltonian thus reflects an extremely imbalanced mixture and can be written as Tempere2009 ; Shashi2014
| (1) | |||||
The first row of Eq. (1) represents the BEC part of the Hamiltonian, where () creates (annihilates) a boson of mass , momentum , and energy dispersion . The interaction of bosons within the BEC is given by the contact -wave interaction with Fourier transform . The impurity atom of momentum , mass and density as well as its interaction with the BEC via the potential are described by the second row in Eq. (1).
I.1 The Fröhlich polaron
Originally, the polaron concept was developed for condensed matter systems to describe electrons moving in a crystal lattice. The interaction between a moving electron and lattice of the ion cores forms a propagating quasi-particle called polaron, comprising electron and surrounding phonon cloud. Specifically the effective mass of the polaron as well as its energy could strongly differ from the bare electron’s values depending on the interaction with the crystal Landau1933 ; Pekar1951 . In the limit of very small electronic wave vector, the underlying crystal structure can be neglected, and the crystal can be described as a continuously polarizable medium. In this case, the model to describe polarons is the well-known Fröhlich Hamiltonian Froehlich1954
| (2) |
given by the sum of the kinetic energy of the impurity particle with mass , the energy of the phonons in the medium with dispersion , and the interaction energy with coupling constant arising between the two of them. The coupling strength is essentially determined by the dielectric constant of the crystal and can be quantified by a single, dimensionless coupling constant . The regime of small is characterized by weak and intermediate polaron coupling while for values of the strong coupling regime is realized. Simple perturbation theory predicts the crossover around a value of . Experimentally, Fröhlich polarons have been observed in condensed matter systems for small and moderate interaction strengths , however, the regime of so-called strong coupled polarons with has so far not been experimentally investigated Hodby1969 ; Landolt2002 .
Recently, the quantum gas Bose-polaron was subject of intense theoretical work. It was shown that the description of a Bose-polaron Eq. (1) can be directly mapped onto the Fröhlich Hamiltonian Eq. (2) via a Bogoliubov transform Tempere2009 and that this model could be accessed experimentally Grusdt2014 ; Shashi2014 . This analogy holds as long as the interaction between two BEC excitations can be neglected. The resulting Hamiltonian has the same operator structure as Eq. (2), where the crystal (optical) phonons are replaced by elementary Bogoliubov excitations of the BEC with dispersion , where is the sound velocity in the BEC, is the healing length, is the BEC atomic density, and is the -wave scattering length between two atoms in the BEC. The polaronic coupling parameter in the dilute quantum gas scenario Tempere2009 ; Grusdt2014
| (3) |
is given by the -wave scattering lengths between a Boson of the quantum gas with the impurity () or with other quantum gas atoms (), and the condensate healing length . For the quantum gas Bose-polaron, these parameters can be varied over a large range of values in the weakly interacting regime and the strong coupling regime by means of Feshbach resonances. Moreover, the characteristic properties of the emerging polaron which are the binding energy and its effective mass can be inferred by, e.g., radio frequency spectroscopy and trap frequency measurements, respectively Shashi2014 . Importantly, also the Bose polaron beyond the Fröhlich model can be experimentally realized yielding access to a rich and highly controllable model system of impurity physics in quantum fluids.
II Experimental Realization
Our experimental approach to realizing the Bose polaron aims at immersing single or few neutral Caesium (133Cs) atoms into a Rubidium (87Rb) BEC. This combination of species features several advantages, facilitating the realization, control and characterization of the Bose polaron. First, due to the relatively high nuclear charge of Rb and Cs the fine structure splitting of both species is also relatively large and allows to tune dipole traps in between the two fine structure lines of the first excited -level with moderate unwanted photon scattering LeBlanc2007 ; Arora2012 . As a consequence the atoms of this element do not experience a dipole potential. In order to improve the control over both species independently, we employ this fact constructing a species-selective lattice allowing for trapping and controlled transport of impurity atoms, only.
Second, for a dipole trap wavelength of nm, the trapping frequency and thus the gravitational sag with the gravitational acceleration, is equal to the percent level for the two species.
Third, using few or even single impurity atoms has several advantages. For Cs representing the minority component, three-body losses limiting the lifetime of the polaron are due to Rb-Rb-Cs collisions rather than Cs-Cs-Rb collision, where the loss coefficient of the former is an order of magnitude smaller than for the latter Spethmann2012 . While three-body losses will still be a limitation of the atomic lifetime, the lifetime of the polaron is expected to be significantly larger than the lifetime in balanced Rb-Cs mixtures. However, if the elastic interaction of multiple impurities is desired this can be controlled by adjusting the number of trapped impurities. Furthermore, fluorescence imaging of such a small number of atoms in an optical lattice allows for single-site resolved detection of the impurities with standard optical systems Karski2009 . Moreover, only the dynamics of a single impurity allows to dynamically track the trajectory of a polaron, because crossing of the trajectories of multiple indistinguishable impurities would lead to an ambiguity.
For the design of the experimental apparatus, additional considerations have to be made. In a combined system of quantum gas and single atoms, the respective ways to experimentally extract information from averages differ: For a quantum gas, a single realization yields an ensemble average of typically atoms. For single atoms, in contrast, averages have to be formed as time averages of typically repetitions for identical parameter values. For a combination, the statistics is clearly limited by probing the single impurity, while usually the time scale of a single experimental run is limited by the production of a BEC.
In the following we first discuss the experimentally relevant parameter ranges and constraints for our system of single Cs impurities in a Rb BEC, before we turn to the presentation of our experimental apparatus.
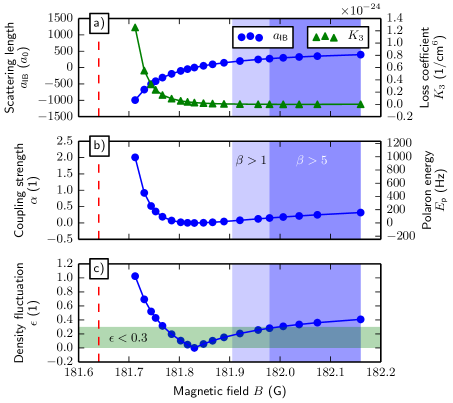
a) shows the theoretical values of the interspecies scattering length and the three-body loss coefficient for Rb-Rb-Cs scattering at the 181 G Feshbach resonance (dashed red). For our typical BEC density of the estimated coupling strength and the corresponding polaron energy is shown in b). The vertical blue shaded area indicates fulfillment of the condition ( light shaded). c) The parameter is derived in Grusdt2014 and gives an estimate of how well the Bose polaron fits the Fröhlich type. The horizontal green shaded area indicates which means good correspondence to the Fröhlich type polaron.
The Rb-Cs Bose-Polaron
For the experimental characterization of the Bose-Polaron, we focus on the binding energy in the following. This energy can be measured by radio or microwave spectroscopy, driving a Zeeman or hyperfine transition between two impurity states, where one state is interacting with the bosonic bath forming the polaron, whereas the other state is non-interacting Schirotzek2009 ; Kohstall2012 . The decay rate of the polaron implies a lower bound for the linewidth of the polaron spectroscopy peak and is dominated by three-body losses, i.e. molecule formation, occurring with rate with the loss coefficient and the BEC density . In order to clearly resolve the polaron peak at a frequency shift of , the ratio should be significantly larger than 1 yielding a figure of merit for the determination of optimum experimental parameters.
In Figure 1 we explore the regimes of Bose polarons realized with our typical experimental parameters discussed below, employing theoretical data of elastic scattering length and three-body loss coefficient around the interspecies Feshbach resonance at 181 G Wang2012 . The range of polaronic coupling strengths accessible with our experimental setup is determined by several parameters: the boson-boson scattering length vanKempen2002 , with the Bohr radius , is given by the background scattering length of Rb and does not change within the range of magnetic field values considered here; BEC peak densities are on the order of which serves as a worst case approximation for ; and the interspecies scattering length at zero magnetic field is tunable in the vicinity of the Feshbach resonance Pilch2009 ; Takekoshi2012 .
From this we calculate the polaron coupling constant and polaronic binding energy using a simple analytic expression for an impurity with infinite mass from Shashi2014 , see Figure 1(b). Furthermore, the polaronic decay rate is calculated from the BEC peak density and theoretical values for in vicinity of the Feshbach resonance Wang2012 . For , we can reliably resolve polarons spectroscopically within the discussed parameter ranges, indicated by the vertical shaded regions in Figure 1.
Furthermore, in Figure 1(c) we use the parameter from Grusdt2014 to indicate to which extend the Bose polaron realized can be described by means of the Fröhlich model discussed above, where corresponds to a good description. One can see that lies well below 1 for the experimentally directly accessible range (blue). For reference, the value of which is given in Grusdt2014 is marked as horizontally shaded area in Figure 1.
For observation of a strongly coupled Fröhlich polaron, clearly, the parameter range has to be adjusted by, for example, employing Feshbach resonances with more favorable three-body loss properties or optical tuning methods Compagno2014 , by increasing the sensitivity of the spectroscopic detection for a given life-time, and by adapting the BEC density via changes of the trap geometry. However, a Bose-polaron simulating the Fröhlich model in the weak and intermediate coupling regime is well accessible by immersing single neutral Cs atoms into a BEC with density of the order of .
Rb Bose-Einstein Condensate
In order to optimize the statistics of single atom probing, the experimental setup aims at a short BEC production time. This is realized by, first, a short initial laser cooling stage, where a 3D magneto-optical trap (MOT) is loaded from a 2D MOT in and, second, evaporation in a steep optical dipole trap which is formed by a horizontal and a vertical beam within . In order to avoid perturbation from cooling and trapping of single Cs atoms in a MOT, the Rb cloud is prepared in the magnetic field insensitive state while evaporating. We typically prepare a BEC with atoms at a peak density of and a critical temperature of approximately 120 nK. The BEC’s decay rate of 0.4 Hz is dominated by two- and three-body collisions at this density but decreases to 0.08 Hz for a lower number of atoms. For technical details of the BEC production and state preparation, see Section III.
Single Atoms
Single or few Cs atoms are captured in a high magnetic field gradient (G/cm) MOT Haubrich1996 , spatially overlapped with the Rb MOT, but operated at a different time in the preparation sequence. In contrast to the Rb MOT, the Cs MOT is loading atoms from the background, and the laser cooling beams have a smaller diameter and beam intensity, leading to an overall reduced loading rate.
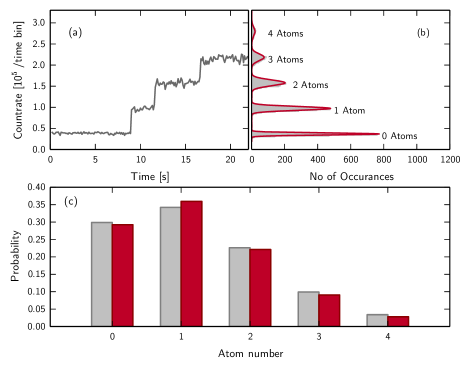
The fluorescence signal of such a MOT features discrete values, which can be assigned to a specific number of atoms in the MOT. A Poissonian distribution describes the loading statistics in the few atom regime, observed in a histogram of measured fluorescence signal, corresponding to the distribution of atom numbers in Figure 2 (b). The width of each histogram peak is ideally given by the shot noise of the atoms’ fluorescence light; practically, however, fluctuations of the MOT laser beam intensities and technical contributions such as readout noise additionally broaden the peaks. This limits the maximum countable atom number to roughly eight for our setup. Refer to Section III for technical details and a description of the fluorescence imaging system.
In order to provide position control over the single Cs atoms independently from the Rb BEC trap, we apply a species selective optical conveyor belt lattice, formed by two counter propagating, linearly polarized laser beams with wavelength and a waist of . For this wavelength between the Rb D-Lines, the resulting potential cancels out for Rb atoms LeBlanc2007 ; Arora2012 , but at the same time the frequency is blue detuned for Cs, providing tight confinement along the lattice axis in the nodes of the standing wave with depths up to , with the single photon recoil energy, , the Boltzmann constant, and the mass of a Cs atom. While the lattice provides tight axial confinement for Cs atoms, it does not confine the atoms radially. We therefore superpose the lattice axis with one beam of the dipole trap (see Section III) and obtain a maximum trap depth of 1.45 mK radially, resulting in trap frequencies of radially and axially. The lifetime of atoms in the lattice at full depth is limited to by phase fluctuations. If in addition an optical molasses is used to cool the atoms, the lifetime can be extended up to , limited by background pressure.
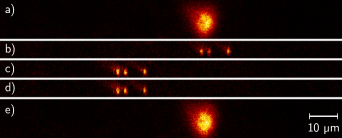
An important quantity characterizing the lattice is the selectivity for a given intensity and wavelength. By performing Raman-Nath Martin1988 ; Cahn1997 ; Gadway2009 scattering on the BEC for various lattice wavelengths, we have identified the optimal wavelength nm and find a selectivity of for Cs. In order to transport the Cs atoms by a defined distance, a precisely controlled relative detuning between the lattice beams is used, which causes the standing wave interference pattern to move at a velocity for a specific amount of time Kuhr2003B . For details also see Section III.
Combining Single Atoms with the Quantum Gas
During evaporation, the Rb cloud is prepared in the magnetic field insensitive state by a radio frequency transition, see Section III. After it has been sufficiently cooled down to be well localized in the dipole trap crossing region, the Cs MOT is switched on.
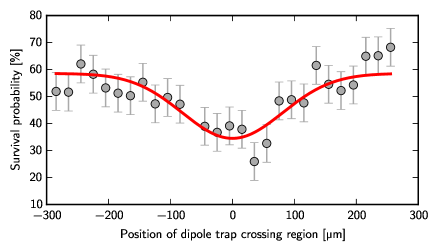
To avoid immediate losses of the single Cs atoms due to light-induced collisions Spethmann2012InsertingSingleCs ; Weber2010 ; Weiner1999 , both species are trapped in different traps with a displacement of . Figure 3 shows the probability of Cs atoms surviving a 1.3 s MOT period while a cold thermal Rb cloud is present in the dipole trap crossing region in dependence of the crossing region’s position. The minimum in survival probability marks the position of maximum overlap between MOT and dipole trap.
As an initial step towards immersing the Cs atoms into the Rb BEC, we immerse them into a thermal Rb gas.
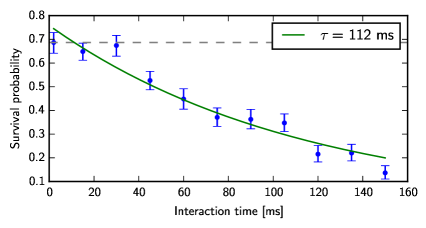
Here, the horizontal dipole trap is sufficiently deep to directly trap Cs atoms from the MOT. After switching off the Cs MOT, we let the two species interact for a certain time before pushing Rb out of the trap by shining in resonant light perpendicular to both dipole trap beams. The high gradient MOT is switched on to recapture the Cs atoms from the dipole trap and the number of atoms in both MOT phases is compared to each other. Figure 4 shows a measurement of the survival probability in dependence of the time between switching off the Cs MOT and pushing out the Rb, which we refer to as ’interaction time’. For a Rb cloud in with at a temperature of at trap frequencies of and a peak density of , we measure a lifetime of for Cs atoms in . This is lower than expected because with a 3-body loss coefficient of Spethmann2012 the 3-body loss-rate can be calculated to be at peak Rb density and the Cs atoms should see a lower average density. We have not yet fully examined which processes limit the lifetime, but we expect two-body losses to play a role since the two species are not yet optically pumped to their lowest Zeeman substate.
III Methods
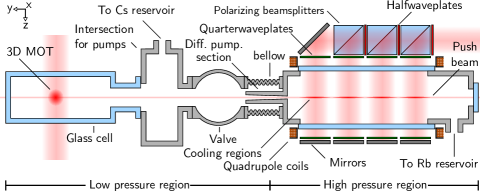
Our experiments take place in a two-chamber vacuum system (see Figure 5 and 6) consisting of a low pressure ( mbar) and a high pressure region ( mbar), separated by a differential pumping section of length 83 mm and diameter increasing from 1.8 mm to 4 mm. The low pressure region is formed by a glass cell, whereas the high pressure region is located in a titanium chamber and contains the 2D MOT for 87Rb which is loading atoms from the background gas. The distance between the 3D MOT region and the 2D MOT is approximately cm.
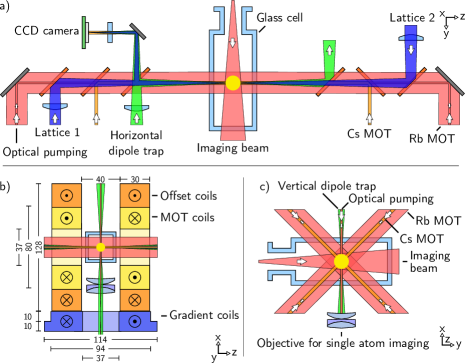
The coil system shown in Figure 6 b) is installed at the low pressure side, providing a quadrupole field for the Cs and Rb MOTs, a homogeneous field to address Feshbach resonances, and a vertical magnetic field gradient for Stern-Gerlach experiments. Additionally, compensation coils are installed to provide weak, homogeneous fields in all three dimensions up to to compensate magnetic stray fields.
Cooling and Trapping
Magneto Optical Traps for 87Rb
The 2D MOT Dieckmann1998 setup is based on a design described in Gericke2007a ; Utfeld2006 . The elongated titanium vacuum chamber features four windows with a clear aperture of 110 mm x 25 mm as an optical access for the MOT beams. Four distinct cooling regions are formed by orthogonal retro-reflected beams with diameters of , and a viewport allows for an additional near-resonant beam (’push-beam’) along the cooling axis to increase the flux of the atomic beam. It is 1.9 MHz blue detuned from the transition with an intensity of 120 . The windows are surrounded by two quadrupole coil pairs, each coil consisting of 130 windings of 1 mm enameled copper wire. We typically operate the MOT at magnetic field gradients of in vertical and horizontal direction. Our 3D MOT features a standard six beam configuration, where detuning and intensity can be controlled independently of the 2D MOT beams.
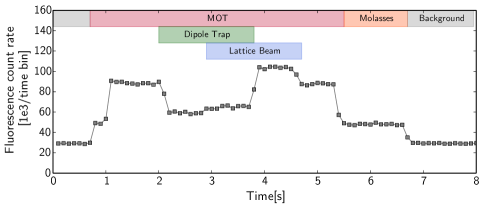
We usually load the 3D MOT from the 2D MOT atomic beam for at a loading rate of before we enter a compressed MOT (’CMOT’) phase Ketterle1993 ; Lewandowski2003 (see Figure 7). The parameters for these Rb MOTs are listed in Table 1.
| 2D MOT | 3D MOT | CMOT | |
| cooler power | 240 mW | 100 mW | 50 mW |
| cooler detuning | -13.2 MHz | -13.9 MHz | -58 MHz |
| repumper power | 28 mW | 30 mW | 14.8 µW |
| repumper detuning | -5 MHz | -5 MHz | -5 MHz |
| beam size | 12.5 mm | 10 mm | 10 mm |
| magnetic field gradient | radially | ||
| axially | |||
The laser light for operation of Rubidium MOTs, internal state manipulation and detection is provided by the master oscillator power amplifier (MOPA) setup shown in Figure 8.
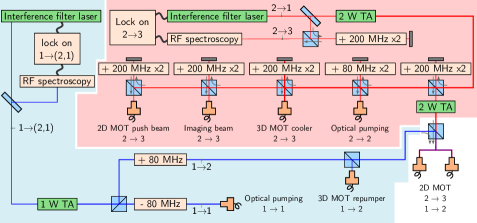
We employ interference-filter-stabilized extended-cavity diode lasers Baillard2006 (Radiant Dyes NarrowDiode), frequency stabilized to a frequency-modulation spectroscopy of Rubidium 87. The lasers’ output power of is amplified by home-made tapered amplifiers (TAs) up to 2 W, frequency shifted by acousto-optical modulators (AOMs) and transported to the experiment via polarization maintaining, optical single-mode fibers (Nufern PM780-HP).
Single Atom MOT
The position of the Cs MOT is overlapped with the Rb MOT as both use the same coil system. A set of 6 diaphragms with variable aperture mounted in the coil holders is used to align the MOT beams to precisely overlap in the middle of the glass cell. The cooling light is 10 MHz red detuned to the F=4 F’=5 transition of the Cs D2 line and has a total power of typically . The repumping light is on resonance to the F=3 F’=3 transition with a total power of typically . In every beam pair a piezo driven mirror at 110 Hz frequency destroys phase coherence between orthogonal beam pairs and therefore avoids interference effects, which lead to an instable MOT position. To keep the MOT loading time short, a low magnetic field gradient of 40 axially and 20 radially is applied for 20 ms. During this sufficiently short time the trap volume is large enough to load on average one atom Kuhr2003 . In a next step the magnetic field gradient is increased in to 275 in axial and 140 in radial direction. This effectively pins the atom number and avoids additional atom loading during the imaging process. The duration of the low gradient stage depends on the vapor pressure of the Cs atoms and the required atom number. For an efficient transfer of the trapped atoms into the optical dipole trap, a low MOT temperature is needed. Therefore we increase the red detuning of the cooler light to 72 MHz for 50 ms, while setting its power so low that we just do not lose the atoms. We release the atoms into the dipole trap by switching off the MOT beams. The cooler is switched off after the repumper ensuring that the atoms remain in their lowest fine-structure state .
Optical Dipole Trap
Our optical dipole trap is a crossed beam trap at 1064 nm. The trap is formed by a horizontal beam with a focal waist of at and a vertical beam with a focal waist of at of power. We measure trap frequencies of radial to the horizontal beam and along the horizontal beam, while the axial confinement is mainly caused by the vertical beam. The beam setup allows both for a forced evaporation scheme Clement2009 as well as standard, passive evaporation Arnold2011 . We keep the pointing instability minimal by using optical fibers to transport the light to the experiment (LMA-PM-15 by NKT Photonics for the vertical beam and Liekki Passive-10/125-PM for the horizontal beam). AOMs between the laser light source (Nufern NUA-1064-PD-0050-D0 fiber amplifier) and the optical fibers are controlled by a PID controller that determines and stabilizes the laser power at the experiment with a bandwidth of .
Evaporative Cooling
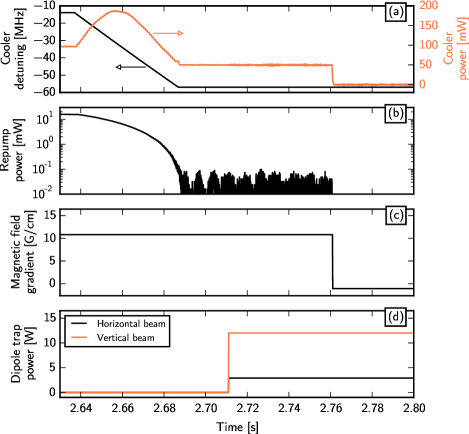
Both beams are switched on at full power during the CMOT phase. At the end of the CMOT phase, the MOT lasers and the quadrupole field are switched off. The repumping light is switched off before the cooling light, so that the atoms are pumped to the state and approx. atoms are transferred to the dipole trap. Figure 9 shows our subsequent evaporation scheme.
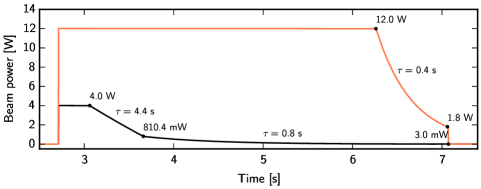
After of self-evaporation we decrease the horizontal beam’s power exponentially in two sections with different decay constants . As soon as the increase in density within the crossing region leads to three-body losses, we also ramp down the power of the vertical beam until a BEC with atoms forms after a total evaporation time of . The entire BEC sequence, including 3D MOT loading, CMOT phase and evaporation ramps has been optimized with an evolutionary algorithm, that is implemented as a part of our timing software EvolAlgo .
Internal State Preparation
The Rb atoms are prepared in the magnetically insensitive state during evaporation so that the magnetic field gradient of the single atom MOT does neither heat nor destroy the cold Rb cloud: During self-evaporation, a magnetic field of is switched on to lift the degeneracy of the Zeeman substates. Then the atoms are pumped to the state by a light pulse resonant to the -transition and a light pulse resonant to the -transition of the line. Both beams are turned on simultaneously. Their respective powers are and with red detunings of and at equal beam waists of .
By applying a magnetic field gradient of typically during a time of flight experiment (see Fig. 10), we perform a Stern-Gerlach experiment to measure the population of magnetic substates.
Without optical pumping we observe an almost equally distributed spin mixture, while with optical pumping approximately of the atoms are in the Zeeman substate and approximately remain in . Optical pumping does not deplete the number of atoms in the condensate.
After optical pumping we transfer the population to the state with a Landau-Zener sweep as shown in Figure 10: We apply a radio frequency at for while we increase the magnetic field linearly. The magnetic field ramp is chosen such that the detuning of the radio frequency with respect to the transition falls from approximately to . We observe a Rabi-frequency of with a transfer efficiency of , with no negative impact on the number of atoms in the BEC.
Imaging
We image the Rb cloud by absorption imaging with linearly polarized light resonant to the transition of the line, see Figures 6 and 11.
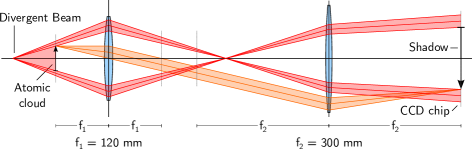
To observe the single atoms we use fluorescence imaging. Near resonant light from the MOT beams is scattered in the whole solid angle. We collect 3.3% of the photons corresponding to for a saturation parameter by a custom made objective. It has a numerical aperture (NA) of 0.36 and is placed beneath the glass cell at a distance of 30.3 mm to the atoms’ position (see Figure 6c). Stray light protection is crucial and the whole beam path is located inside black anodized lens tubes and mirror housings.
The objective tube is mounted on a precision xyz linear stage (Newport Ultralign Model 562-XYZ) for accurate positioning. The light which is collimated by the objective is focused onto an EMCCD camera (Andor iXon 3 897) by a lens with focal length . This yields a magnification of M=33. The camera chip has with a pixel size of which leads to a field of view of . An advantage of this setup is that the objective can be aligned independently from the focusing lens which is producing the image on the camera.
The high EMCCD gain and the quantum efficiency of nearly 60% of the camera allows to observe single atoms in the MOT as well as in the optical lattice (see Figure 12). During imaging the atoms are illuminated by the repumper light of the MOT and cooler light, which is 20 MHz red detuned in order to compensate the light shift caused by the dipole trap. Exposure times of 150 ms (400 ms) in the MOT (lattice) are usually used to image the atoms. The number of atoms in the MOT can be determined with close to 100 % reliability from the brightness of the image.
Optical Lattice
Our optical lattice consists of a two beam setup (see Figure 6), where both beams are guided to the experiment by means of optical fibres with identical length. This helps to reduce phase drifts and guarantees a good beam quality at the experimental side. To make sure that both beams hit the small-volume Cs MOT, we exploit the AC stark effect. The dipole trap is red detuned and hence reduces the fluorescence light of the MOT, whereas the lattice frequency is blue detuned and enhances the fluorescence (see Figure 13).
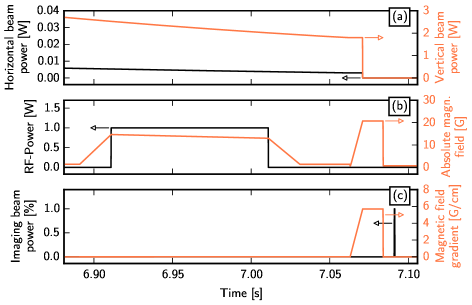
Lattice Transport
For the single atom transport in the conveyor belt optical lattice Kuhr2003B , a relative detuning between the two lattice beams is employed to create a standing wave pattern, moving at velocity . For a typical transport, the detuning between the beams is ramped in a trapezoid shape: a linear ramp from zero to the maximum detuning yields an acceleration of the atoms in the lattice, followed by a plateau of constant detuning where the atoms move at constant velocity. After this plateau, the detuning is ramped back to zero and the atoms are decelerated again. The transport distance is given by the integral over the velocity. Thereby large transport distances in the range of millimeters can be realized, which are only limited by trap size. This is in contrast to phase shifting transport approaches, where the maximum transport distance is given by the maximum phase shift Belmechri2013 . The absolute maximum acceleration in the lattice is determined by the Cs mass , the laser wave number and the potential depth of the standing wave potential.
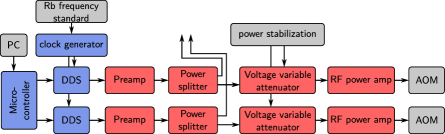
In order to control the detuning, each lattice beam is frequency shifted by a common value of in an AOM double-pass setup. The relative detuning between the two beams then is given by and can be controlled by the two RF frequencies supplied to the AOMs. Both RF signals have to be phase-stable compared to each other and the offset-frequency of both channels has to be equal up to a fraction of a Hertz to yield a stable standing wave pattern when both beams interfere for Hz. Therefore, we use a driver electronics based on direct digital synthesis (’DDS’) with an amplifier chain shown in Figure 14. The DDS chips employed (AD9954) sample the output sine wave in a digital circuit and have an analog digital converter stage for signal output. By supplying both DDS chips with the same clock signal which is locked to a Rb frequency standard, the relative phase stability between the signals is guaranteed by the digital sampling of the output signal. The frequency of the output sine wave is set by a 32 bit control parameter, yielding a frequency resolution of 0.09 Hz which allows for very small frequency variations compared to the output frequency of 80 MHz. To supply output powers of up to 30 dBm a two stage amplifier chain combined with a voltage controlled attenuator for output power control is applied. The RF power level can be directly used to adjust and stabilize the light intensity of the lattice beams. The DDS chips are controlled by a microcontroller which provides exact timing of frequency changes and stores the data for the frequency ramps.
IV Conclusion
Our experimental results constitute an ideal starting point for studying coherent interactions of single Cs impurities in a Rb BEC. We have shown that, for this system, the experimental realization, control and detection of a Bose polaron in the weak and intermediate coupling regime of the Fröhlich model is accessible. Moreover, our experimental apparatus not only facilitates the creation of a tunable Bose polaron but it also allows for controlled positioning and dynamical studies of impurities in a quantum fluid.
Acknowledgements
The project was financially supported partially by the European Union via the ERC Starting Grant 278208 and partially by the DFG via SFB/TR49. D.M. acknowledges funding by the graduate school of excellence MAINZ, F.S. acknowledges funding by Studienstiftung des deutschen Volkes, and T.L. acknowledges funding from Carl-Zeiss Stiftung.
References
- (1) Ng, H.T., Bose, S.: Single-atom-aided probe of the decoherence of a bose-einstein condensate. Phys. Rev. A 78, 023610 (2008). doi:10.1103/PhysRevA.78.023610
- (2) Daley, A.J., Fedichev, P.O., Zoller, P.: Single-atom cooling by superfluid immersion: A nondestructive method for qubits. Phys. Rev. A 69, 022306 (2004). doi:10.1103/PhysRevA.69.022306
- (3) Griessner, A., Daley, A.J., Clark, S.R., Jaksch, D., Zoller, P.: Dark-state cooling of atoms by superfluid immersion. Phys. Rev. Lett. 97, 220403 (2006). doi:10.1103/PhysRevLett.97.220403
- (4) Klein, A., Fleischhauer, M.: Interaction of impurity atoms in bose-einstein condensates. Phys. Rev. A 71, 033605 (2005). doi:10.1103/PhysRevA.71.033605
- (5) Cucchietti, F.M., Timmermans, E.: Strong-coupling polarons in dilute gas bose-einstein condensates. Phys. Rev. Lett. 96, 210401 (2006). doi:10.1103/PhysRevLett.96.210401
- (6) Tempere, J., Casteels, W., Oberthaler, M.K., Knoop, S., Timmermans, E., Devreese, J.T.: Feynman path-integral treatment of the bec-impurity polaron. Phys. Rev. B 80, 184504 (2009). doi:10.1103/PhysRevB.80.184504
- (7) Grusdt, F., Shchadilova, Y., Rubtsov, A., Demler, E.: Renormalization group approach to the fröhlich polaron model: application to impurity-bec problem. arXiv preprint arXiv:1410.2203 (2014)
- (8) Klein, A., Bruderer, M., Clark, S.R., Jaksch, D.: Dynamics, dephasing and clustering of impurity atoms in bose–einstein condensates. New J. Phys. 9, 411 (2007). doi:10.1088/1367-2630/9/11/411
- (9) Palzer, S., Zipkes, C., Sias, C., Köhl, M.: Quantum transport through a tonks-girardeau gas. Phys. Rev. Lett. 103, 150601 (2009). doi:10.1103/PhysRevLett.103.150601
- (10) Fukuhara, T., Kantian, A., Endres, M., Cheneau, M., Schauß, P., Hild, S., Bellem, D., Schollwöck, U., Giamarchi, T., Gross, C., Bloch, I., Kuhr, S.: Quantum dynamics of a mobile spin impurity. Nature 9, 235–241 (2009). doi:10.1038/nphys2561
- (11) Ospelkaus, S., Ospelkaus, C., Wille, O., Succo, M., Ernst, P., Sengstock, K., Bongs, K.: Localization of bosonic atoms by fermionic impurities in a three-dimensional optical lattice. Phys. Rev. Lett. 96, 180403 (2006). doi:10.1103/PhysRevLett.96.180403
- (12) Scelle, R., Rentrop, T., Trautmann, A., Schuster, T., Oberthaler, M.K.: Motional coherence of fermions immersed in a bose gas. Phys. Rev. Lett. 111, 070401 (2013). doi:10.1103/PhysRevLett.111.070401
- (13) Zipkes, C., Palzer, S., Sias, C., Köhl, M.: A trapped single ion inside a bose–einstein condensate. Nature 464, 388–391 (2010). doi:10.1038/nature08865
- (14) Schmid, S., A., H., Hecker Denschlag, J.: Dynamics of a cold trapped ion in a bose-einstein condensate. Phys. Rev. Lett. 105, 133202 (2010). doi:10.1103/PhysRevLett.105.133202
- (15) Balewski, J.B., Krupp, A.T., Gaj, A., Peter, D., Büchler, H.P., Löw, R., Hofferberth, S., Pfau, T.: Coupling a single electron to a bose–einstein condensate. Nature 502, 664–667 (2013). doi:10.1038/nature12592
- (16) Shashi, A., Grusdt, F., Abanin, D.A., Demler, E.: Radio-frequency spectroscopy of polarons in ultracold bose gases. Phys. Rev. A 89, 053617 (2014). doi:10.1103/PhysRevA.89.053617
- (17) Landau, L.D. Phys. Z. Sowjetunion 3, 664 (1933)
- (18) Pekar, S.I.: Research in Electron Theory of Crystals, Moscow (1951)
- (19) Fröhlich, H.: Electrons in lattice fields. Advances in Physics 3(11), 325–361 (1954). doi:10.1080/00018735400101213. http://dx.doi.org/10.1080/00018735400101213
- (20) Hodby, J.W.: Cyclotron resonance of the polaron in the alkali and silver halides - observation of the dependence of the effective mass of the polaron on its translational energy. Solid State Communications 7(11), 811–814 (1969). doi:10.1016/0038-1098(69)90767-4
- (21) Indium antimonide (insb), conduction band, effective masses. In: Madelung, O., Rössler, U., Schulz, M. (eds.) Group IV Elements, IV-IV and III-V Compounds. Part B - Electronic, Transport, Optical and Other Properties. Landolt-Börnstein - Group III Condensed Matter, vol. 41A1b, pp. 1–10. Springer (2002). doi:10.1007/10832182-371
- (22) LeBlanc, L.J., Thywissen, J.H.: Species-specific optical lattices. Phys. Rev. A 75, 053612 (2007). doi:10.1103/PhysRevA.75.053612
- (23) Arora, B., Sahoo, B.K.: State-insensitive trapping of rb atoms: Linearly versus circularly polarized light. Phys. Rev. A 86, 033416 (2012). doi:10.1103/PhysRevA.86.033416
- (24) Spethmann, N., Kindermann, F., John, S., Weber, C., Meschede, D., Widera, A.: Dynamics of single neutral impurity atoms immersed in an ultracold gas. Phys. Rev. Lett. 109, 235301 (2012). doi:10.1103/PhysRevLett.109.235301
- (25) Karski, M., Förster, L., Choi, J.M., Alt, W., Widera, A., Meschede, D.: Nearest-neighbor detection of atoms in a 1d optical lattice by fluorescence imaging. Phys. Rev. Lett. 102, 053001 (2009). doi:10.1103/PhysRevLett.102.053001
- (26) Schirotzek, A., Wu, C.-H., Sommer, A., Zwierlein, M.W.: Observation of fermi polarons in a tunable fermi liquid of ultracold atoms. Phys. Rev. Lett. 102, 230402 (2009). doi:10.1103/PhysRevLett.102.230402
- (27) Kohstall, C., Zaccanti, M., Jag, M., Trenkwalder, A., Massignan, P., Bruun, G.M., Schreck, F., Grimm, R.: Metastability and coherence of repulsive polarons in a strongly interacting Fermi mixture. Nature 485(7400), 615–618 (2012)
- (28) Wang, Y. private communication (2012)
- (29) van Kempen, E.G.M., Kokkelmans, S.J.J.M.F., Heinzen, D.J., Verhaar, B.J.: Interisotope determination of ultracold rubidium interactions from three high-precision experiments. Phys. Rev. Lett. 88, 093201 (2002). doi:10.1103/PhysRevLett.88.093201
- (30) Pilch, K., Lange, A.D., Prantner, A., Kerner, G., Ferlaino, F., Nägerl, H.-C., Grimm, R.: Observation of interspecies feshbach resonances in an ultracold rb-cs mixture. Phys. Rev. A 79, 042718 (2009). doi:10.1103/PhysRevA.79.042718
- (31) Takekoshi, T., Debatin, M., Rameshan, R., Ferlaino, F., Grimm, R., Nägerl, H.-C., Le Sueur, C.R., Hutson, J.M., Julienne, P.S., Kotochigova, S., Tiemann, E.: Towards the production of ultracold ground-state rbcs molecules: Feshbach resonances, weakly bound states, and the coupled-channel model. Phys. Rev. A 85, 032506 (2012). doi:10.1103/PhysRevA.85.032506
- (32) Compagno, E., De Chiara, G., Angelakis, D.G., Palma, G.M.: Tunable polarons in bose-einstein condensates. arXiv 1410.8833 (2014)
- (33) Haubrich, D., Schadwinkel, H.: Observation of individual neutral atoms in magnetic and magneto-optical traps. EPL 663 (1996)
- (34) Martin, P.J., Oldaker, B.G., Miklich, A.H., Pritchard, D.E.: Bragg scattering of atoms from a standing light wave. Phys. Rev. Lett. 60, 515–518 (1988). doi:10.1103/PhysRevLett.60.515
- (35) Cahn, S.B., Kumarakrishnan, A., Shim, U., Sleator, T., Berman, P.R., Dubetsky, B.: Time-domain de broglie wave interferometry. Phys. Rev. Lett. 79, 784–787 (1997). doi:10.1103/PhysRevLett.79.784
- (36) Gadway, B., Pertot, D., Reimann, R., Cohen, M.G., Schneble, D.: Analysis of kapitza-dirac diffraction patterns beyond the raman-nath regime. Opt. Express 17(21), 19173–19180 (2009). doi:10.1364/OE.17.019173
- (37) Kuhr, S., Alt, W., Schrader, D., Dotsenko, I., Miroshnychenko, Y., Rosenfeld, W., Khudaverdyan, M., Gomer, V., Rauschenbeutel, A., Meschede, D.: Coherence properties and quantum state transportation in an optical conveyor belt. Phys. Rev. Lett. 91, 213002 (2003). doi:10.1103/PhysRevLett.91.213002
- (38) Spethmann, N., Kindermann, F., John, S., Weber, C., Meschede, D., Widera, A.: Inserting single cs atoms into an ultracold rb gas. Applied Physics B 106, 513–519 (2012)
- (39) Weber, C., John, S., Spethmann, N., Meschede, D., Widera, A.: Single cs atoms as collisional probes in a large rb magneto-optical trap. Phys. Rev. A 82, 042722 (2010). doi:10.1103/PhysRevA.82.042722
- (40) Weiner, J., Bagnato, V.S., Zilio, S., Julienne, P.S.: Experiments and theory in cold and ultracold collisions. Rev. Mod. Phys. 71, 1–85 (1999). doi:10.1103/RevModPhys.71.1
- (41) Dieckmann, K., Spreeuw, R.J.C., Weidemüller, M., Walraven, J.T.M.: Two-dimensional magneto-optical trap as a source of slow atoms. Phys. Rev. A 58, 3891–3895 (1998). doi:10.1103/PhysRevA.58.3891
- (42) Gericke, T., Würtz, P., Reitz, D., Utfeld, C., Ott, H.: All-optical formation of a bose–einstein condensate for applications in scanning electron microscopy. Applied Physics B 89(4), 447–451 (2007). doi:10.1007/s00340-007-2862-9
- (43) Utfeld, C.: Aufbau einer hochleistungsquelle für ultrakalte atome. Master’s thesis, Johannes Gutenberg-Universität Mainz (November 2006)
- (44) Ketterle, W., Davis, K.B., Joffe, M.A., Martin, A., Pritchard, D.E.: High densities of cold atoms in a dark spontaneous-force optical trap. Phys. Rev. Lett. 70, 2253–2256 (1993). doi:10.1103/PhysRevLett.70.2253
- (45) Lewandowski, H.J., Harber, D., Whitaker, D.L., Cornell, E.: Simplified system for creating a bose–einstein condensate. Journal of low temperature physics 132(5-6), 309–367 (2003)
- (46) Baillard, X., Gauguet, A., Bize, S., Lemonde, P., Laurent, P., Clairon, A., Rosenbusch, P.: Interference-filter-stabilized external-cavity diode lasers. Optics Communications 266(2), 609–613 (2006). doi:10.1016/j.optcom.2006.05.011
- (47) Kuhr, S.: A controlled quantum system of individual neutral atoms. PhD thesis, Bonn (2003)
- (48) Clément, J.-F., Brantut, J.-P., Robert-de-Saint-Vincent, M., Nyman, R.A., Aspect, A., Bourdel, T., Bouyer, P.: All-optical runaway evaporation to bose-einstein condensation. Phys. Rev. A 79, 061406 (2009). doi:10.1103/PhysRevA.79.061406
- (49) Arnold, K.J., Barrett, M.D.: All-optical bec in a 1.06 micron dipole trap. Optics Communications, Volume 3288-3291 Optics 3288-3291, –2841315201132883291 (2011). 1101.1140
- (50) Lausch, et al.: Paper in preparation
- (51) Belmechri, N., Förster, L., Alt, W., Widera, A., Meschede, D., Alberti, A.: Microwave control of atomic motional states in a spin-dependent optical lattice. Journal of Physics B: Atomic, Molecular and Optical Physics 46(10) (2013). doi:10.1088/0953-4075/46/10/104006