Experimental study of balanced optical homodyne and heterodyne detection by controlling sideband modulation
Abstract
We experimentally study optical homodyne and heterodyne detections with a same setup, which is flexible to manipulate the signal sideband modulation. When the modulation only generate a single signal sideband, the light field measurement by mixing the single sideband at with a strong local oscillator at the carrier frequency on a beam splitter become balanced heterodyne detection. When two signal sidebands at are generated and the relative phase of the two sidebands is locked, this measurement corresponds to optical balanced homodyne detection. With this setup, we may confirm directly that the signal-to-noise ratio with heterodyne detection is two-fold worse than that with homodyne detection. This work will have important applications in quantum state measurement and quantum information.
I Introduction
Optical homodyne and heterodyne detections are the extremely useful and flexible measuring methods and have the broad applications in optical communication 1 ; 2 , weak signal detection 3 . In general, optical homodyne and heterodyne detections are defined as the difference of the optical frequencies of the two mixed field is zero and nonzero respectively. When the signal is mixed with a relative strong local oscillator (LO) on a 50 beam splitter, the two output modes are detected by a pair of detectors and the difference of two photocurrents can be measured, this scheme corresponds to balanced homodyne and heterodyne detections. It is well known that balanced detection can cancel the noise resulting from local oscillator 4 ; 5 . Balance homodyne detection is phase sensitive and has been intensively utilized to measure non-classical states of light 6 ; 7 ; 8 ; 9 ; 10 and further in quantum information experiments 11 ; 12 ; 13 ; 14 . Heterodyne detection has been shown that its signal-to-noise ratio is two-fold worse than that with homodyne detection 4 ; 5 ; 15 ; 16 .
II Experimental setup and results
In this paper, we use sideband method 17 ; 18 in quantum optics to investigate balanced homodyne and heterodyne detections in a same setup. When only mixing the single sideband signal at with a strong LO at the carrier frequency on a 50 beam splitter, this measurement corresponds to balanced heterodyne detection. When there are two signal sidebands at and the relative phase of the two sidebands is locked, this measurement corresponds to balanced homodyne detection. Although the frequencies of two sidebands are different with that of LO, it still refer as balanced homodyne detection since two sidebands locate symmetrically at the two sides of the carrier frequency of LO, and at the same time the relative phase of two sidebands is fixed. This balanced homodyne detection for two sidebands has been exploited widely in quantum optics experiments 6 ; 7 ; 8 ; 19 ; 20 . We will demonstrate that this balanced homodyne detection is also phase-sensitive and its signal-to-noise ratio is two-fold better than that with heterodyne detection. This work gives the deeper understanding of optical homodyne and heterodyne detections and the closely relationship between them. Moreover, the scheme of generating two sidebands in this paper is different from the general method of phase-modulation (or amplitude-modulation) by an electro-optic modulator (EOM). A laser with frequency is phase-modulated (or amplitude-modulated) by EOM with frequency to generate two sidebands , hence, this light includes a strong carrier field and two sidebands. The signal field in this work only has two sidebands and the optical field at carrier frequency is vacuum, which will have the special applications in quantum information and communication.
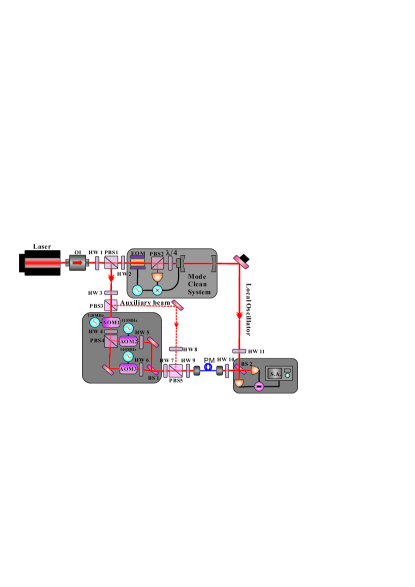
Figure 1 shows the experimental setup. A continuous-wave single-frequency coherent laser at 1064 nm is split into two parts. One passes through a mode clean cavity to be used for the LO in the balanced detection system. The other is sent through three acousto-optic modulators (AOMs, 3110-197, Crystal Technology) for generating signal sidebands. The laser first is frequency down-shifted by the negative first-order diffraction of AOM1 with the frequency -110 MHz. Then the downshift laser is split into two, which are frequency up-shifted by the positive first-order diffraction of AOM2 with +115 MHz and AOM3 with +105 MHz, respectively. The two frequency-shifted beams are combined on 50 BS1 with the same polarization, so the two sidebands at MHz is generated. Here, the sinusoidal signals of AOMs are provided by three signal generators (N9310A, Agilent) respectively and the diffraction efficiency of all AOM’s are about 70 . The two-sideband field is coupled into a single-mode polarization-maintaining fiber and then combined with a strong local oscillator on 50 BS2 with the same polarization. The output fields of BS2 are detected by two balanced detectors, the substraction of whose photocurrents is measured by the spectrum analyzer. The single sideband can be obtained by blocking the incident beam of AOM2 (or AOM3). Here, an auxiliary beam without frequency shift is used to adjust the visibility of the interference between the local and the signal. When measuring data, the auxiliary beam will be blocked.
The difference photocurrent of the balanced detection can be expressed as
| (1) | |||||
The LO field can be written as , and the signal field as , which includes two sidebands. Here, is the relative phase between the LO and signal field. Hence, the photocurrent of the signal field is written as
| (2) |
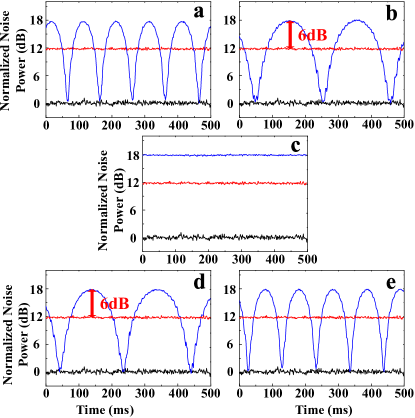
Here, two terms represent the two beatnotes of the two sidebands with LO respectively. Case 1: When only one signal sideband is applied ( or ), the signal strength become at the frequency of , where and . We can see the signal strength becomes constant and is independent of the relative phase between the LO and signal field for single signal sideband, as shown in Fig. 2 (red line). This case corresponds to balanced heterodyne detection. Case 2: When two signal sidebands are applied at the same time and have the same amplitude with , the difference photocurrent can be written as
| (3) |
The signal strength measured by spectrum analyzer becomes at the frequency of . Compared with the single signal sideband, there are several new characteristics (blue line in Fig. 2 (a), (b), (d) and (e). First, the signal strength has a periodical modulation with the frequency . Second, the maximum signal strength for two signal sidebands is four-fold larger than that for single signal sideband. The minimum signal strength reaches the shot noise limit. When the difference of the frequencies of two signal sidebands is zero (), the signal strength becomes . Here, the relative phase may be the relative phase between up and down sideband or between the LO and signal field. When the relative phase between up and down sideband is fixed, this case corresponds to balanced homodyne detection, which is phase sensitive to the relative phase between the LO and signal field. When the relative phase is zero, the signal strength reaches the maximum value (blue line in Fig. 2(c)), which corresponds the constructive inference of two sidebands. When the relative phase is , the signal strength become zero (shot noise level), which corresponds the destructive inference of two sidebands.
As above discussion, only when the two signal sideband frequencies are same and the relative phase is fixed, the measurement becomes the balanced homodyne detection. Here we develop two methods to lock the relative phase between up and down sideband.
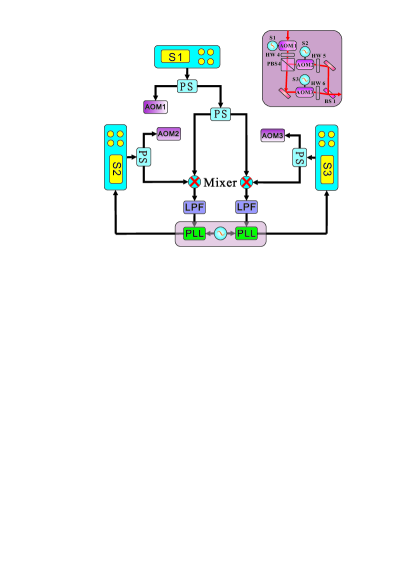
Method 1. Figure 3 shows the schematic diagram of locking the relative phase between up and down sideband. The sinusoidal signal output of the signal generator 1 is divided two parts: one is used to drive the AOM1 and the other is further divided two parts to mix with the output of the signal generator 2 and 3. The sinusoidal signal output of the signal generator 2 (3) is also divided two parts: one is used to drive the AOM2 (AOM3) and the other is to mix with the output of the signal generator 1. Two sinusoidal signals from the signal generators 1 and 2 (1 and 3) are mixed down to generate about 5 MHz signal using a mixer (Mini-Circuits ZAD-6+). The mixer’s output signal of about 5 MHz pass through a low-pass in order to filter the high frequency signals of the inputs of the mixer. Thus we obtain two ways of 5 MHz signal, which correspond to two sideband frequencies and respectively. Two ways of 5 MHz signal are electronically phase-locked to a same 5 MHz reference signal by two phase locked loops (PLL). The output error signal of the PLL contains the relevant information abut the frequency and phase difference between two input signals. Two ways of the error signal, after the proportional-integral-derivative controller, are feedback into the signal generator 2 and 3 respectively. When the frequency are same and the relative phase between up and down sideband is locked, the optical field with two signal sidebands can be phase-sensitively detected by the balanced homodyne detection.
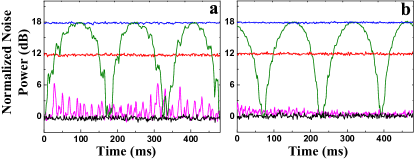
By controlling the phase of the LO, the relative phase between the LO and signal field can be fixed with zero and the signal strength reaches the maximum value (blue line in Fig. 5(a)). When the relative phase is fixed with , the signal strength becomes zero and reaches the shot noise level (pink line in Fig. 5(a)). This pink line presents the large fluctuation due to imperfect locking. When we scan the phase of LO field, the signal strength presents a periodical change (green line in Fig. 5(a)).
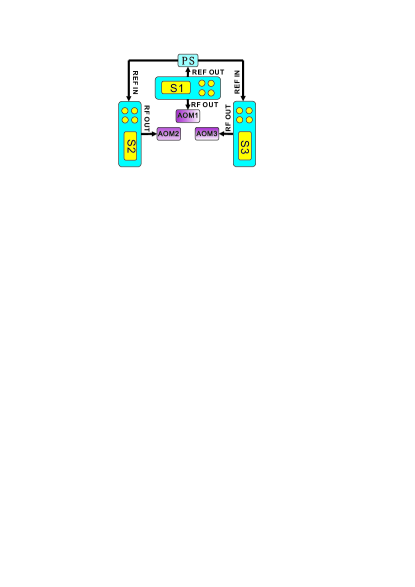
Method 2. Here, we present a simpler scheme to make the frequencies and the relative phase of the up and down sidebands locked by using the clock synchronization of Agilent signal generators. The three signal generators can be locked together in frequency and phase by using the same reference (clock) frequency. So the sinusoidal signal outputs are generated from the same clock source. For instance, the signal generators 1 serves as the master reference, whose signal first is locked with its internal reference. The reference output of the signal generators 1 is connected with the external reference input of the signal generators 2 and 3. The signals of the signal generators 2 and 3 are locked with the external reference. The result of the balanced homodyne detection is shown as Fig. 5(b), which is better than that with the method 1.
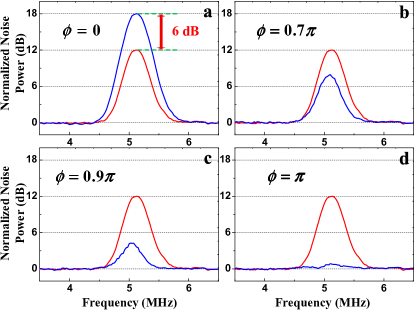
We further measure the noise spectra with the frequency span of 3 MHz when locking the frequency and phase of the two sidebands with method 2. The red line in Fig. 6 presents the case of one signal sideband, which corresponds to balanced heterodyne detection. The signal-to-noise ratio for one signal sideband is 12 dB, which is independent of the relative phase between the LO and signal field for single signal sideband. When two signal sidebands are applied and the phase of the two sidebands are locked, the signal-to-noise ratio is sensitive to the relative phase between the LO and signal field for two signal sidebands, which corresponds to balanced homodyne detection. The maximum signal-to-noise ratio for two signal sidebands is four-fold (6 dB) larger than that for single signal sideband when the relative phase . When consider the factor 2 of two sideband signals compared with single sideband, we confirm that the signal-to-noise ratio with heterodyne detection is two-fold worse than that with homodyne detection. The signal-to-noise ratio for two signal sidebands reaches zero when the relative phase .
III Conclusion
In conclusion, we experimentally study optical balanced homodyne and heterodyne detections by the sideband method. The single sideband and two sideband signals can be obtained easily in our experimental setup, therefore optical balanced homodyne and heterodyne detections can be investigated and compared simultaneously. We also develop two methods to lock the relative phase between up and down sideband for realizing the balanced homodyne detection. We confirm that this balanced homodyne detection scheme is phase-sensitive and its signal-to-noise ratio is two-fold better than that with heterodyne detection. The scheme of generating single and two sideband signal in this work can be used in the quantum information and quantum metrology 21 ; 22 ; 23 . Resently, we noticed an interesting work where the heterodyne detection with a bichromatic local oscillator was theoretically and experimentally studied 24 .
†Corresponding author email: jzhang74@aliyun.com, jzhang74@sxu.edu.cn
Acknowledgements.
This research was supported in part by National Basic Research Program of China (Grant No. 2011CB921601), NSFC for Distinguished Young Scholars (Grant No. 10725416), NSFC Project for Excellent Research Team (Grant No. 60821004).References
- (1) T. Okoshi, and K. Kikuchi. Coherent optical fiber communications. KTK/Kluwer, Dordrecht/Tokyo (1988)
- (2) X. L. Su, Chin. Sci. Bull., 59, 1083 (2014)
- (3) S. Martellucci, A. N. Chester, and A. G. Mignani, Optical sensors and microsystems: new concepts, materials, technologies, Kluwer Academic Publishers (2002)
- (4) H. P. Yuen, and V. W. S. Chan, Opt. Lett., 8 177 (1983)
- (5) M. J. Collett, R. Loudon, and C. W. Gardiner, J. Mod. Opt, textbf34 881 1987
- (6) L. A Wu, H. J. Kimble, J. L. Hall, and H. Wu, Phys. Rev. Lett., 57 2520 (1986)
- (7) X. D. Yu, W. Li, Y. B. Jin, and J. Zhang, Sci. Chin. Phys. Mech. Astron., 57 875 (2014)
- (8) X. L. Su, X. J. Jia, C. D. Xie, and K. C. Peng, Sci. Chin. Phys. Mech. Astron., 57 1210 (2014)
- (9) G. Breitenbach, S. Schiller, and J. Mlynek, Nature, 387 471 (1997)
- (10) X. L. Su, X. J. Jia, C. D. Xie, and K. C. Peng, Sci. Chin. Phys. Mech. Astron., 51 1 (2008)
- (11) A. Furusawa, J. L. Srensen, S. L. Braunstein, C. A. Fuchs, H. J. Kimble, and E. S. Polzik, Science, 282 706 (1998)
- (12) F. Grosshans, G. V. Assche, J. Wenger, R. Brouri, N. J. Cerf, and P. Grangier, Nature, 421 238 (2003)
- (13) S. L. Braunstein, and P. V. Loock, Rev. Mod. Phys., 77 513 (2005)
- (14) D. Xie, and J. Y. Peng, Sci. Chin. Phys. Mech. Astron., 56 593 (2013); M. Dugi, M. Arsenijevi, and J. Jekni-Dugi, Sci. Chin. Phys. Mech. Astron., 56 732 (2013)
- (15) Y. Yamamoto, and H. A. Haus, Rev. Mod. Phys, 58 1001 1986
- (16) C. M. Caves, and P. D. Drummond, Rev. Mod. Phys.,66 481 (1994)
- (17) H. A. Bachor, A guide to experiments in quantum optics, Wiley/VCH, Weinheim, (1998)
- (18) J. Zhang, Phys. Rev. A, 67 054302 (2003)
- (19) K. Di, X. D. Yu, J. Zhang, Act. Sin. Quan. Opt., 16 241 (2010)
- (20) X. L. Su, S. H. Hao, X. Deng, L. Y. Ma, M. Wang, X. J. Jia, C. D. Xie, and K. C. Peng, Nature Commun., 4 2828 (2013)
- (21) T. A. Wheatley, D. W. Berry, H. Yonezawa, D. Nakane, H. Arao, D. T. Pope, T. C. Ralph, H. M. Wiseman, A. Furusawa, and E. H. Huntington, Phys. Rev. Lett., 104 093601 (2010)
- (22) H. Yonezawa, D. Nakane, T. A. Wheatley, K. Iwasawa, S. Takeda, H. Arao, K. Ohki, K. Tsumura, D. W. Berry, T. C. Ralph, H. M. Wiseman, E. H. Huntington, and A. Furusawa, Science, 337, 1514 (2012)
- (23) Z. H. Zhai, and J. R. Gao, Opt. Express, 20 18173 (2012)
- (24) H. Fan, D. He, and S. Feng, arXiv: 1410.8602 (2014)