The Effect of Final HERA inclusive Cross Section Data on MMHT2014 PDFs
Abstract:
We investigate the effect of including the HERA run I + II combined cross section data on the MMHT2014 PDFs. We present the fit quality within the context of the global fit and when only the HERA data are included. We examine the changes in both the central values and uncertainties in the PDFs. We find that the prediction for the data is good, and only relatively small improvements in and changes in the PDFs are obtained with a refit at both NLO and NNLO. PDF uncertainties are slightly reduced. There is a small dependence of the fit quality on the value of .
The MSTW2008 PDFs [2] were recently updated with a fit in the same general framework – the MMHT2014 PDFs [3]. These were an improvement due to a number of developments in theory or procedures. For example, we now use extended parameterisation with Chebyshev polynomials, and freedom in deuteron nuclear corrections introduced in [4], which led to a change in the distribution. We use the “optimal” GM-VFNS choice [5] which is smoother near to heavy flavour transition points, particularly at NLO. Correlated systematic uncertainties are now treated as multiplicative not additive. We have also changed the value of the charm branching ratio to muons used to [6]. There are also a wide variety of new data sets included in the fit. This includes LHC (ATLAS, CMS and LHCb) cross sections differential in rapidity, and Drell Yan at high and low mass, and also data on from the Tevatron and from ATLAS and CMS. At NLO we also include ATLAS and CMS inclusive jet data, though do not yet include these data at NNLO. Previous analyses have used threshold corrections for Tevatron data and we continue to include these data, but at the LHC we are often far from threshold. The full NNLO calculation [7, 8] is nearing completion.
There are also various changes in non-LHC data sets, e.g. we include some updated Tevatron asymmetry data sets. The single most important change in data included is the replacement of the HERA run I neutral and charged current data provided separately by H1 and ZEUS with the combined HERA data set [9] (we also include HERA combined data on [10]), which is the data set which provides the best single constraint on PDFs, particularly the gluon at all . However, we decided not to include any separate run II H1 and ZEUS data sets, since it was clear the run I II combination data would soon appear. This has now happened, and the data, and the accompanying PDF analysis, are in [11]. It was left as an open question in [3] when an update of MMHT2014 PDFs would be required. Significant new LHC data would be one potential reason, and the full NNLO calculation of the jet cross sections might be another. However, the potential impact of the final HERA inclusive cross section data was another factor, it being possible that these alone might produce a significant change in the central value of the PDFs and their uncertainties. Hence, it is now obviously a high priority to investigate their impact.

Using our standard cut of there are 1185 HERA data points with 162 correlated systematics and 7 procedural uncertainties. These are separated into 7 subsets, depending on whether it is or scattering from the proton, whether it is neutral or charged current scattering and on the proton beam energy . This is to be compared to 621 data points, separated into 5 subsets, with generally larger uncertainties, from the HERA I combined data used previously (though this has fewer correlated systematics). We first simply investigate the fit quality from the predictions using MMHT2014 PDFs.111Our numbers are very slightly different to those presented at EPS2015 due to the correction of a minor bug. This is already rather good:
per point.
per point.
In contrast HERAPDF2.0 PDFs, which are fit to (only) these data obtain per point with at both NLO and NNLO. Next we try refitting in the context of our standard global fit, i.e. we simply replace the previous HERA run I data with the new run I II combined data. The fit improves to
per point, with deterioration in other data.
per point, with deterioration in other data.
This is a significant, but hardly dramatic improvement (less than the improvement after refitting when HERA run I combined data were first introduced into the MSTW2008 fitting framework), i.e. the MMHT2014 PDFs were already giving quite close to the best fit within the global fit framework. In order to compare more directly with the HERAPDF2.0 study we also fit only HERA run I II data. This requires us to fix 4 of our PDF parameters in order to avoid particularly unusual PDFs, in practice a very peculiar, and potentially pathological strange distribution – HERA data not having any direct constraint on this. We allow the strange + antistrange distribution to have a free normalisation and high- power, but all other shape freedom is removed. The strange-antistrange asymmetry is fixed to the MMHT2014 default values. The result is
per point
per point
Hence, in this case, as well as the global fit, the NNLO fit quality is definitely better than NLO. Part of this is due to the charged current data which is 20 units better in HERA data only fits than the global fits and 10 units better at NNLO than at NLO. There appears to be some tension between these charged current data and other data in the global fit, though this is partially resolved at NNLO.
| no. points | NLO | NLO | NNLO | NNLO | |
|---|---|---|---|---|---|
| correlated penalty | 79.9 | 113.6 | 73.0 | 92.1 | |
| CC | 39 | 43.4 | 47.6 | 42.2 | 48.4 |
| CC | 42 | 52.6 | 70.3 | 47.0 | 59.3 |
| NC | 159 | 213.6 | 233.1 | 213.5 | 226.7 |
| NC | 377 | 435.2 | 470.0 | 422.8 | 450.1 |
| NC | 70 | 67.6 | 69.8 | 71.2 | 69.5 |
| NC | 254 | 228.7 | 233.6 | 229.1 | 231.8 |
| NC | 204 | 221.6 | 228.1 | 220.2 | 225.6 |
| total | 1145 | 1342.6 | 1466.1 | 1319.0 | 1403.5 |
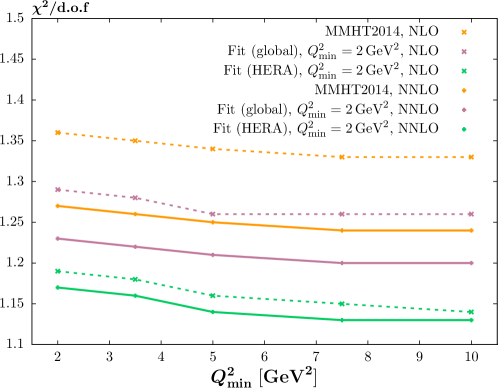
The HERAPDF2.0 analysis sees a distinct improvement in per point with a raising of the value for the data fit. Hence, we also investigate the variation of the fit quality with . However, first we simply calculate the quality of the comparison to data as a function of at NLO and at NNLO without refitting, i.e. the PDFs are obtained with the default cut. This is shown in Fig. 1 where we show a comparison of per point for the three variations of NLO and NNLO comparisons, i.e. MMHT2014 prediction, global refit with new HERA data and refit with only HERA run I II combined data. Here it is clear that NNLO is superior, but this is less distinct in the refits, particularly the fit to only HERA data. There is a reasonable lowering of the per point as increases.
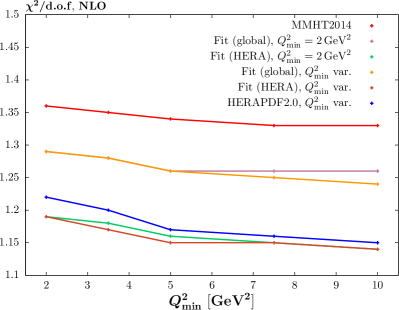
We also look at the effect of changing the cut in the fit (on only the HERA combined data), at both NLO and NNLO. This is shown in Fig. 2, where we also show the trend for the HERAPDF2.0 analysis [11].222The definition of for HERAPDF2.0 is not identical, though this should be a very small effect. For comparison we also include the curves for the per point with varying but with the fits performed for . In fact we note that while there is an improvement in per point with increasing , this is very largely achieved without any refitting. There is also less improvement in our analysis than for HERAPDF2.0, particularly in the global fit and at NNLO. In order to investigate the source of the improvement with increasing we looked in more detail at the fit quality for low bins. We found that there was quite a large degree of point-to-point fluctuation in theory/data at low rather than any obvious systematic issue (though the lowest point at each is often below theory, i.e. there is limited evidence of more of a turn-over in data than theory). In many cases it seems impossible to avoid some rather high points with any smooth curve. We present the detail of the breakdown of into each of the data subsets in Table 1. We do this for to allow direct comparison to the HERAPDF2.0 results, and also for possible comparison with e.g. NNPDF and CT results.
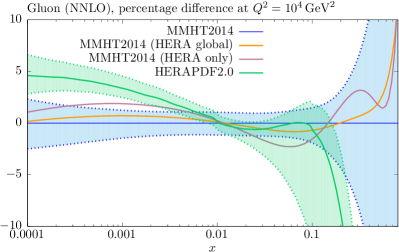
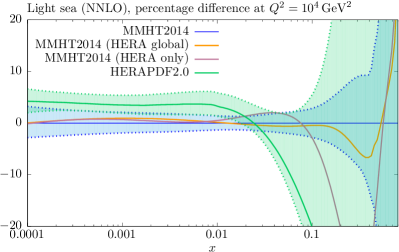
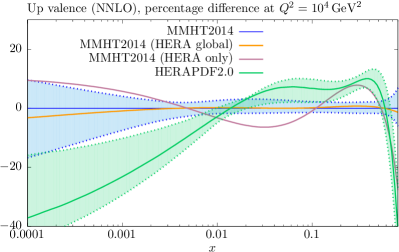
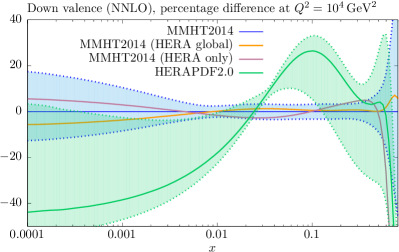
In Fig. 3 we show the central values of the NNLO PDFs from the fits including the new HERA combined data, comparing them to MMHT2014 PDFs (with uncertainties) and the HERAPDF2.0 PDFs (also with uncertainties). The modified PDFs are always very well within the MMHT2014 uncertainty bands. Indeed, the predictions for e.g. change by for the full range of LHC energies. The PDFs from the HERA run I II data only fit are in some ways similar to those of HERAPDF2.0, e.g. the up valence quark for , which show some significant deviations to the two global fits PDF sets. However, the features are not universal, with the gluon and the down valence being much more similar to MMHT2014 than HERAPDF2.0. This may be a feature of the differing parameterisations used in the two studies.
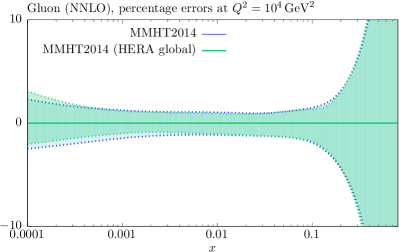
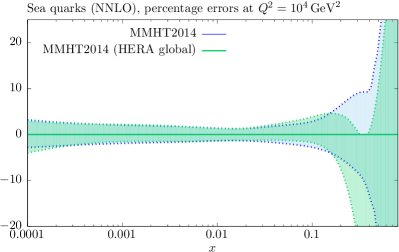
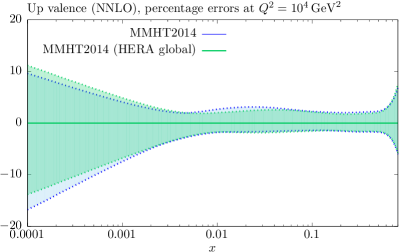
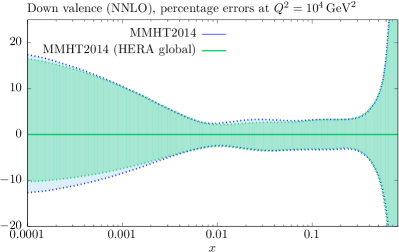
We also investigate the effect of the new data on the uncertainties of the PDFs. In Fig. 4 we compare the uncertainties for the NNLO PDFs including the HERA run I II data to the MMHT2014 PDFS. These are quite similar to MMHT2014 in most features. The most obvious improvement is to the gluon for . There is also slight improvement in some places for the valence quarks. We understand that NNPDF results on central values and uncertainties are similar [12]. Hence, the HERA run I II combined data gives us our single best constraint on PDFs, and determines the gluon at low even more accurately than before, but its inclusion does not suggest updates of existing PDFs are immediately necessary.
Acknowledgements
We would like to thank A.M Cooper-Sarkar, A. Geiser and V. Radescu for discussions on the HERA data and PDFs, and S. Forte and J. Rojo on NNPDF results. This work is supported partly by the London Centre for Terauniverse Studies (LCTS), using funding from the European Research Council via the Advanced Investigator Grant 267352. We thank the Science and Technology Facilities Council (STFC) for support via grant awards ST/J000515/1 and ST/L000377/1.
References
- [1]
- [2] A. D. Martin, W. J. Stirling, R. S. Thorne and G. Watt, Eur. Phys. J. C 63 (2009) 189 [arXiv:0901.0002 [hep-ph]].
- [3] L. A. Harland-Lang, A. D. Martin, P. Motylinski and R. S. Thorne, Eur. Phys. J. C 75 (2015) 5, 204 [arXiv:1412.3989 [hep-ph]].
- [4] A. D. Martin, A. J. T. .M. Mathijssen, W. J. Stirling, R. S. Thorne, B. J. A. Watt and G. Watt, Eur. Phys. J. C 73 (2013) 2318 [arXiv:1211.1215 [hep-ph]].
- [5] R. S. Thorne, Phys. Rev. D 86 (2012) 074017 [arXiv:1201.6180 [hep-ph]].
- [6] T. Bolton, hep-ex/9708014.
- [7] A. Gehrmann-De Ridder, T. Gehrmann, E. W. N. Glover and J. Pires, Phys. Rev. Lett. 110 (2013) 16, 162003 [arXiv:1301.7310 [hep-ph]].
- [8] J. Currie, A. Gehrmann-De Ridder, E. W. N. Glover and J. Pires, JHEP 1401 (2014) 110 [arXiv:1310.3993 [hep-ph]].
- [9] F. D. Aaron et al. [H1 and ZEUS Collaboration], JHEP 1001 (2010) 109 [arXiv:0911.0884 [hep-ex]].
- [10] H. Abramowicz et al. [H1 and ZEUS Collaborations], Eur. Phys. J. C 73 (2013) 2311 [arXiv:1211.1182 [hep-ex]].
- [11] H. Abramowicz et al. [H1 and ZEUS Collaborations], arXiv:1506.06042 [hep-ex].
- [12] S.Forte, J. Rojo, private communication.