The “shook up” galaxy NGC 3079: the complex interplay between H I, activity and environment
Abstract
We present deep neutral hydrogen (H i) observations of the starburst/Seyfert galaxy NGC 3079 and its environment, obtained with the Westerbork Synthesis Radio Telescope. Our observations reveal previously unknown components, both in H i emission and in absorption, that show that NGC 3079 is going through a hectic phase in its evolution. The H i disk appears much more extended than previously observed and is morphologically and kinematically lopsided on all scales with evidence for strong non-circular motions in the central regions. Our data reveal prominent gas streams encircling the entire galaxy suggesting strong interaction with its neighbours. A 33-kpc long H i bridge is detected between NGC 3079 and MCG 9-17-9, likely caused by ram-pressure stripping of MGC 9-17-9 by the halo of hot gas of NGC 3079. The cometary H i tail of the companion NGC 3073, earlier discovered by Irwin et al., extends about twice as long in our data, while a shorter, second tail is also found. This tail is likely caused by ram-pressure stripping by the strong, starburst driven wind coming from NGC 3079. We also detect, in absorption, a nuclear H i outflow extending to velocities well outside what expected for gravitational motion. This is likely an atomic counterpart of the well-studied outflow of ionised gas present in this galaxy. This may indicate that also large amounts of cold gas are blown out of NGC 3079 by the starburst/AGN. Our estimates of the jet energy and kinetic power suggest that both the AGN and the starburst in NGC 3079 are powerful enough to drive the atomic outflow.
keywords:
galaxies: halos—- galaxies: kinematics—- galaxies: individual (NGC 3079, NGC 3073, MCG 9-17-9)—- galaxies: active and starburst —- galaxies: jets and outflows1 Introduction
Deep observations of 21-cm atomic neutral hydrogen (H i) are known to provide a powerful tracer of the structure and evolution of galaxies. Given that in general the H i distribution is often more extended than the stellar body of a galaxy, it provides an excellent, and sometimes unique, diagnostic of the role of the environment and interactions in shaping galaxy properties. It also allows, through observations of outflows of cold gas, to study the interplay between the ISM and the energetic phenomena associated with active nuclei (e.g., Gallimore et al., 1999; Morganti et al., 2013) and star formation (e.g., van der Hulst et al., 2001; Boomsma et al., 2005; Walter et al., 2008; Koribalski et al., 2010; Heald et al., 2011; Wang et al., 2013).
Here we present a detailed study of the H i in NGC 3079 and in its environment. NGC 3079 is well-known for its intense starburst in the central regions and an associated outflow of ionised gas, while it also harbours a Seyfert nucleus. Although it has been the target of many detailed studies, we have obtained new H i data that are much more sensitive than those from previous observations with the aim to do a more detailed study of the role of the environment in the elevated activity in this galaxy and, vice versa, the effect of NGC 3079 on it companion galaxies.
NGC 3079 is a nearby spiral galaxy which has been studied extensively in different wavelengths and resolutions because it is known for its several unique properties. One of the most spectacular features of NGC 3079 is the ionised gas outflow (super-wind) forming a “super-bubble” at the eastern side of the galactic plane (Cecil et al., 2001). The outflow appears to originate from the nucleus and reaches velocities up to 1500 km s-1(Cecil et al., 2001). Chandra X-ray observations also show a clear correspondence between X-ray emission and the optical H filaments extending 1.3 kpc from the nucleus (Cecil et al., 2002). Large-scale outflows have also been observed in the radio continuum as two, kpc-scale, radio lobes extending on both sides of the major axis of the galaxy (de Bruyn, 1977; Duric & Seaquist, 1988; Baan & Irwin, 1995). NGC 3079 is classified as Seyfert 2 (Ford, 1986) or LINER (Low Ionization Narrow Emission Line Region, Heckman 1980).
The “super-bubble” can be caused by either an AGN (e.g., Irwin & Seaquist, 1988) or a nuclear starburst (e.g., Sofue et al., 2001). Indeed, various studies of the nucleus of the galaxy have provided evidence for the presence of both a weak AGN and a nuclear starburst. Several X-ray observations provide compelling evidence for the existence of an obscured AGN. For instance, the presence of an X-ray continuum excess in the keV band and a 6.4 keV Fe Kα line emission (Cecil et al., 2002), and the detection of both soft and hard X-ray emission showing a high hydrogen column density ( cm-2) towards the nucleus (Iyomoto et al., 2001). The presence of an AGN is also indirectly supported by Very Long Baseline Interferometry (VLBI) observations of Irwin & Seaquist (1988) at 5 GHz which revealed aligned multiple-components A, B and C (along P.A.) consistent with a pc-scale nuclear radio jet. This was later supported by several high resolution radio continuum observations (Baan & Irwin, 1995; Trotter et al., 1998; Sawada-Satoh et al., 2000; Hagiwara et al., 2004; Kondratko et al., 2005; Middelberg et al., 2007). These high resolution observations also revealed additional components (E and F) to the central VLBI source with varying spectral indices. Although the additional components have similar orientation and spacing as the components detected by Irwin & Seaquist (1988), they are not aligned with either the kpc-scale radio lobe or the proposed pc-scale jet (Kondratko et al., 2005; Middelberg et al., 2007). Kondratko et al. (2005) have also suggested that the jet may exist with a pc-scale wide angle outflow, which goes to show that the central source is far more complex than reported in Irwin & Seaquist (1988).
Strong FIR emission (Soifer et al., 1987), colour excess (Lawrence et al., 1985), and unusually high-density core of molecular gas relative to other starburst galaxies or AGN (7200 pc-2; Planesas et al. 1997; Sakamoto et al. 1999; Sofue et al. 2001; Koda et al. 2002) all point towards a nuclear starburst (but see also Hawarden et al. 1995, for counter-arguments).
Previous VLA H i observations of NGC 3079 by Irwin & Seaquist (1991) showed a smooth disk of H i with however some signs of perturbation, e.g. in the southern part. One of the main aims of our study is to investigate whether deeper H i observations would provide further evidence for such perturbations and whether these may be related to the activity observed in NGC 3079.
Baan & Irwin (1995) detected H i and hydroxyl (OH) multi-component absorptions towards the centre. The results from these observations suggest a combination of rotation and gas outflow to be present in the nuclear region (Baan & Irwin, 1995; Pedlar et al., 1996). The second aim of our work is, exploiting the high spectral stability of the Westerbork Synthesis Radio Telescope (WSRT), to see whether deeper observations would provide more information about this outflow of cold gas.
NGC 3079 is seen edge-on (; Heckman 1980) and is at a distance of 16 Mpc (i.e. 1 arcsec = 85 pc). NGC 3079 has two known nearby companion galaxies, NGC 3073 (dwarf S0) and MCG 9-17-9 (small Sb-Sc). The optical appearances of both companions do not show any disturbance. However in H i, NGC 3073 appears to be affected by the nuclear activity in NGC 3079 (Irwin et al., 1987). This is observed as an elongated H i tail coming from NGC 3073 pointing away from the nucleus of NGC 3079 in the data from Irwin et al. (1987). Interestingly, as Irwin et al. (1987) argue, this tail may be caused by ram-pressure stripping of H i from NGC 3073 by the starburst-driven superwind of NGC 3079. Our deeper H i data allow us to study this tail in more detail.
Our observations and the results are presented in Sections 2 and 3 followed by discussion in Sections 4, 5, and 6.
2 Observations and Data Reduction
NGC 3079 was observed with the Westerbork Synthesis Radio Telescope (WSRT). Five 12-hr observations were performed on 4, 5, 9, 12 and 28 Jan 2004. A bandwidth of 20 MHz with 1024 channels was used while the observations used Doppler tracking at a heliocentric velocity of 1135 km s-1. The parameters of the observations are summarised in Table 1.
The data were calibrated and reduced using the miriad package (Sault et al., 1995). Two standard calibrators, 3C 286, and 3C 48, were used to calibrate the flux scale and the spectral response (bandpass). Separate data sets were generated for line and for continuum. This was done by fitting a 4-th order polynomial to those channels of each visibility spectrum (’uvlin’) that do not contain line emission.
| Pointing centre (J2000) | 10h 01m 57.8s |
|---|---|
| Pointing centre (J2000) | +55∘ 40′ 47.0′′ |
| Date | 4, 5, 9, 12, 28 Jan 2004 |
| Integration time | hr |
| Doppler tracking velocity | 1135 km s-1 |
| Bandwidth | 20 MHz |
| Number of channels | 1024 |
| Velocity resolution | 16.5 km s-1 |
| Line cubes | |
| Synthesised beam () | rms noise |
| 0.13 mJy beam-1 | |
| 0.13 mJy beam-1 | |
| 0.17 mJy beam-1 | |
| 0.23 mJy beam-1 | |
| Continuum image | |
| Synthesised beam () | rms noise |
| 0.08 mJy beam-1 | |
| Peak flux | 310 mJy beam-1 |
To improve the dynamic range of the images, self-calibration was necessary to correctly determine the antenna gains as a function of time. This was done using the continuum data where iteratively the antenna gains and a model of the continuum sources was determined, until convergence was achieved. The calibration of the telescope obtained in this way was also copied from the continuum data to the line data. However, by only following this procedure, the quality of the images was still limited by the presence of strong off-axis sources that could not be calibrated well due to direction-dependent imaging errors. These off-axis errors are due to small pointing/tracking errors and frequency dependent, quasi-periodic variation in the primary beam due to standing waves in the dishes of the WSRT. Therefore, we have used the technique commonly known as “peeling” to correct for these off-axis errors in the image, following relatively standard steps (e.g. Oosterloo, 2011). The procedure involves, after subtraction of the central sources from the data, self-calibration on the remaining problematic off-axis sources (in this case including the well-known double quasar and first discovered gravitational lens Q 0957+561 A, B) to derive extra, direction-dependent corrections. The continuum image improved significantly after peeling as most image artefacts were removed while reaching an rms noise level of 0.08 mJy beam-1 which is 32% lower than prior to peeling.
For the line data, cubes were made using different image weightings and taperings. The data were binned a factor 2 in frequency after which additional Hanning smoothing was applied resulting in a final velocity resolution of km s-1. Parameters describing the data are listed in Table 1.
The cubes were cleaned using the Clark algorithm (Clark, 1980). In order to be able to clean to low flux levels, the cleaning was done using masks that were defined by smoothing the data to twice the spatial resolution and by identifying regions with line emission in these smoothed images. The spatial resolution of the final cubes ranges between about and (see Table 1). The noise levels, per channel, range between 0.13 and 0.23 mJy beam-1. We obtained a 5- detection limit for the column density, for a line width of 16.5 km s-1, of cm-2 for the lowest-resolution data cube and cm-2 for the highest-resolution data cube. The detection limit for small H i clouds is about (5 for a width of 16.5 km s-1). Total intensity H i maps were made by using masks based on a 2- cutoff of data cubes where the resolution was degraded by a factor 2.
3 Results
3.1 The H I morphology and kinematics
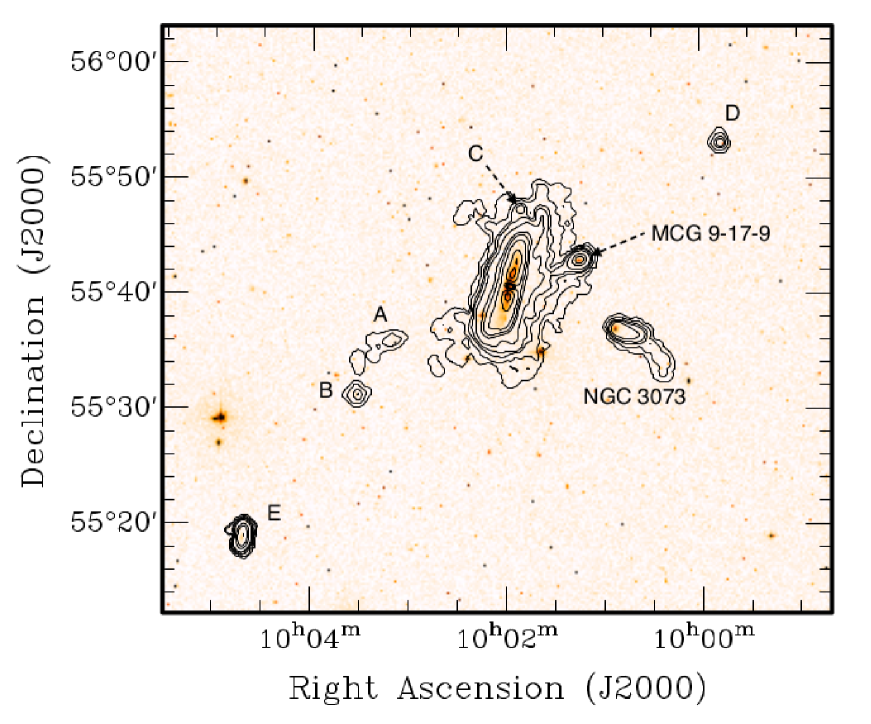
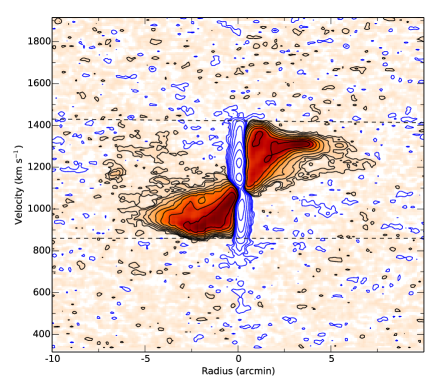
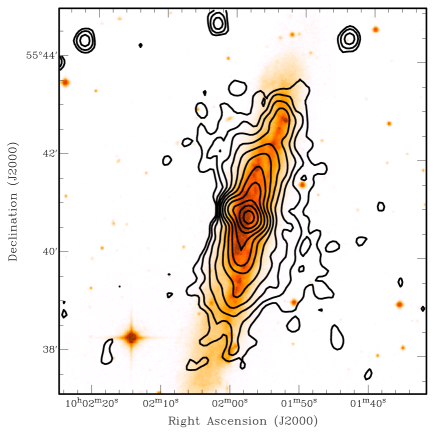
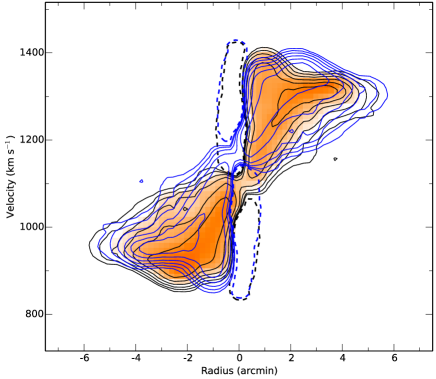
Figure 1 illustrates the total H i intensity map showing the distribution of the gas in and around NGC 3079. The H i column density contours are overlaid onto the Digitized Sky Survey (DSS2) optical image. Companions detected in H i are also marked. For a summary of the basic H i parameters see Table 2. Figure 2 shows the position-velocity (p-v) map taken along the major-axis of NGC 3079. The map shows a clear pattern of rotation, with the northern side approaching and south receding. Very striking is the very asymmetric kinematics at all scales. This is further discussed in Sec. 4.
| (J2000) | (J2000) | Name | Label | ||
|---|---|---|---|---|---|
| (h m s) | (∘ ′ ′′) | (NED) | ( km s-1) | ) | |
| 10 01 57.8 | +55 40 47 | NGC 3079 | 1116 | 96.3 | - |
| 10 00 48.2 | +55 36 56 | NGC 3073 | 1171 | 1.86 | - |
| 10 01 16.8 | +55 42 58 | MCG 9-17-19 | 1289 | 3.42 | - |
| 10 03 10.0 | +55 35 56 | J100311.18+553557.6n | 1050 | 0.09 | A |
| 10 03 32.5 | +55 31 19 | J100331.69+553121.1r | 1365 | 0.17 | B |
| 10 01 20.7 | +55 54 21 | [YGK81] 078 n | 1164 | 0.16 | C |
| 09 59 42.9 | +55 53 16 | J095940.91+555317.8n | 1246 | 0.14 | D |
| 10 04 43.8 | +55 19 46 | J100444.00+551943.2r | 1148 | 0.57 | E |
Note: Objects are labeled according to Fig. 1
-
n
SDSS galaxy with a maximum separation of but no redshift information available.
-
r
SDSS galaxy with a matching redshift.
The improved sensitivity of our observations has allowed to detect new, faint and kinematically distinct H i features compared to the previous observations. The H i total intensity map of NGC 3079 shows the H i disk to be far more extended and disturbed than previously observed (Irwin & Seaquist, 1991). The H i is seen out to a projected radius of 22 kpc. The integrated H i flux is Jy km s-1, implying a total H i mass of . The improved sensitivity of the new data highlights the more extended H i distribution resulting in 25% more H i detected compared to what reported by Irwin & Seaquist (1991). This difference is particularly due to the much larger extent of the galaxy west of NGC 3079 in the new data. Several new H i extensions and plumes of emission are also visible to the south-west and north-east. It is interesting to note that in the previous data the galaxy appeared more extended towards the east than to the west, while our deeper observations now show that the reverse is true and the H i is much more extended to the west, in the direction of MCG 9-17-9.
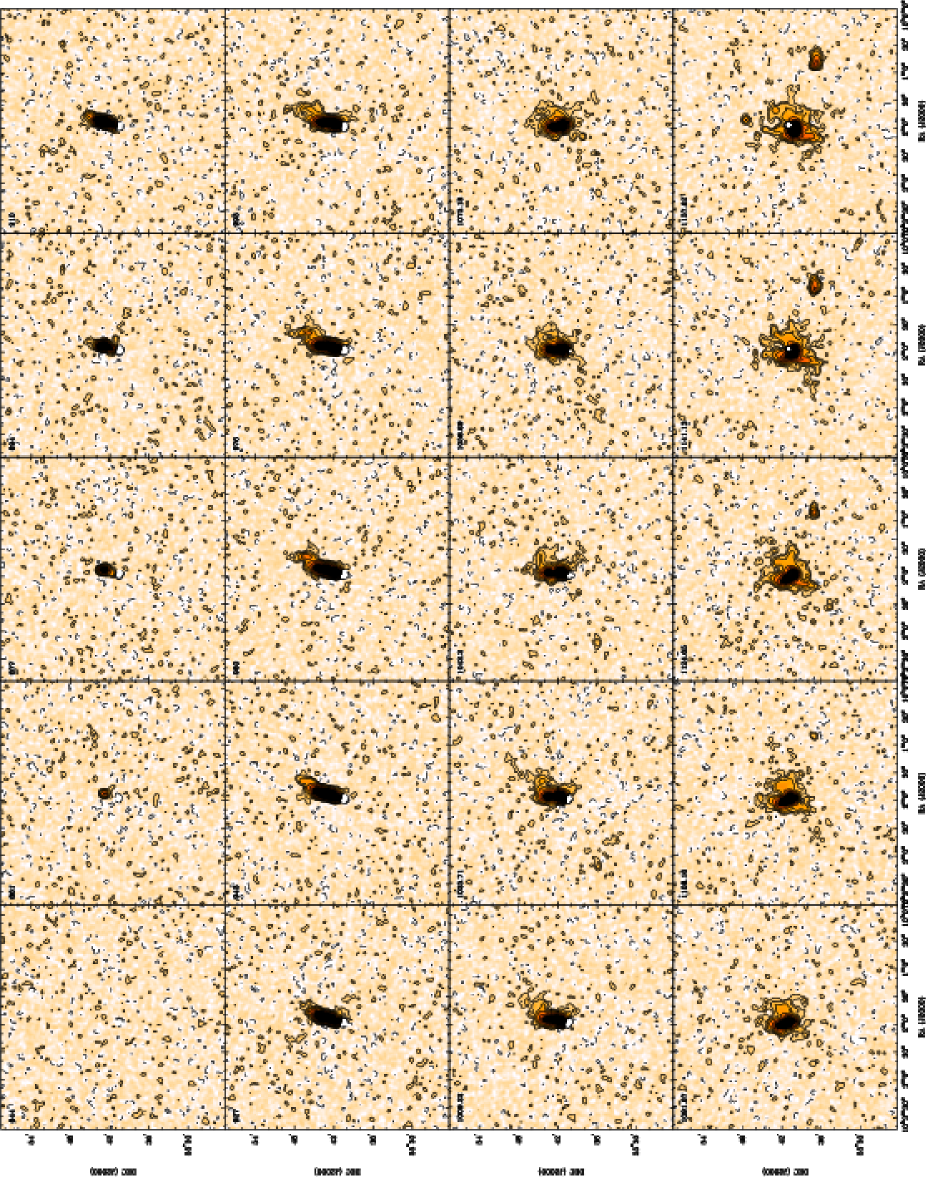
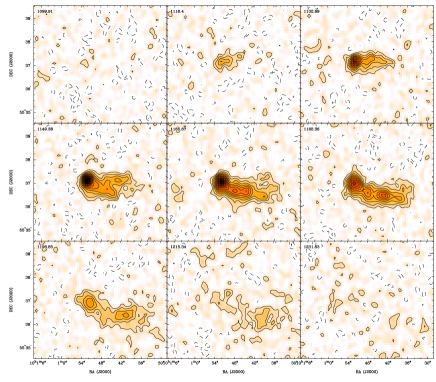
Figure 9 shows selected velocity channel maps (every second channel) containing H i emission detected in NGC 3079. Several key properties of the H i distribution and kinematics can be inferred from these images. The emission spans over a wide velocity range from 850 to km s-1, with a systemic velocity of 1116 km s-1. The channel maps show that most of the extended H i is located in the north-west part of the galaxy. Furthermore, the H i disk appears warped on both north and south sides. This can be seen at velocities, e.g., and km s-1. At lower levels () there is a sign of a trailing stream of gas visible at velocities near km s-1. This tail-like feature is likely produced by an interaction with the companions seen towards south-east of NGC 3079 (see Fig. 1). Other streams and counter-rotating H i are also visible velocities between and km s-1. From these channel maps it is apparent that NGC 3079 is disturbed and has a lopsided nature allover the disk.
There also seems to be an H i stream associated with the galaxy seen north of NGC 3079 (([YGK81] 078; labeled C in Fig. 1); visible for velocities and km s-1). Although the outer contours in the channel maps look disturbed, the extended gas still shares the disk kinematics (e.g., km s-1). The more likely source of the disturbance is an interaction between the two galaxies (see Fig. 1). Perhaps, the most interesting feature in our data is the new detection of large stream of gas encircling the galaxy (Figs. 1 and 9). This will be discussed in Sec. 3.4 in relation to the companion galaxies .
3.2 The H I absorption
As expected from previous studies (e.g., Baan & Irwin, 1995), H i absorption is detected against the nuclear continuum emission. The position-velocity diagram presented in Fig. 2 shows the absorption as blue contours. The deep part of the absorption profile exhibits a multiple-component structure with a mixture of broad and narrow components, consistent with what found by previous studies at higher resolution (Baan & Irwin, 1995; Pedlar et al., 1996; Sawada-Satoh et al., 2000). The strongest absorption extends in velocity from 850 km s-1 to 1440 km s-1. The peak optical depth is high, , even when assuming that the absorption is observed against the entire continuum source in the inner region (i.e. the covering factor ). This corresponds to a column density of cm -2 for a spin temperature of = 100 K.
Baan & Irwin (1995) have studied this absorption using high-resolution observations. Their detected H i absorption covers a similar velocity range and shows an even higher optical depth, suggesting that the covering factor for our data is not unity and that the absorbing screen is concentrated in the nuclear regions (i.e. not in front of the diffuse continuum emission which is included in the relatively large central beam of our observations). Baan & Irwin (1995) identified three distinct absorption components associated with the nuclear disk, the inner and the outer disk structures.

Although our observations cannot provide a comparable spatial resolution, the sensitivity and bandwidth of our data have allowed us to explore the presence of H i (in absorption) not part of a regularly rotating structure. In addition to the deep absorption covering the range of rotation velocities of the H i emission, we detect a faint, additional component that covers a velocity range between 450 km s-1 and 800 km s-1, well outside the velocity range of the regularly rotating disk. At the extreme velocities, it is blueshifted by 600 km s-1relative to the systemic velocity. To give a better view of this faint absorption component, a zoom-in of the H i profile at the location of the peak continuum (which has a flux density of 310 mJy beam-1) is shown in Fig. 3. Interestingly, evidence for a blueshifted H i component was also reported by Gallimore et al. (1994) based on their VLA observations. The kinematics of the gas producing this shallow component is not consistent with gas in a simple rotating disk, rather it indicates the presence of outflowing gas. Since both starburst winds and AGN are known to be able to drive outflows, the superwind or the sub-arcsec radio jet might power such this outflow in this galaxy. Both mechanisms are discussed in Sec. 6.
This broad and shallow component has a maximum depth of 0.35 mJy. Broad and shallow absorption components can be the result of errors in calibration caused by, for example, temporal instability of the bandpass of the telescope. In order to exclude this possibility, the stability of the bandpass was carefully verified by investigating whether similar broad features appear in the spectra of the calibrators when the bandpass derived from one calibrator observed before NGC 3079 was applied to a calibrator observation taken after the science observation. In this way we find that the level of instrumental variation of the bandpass is a factor ten below what would be needed to explain the faint absorption component, which implies that the broad absorption is not an instrumental effect.
We can estimate the parameters of the broad absorption. If we assume that this component is observed against the peak of the continuum, its optical depth is . Because there is a large uncertainty when using higher resolution data due to the variability of the core radio flux density reported in some observations (e.g., Sawada-Satoh et al., 2000; Kondratko et al., 2005; Middelberg et al., 2007), we only use this value of to derive a lower limit to the column density. The column density is estimated as cm -2. This gives us as lower limit of cm -2 (for = 100 K and covering factor ). It might well be that, if the absorbing gas is located close to the centre of NGC 3079, that the spin temperature of the gas is well above the 100 K assumed here and that these column densities have to be increased accordingly.
3.3 The radio continuum
Figure 4 shows the continuum image of NGC 3079 overlaid onto the optical DSS2 red image. The continuum structure of NGC 3079 has been well studied at various resolutions and frequencies (Duric & Seaquist, 1988; Baan & Irwin, 1995; Irwin & Saikia, 2003). At high spatial resolution, it shows two radio lobes (extending about 2 kpc from the nucleus) extending perpendicularly to the plane of the galaxy. These relatively large, extended radio lobes, likely connected to the nuclear outflow, are quite unusual for Seyfert galaxies. On larger scales, Irwin & Saikia (2003) found that the radio continuum follows the galaxy disk. This emission is surrounded by a radio halo (extending at least 4.8 kpc from the disk) together with other extension/loops particularly clear at low frequencies .
At the resolution of our observation (1 kpc), we see some indication for the nuclear lobes in the form of small extension perpendicular to the disk, although these cannot be well separated from the extended disk emission. The peak flux density in the centre of NGC 3079 is 310 mJy beam-1 (see Fig. 4).
The disk emission extends to radii similar to what observed by Irwin & Saikia (2003). One outcome from our radio continuum data is that the halo appears asymmetric, with the emission on the W side being more extended than on the E. On the E side, the extent is about 5 kpc while on the S-W side it reaches about 7 kpc.
This extension to the S-W side was also seen in the 1.2 GHz image from Irwin & Saikia (2003), while the remaining emission looks smoother (and larger) in our image. This is possibly the result of the improved quality of our image thanks to our direction dependent calibration. We do not see evidence for the radio loops seen at low frequencies by Irwin & Saikia (2003). The larger and asymmetric extent of the continuum halo on the W side partly mimics that of the the H i emission. No continuum emission is detected, down to the level of 0.24 mJy beam-1 (), from companion galaxies.
3.4 The NGC 3079 Group
The NGC 3079 group is known to contain a number of smaller galaxies. Our data revealed H i gas associated with seven galaxies that are close (spatially and in velocity) to NGC 3079, and thus are likely associated with the group (see Fig. 1 where the objects are labeled). Among these, four have previously known redshifts. All newly identified members of the group are small, gas-rich galaxies. The H i parameters of each galaxy are given in Table 2. A velocity dispersion of km s-1 is measured for the group. Four of the group members (MCG 9-17-9, NGC 3073, SDSS J100311.18+553557.6 (labeled A) and [YGK81] 078 (labeled C)) are seen interacting with NGC 3079. Below, we briefly discuss some details of these interactions.
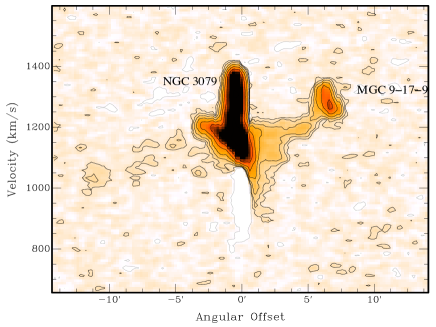
3.4.1 MCG 9-17-9
MCG 9-17-9 is a small spiral galaxy located about 6.5 arcmin (33 kpc) north-west of NGC 3079 (see Fig. 1). It is classified as Sb-Sc, and seen fairly face on. Very little is known about this galaxy other than from observation of the NGC 3079 environment (e.g., Irwin et al., 1987; Pietsch et al., 1998). Bright X-ray emission ( erg s-1) has been detected by Pietsch et al. (1998) which was considered rather high for such a small spiral galaxy. The H i appeared undisturbed in the interaction of the group in Irwin et al. (1987). The new H i data, however, reveal that an interaction between MCG 9-17-9 and NGC 3079 is ongoing. This is evident by the H i ‘bridge’ detected between the two galaxies that overlaps both spatially (in projection) and in velocity space, suggesting a physical link between the two galaxies. This can be seen clearly in Fig. 5 where the p-v slice along the bridge is shown. The south end of the bridge joins the north-west part of the H i disk of NGC 3079 which also seems disturbed in that region. The other extreme of the bridge connects to MCG 9-17-9. Interestingly, no perturbations are seen even in very deep optical images (P.-A. Duc, priv. comm.), suggesting the bridge is not tidal in nature. We discuss this in more detail below.
The H i bridge appears to extend to the other side of NGC 3079, towards the other small galaxies SDSS J100311.18+553557.6, and SDSS J100331.69+553121.1 (marked A and B respectively in Fig. 1). While it is possible that this means that the bridge extends this far, it is also possible that this H i forms another tail, emanating from SDSS J100311.18+553557.6 because this galaxy seems to have an H i tail pointing towards NGC 3079. Overall, the large streams of gas encircling NGC 3079 resemble some of the H i streams found in group galaxies, such as Magellanic Stream (e.g., Wannier et al., 1972).
3.4.2 NGC 3073
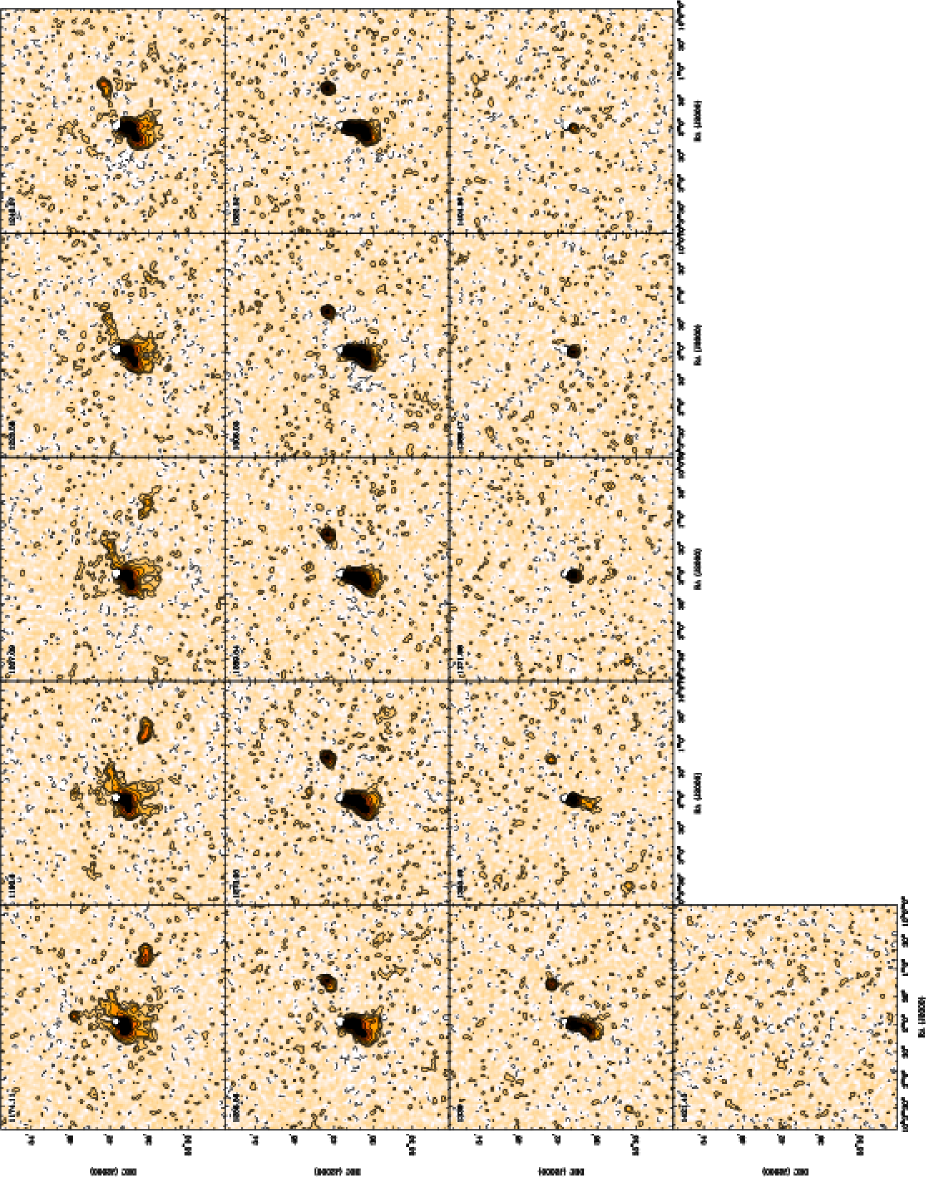
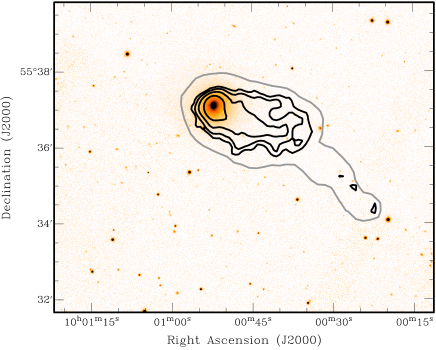
NGC 3073 is a dwarf SAB0 galaxy located about 10 arcmin ( 50 kpc) to the west of NGC 3079. The optical spectrum of NGC 3073 shows a young stellar population and high levels of star formation for its kind (Ho et al., 2009; McDermid et al., 2015). Irwin et al. (1987) revealed an elongated H i tail in this galaxy pointing away from NGC 3079, but aligned with the nucleus of NGC 3079. The total H i map of this galaxy from our data is shown in Fig. 7. The H i tail is clearly visible and turns out to be even longer than in Irwin et al. (1987). However, the tail also seems to consist of two streams. This can be seen in the channel maps shown in Fig. 6 (from 1132 to 1198 km s-1) and in Fig. 7. The significant curvature of the tail is also visible in Fig. 7. The tail extends to a projected length of about 5 arcmin (25.5 kpc) and it bends at the end giving a “cometary” appearance to the galaxy.
Although we discuss the H i tail of NGC 3073 in more detail below (Sec. 5.2), the presence of the secondary branch may indicate that ram pressure stripping is the cause of the tail. The two-tailed structure of the H i tail of NGC 3073 shows a fair degree of similarity with that of NGC 4330 (Chung et al., 2007) for which it is well established that it is caused by ram pressure stripping by the hot medium of the Virgo cluster.
4 The structure of the H I disk
Our deep H i observations of NGC 3079 and its group reveal several new features, in and around the galaxy, that are clear signatures of the complex and hectic history of this object. The presence of a number of tails and streams, as well as the warped and lopsided structure and kinematics of NGC 3079, point to the strong effects of interactions with the environment. Although the kinematics of the H i disk of NGC 3079 is dominated by regular rotation, it appears to have gone through a major “shake up” evidenced by its lopsidedness and warped structure. Apart from the morphological lopsidedness, in particular visible in the outer regions, Fig. 2 shows that NGC 3079 also has a strong kinematical lopsidedness in the bright disk. This is emphasised in Fig. 8 where the kinematics of the two sides of NGC 3079 are compared. It is clear that the kinematics of the disk is very asymmetric at all radii. The lopsidedness is seen over a large range in radius, but is particularly strong in the central regions. This non-standard kinematics, with associated non-circular motions, may well be related to the elevated activity in the central regions (elevated star formation and AGN).
The distribution of the H i is asymmetric in the north-south as well as in the east-west directions, i.e. more extended towards the north and west compared to south and east sides of the disk. This gives the galaxy a lopsided appearance. As can be seen in Figs. 1 and 8, the morphological lopsidedness of the disk appears to begin near the edge of the optical disk where the H i surface density starts declining, and slowly increases at larger radii. In particular in the direction of MCG 9-17-9 the disk has a large extension.
Figure 2 shows the position-velocity (p-v) diagram taken along the major axis. The disk shows a clear pattern of rotation, with the northern side approaching and south receding. Apart from this overall pattern of rotation, several streams of gas can be seen in this figure. In particular in the northern (approaching) side of the galaxy, gas is found over a wide range of velocities outside the range of the rotating disk. Similarly, on the receding side gas is found at anomalous velocities. This likely corresponds to a stream of gas at large radii.
Lopsidedness in the mass and gas distributions is a well known phenomenon and affects a significant fraction of galaxies (e.g., Richter & Sancisi, 1994; Haynes et al., 1998; Sancisi et al., 2008) and is generally interpreted as a sign of interaction and/or accretion. Similarly, warping is also common among disk galaxies and is known to affect many galaxies where the gas disk extends well beyond the stellar distribution (García-Ruiz, Sancisi, & Kuijken, 2002; Józsa et al., 2009). The warp in the outer disk (north and south) appears fairly mild but detailed modelling will be needed to determine the relative importance of the warp.
Considering the complicated structure of the gas in and around the galaxy, the striking bridge between NGC 3079 and MCG 9-17-9, as well as the other gas streams in the direction of the newly discovered companions ([YGK81] 078 and SDSS J100311.18+553557.6), it is likely that the lopsidedness and the warp are induced by interactions with companion galaxies via tidal encounters.
5 The interplay between NGC 3079 and its rich environment
In this section, we discuss in some more detail the H i tails connected to the companions galaxies MCG 9-17-9 and to NGC 3073.
5.1 MCG 9-17-9: Tidally or Ram-Pressure Stripped?
The interaction between MCG 9-17-9 and NGC 3079 is traced by an H i bridge as illustrated by Fig. 5. The total H i image of MCG 9-17-9 shows that the H i bridge forms near this galaxy at a column density of about cm-2 and a radius of about 3.3 kpc. However, Fig. 5 also shows that the bridge connects to the distorted outer disk of NGC 3079, suggesting that some part of the gas of the entire complex originates from the disk of NGC 3079. The two galaxies have a relative velocity of 173 km s-1 with MCG 9-17-9 being red-shifted with respect to NGC 3079. A velocity change of 100 km s-1 is seen along the bridge. From the size of the bridge and the relative velocities, one finds a kinematical timescale () of yr, giving an indication of the age of the bridge. This timescale is not very different from the age of the starburst in NGC 3079 estimated by Veilleux et al. (1994) (i.e. -yr), suggesting that the interaction between MCG 9-17-9 and NGC 3079 may have played a role in triggering the starburst. Here, we discuss the possible origin of the H i bridge.
5.1.1 The case for tidal stripping
H i bridges or streams between galaxies are often associated with tidal encounters. The fact that the outer disk of NGC 3079 seems to be affected by the passage of MCG 9-17-9 does indicate that tidal effect, at some level, play a role. However, very deep optical images (P.-A. Duc, priv. comm.) do not show any indication for a tidal distortion of the stellar distribution of MGC 9-17-9. This makes tidal effects unlikely to be the main cause of the H i bridge. Moreover, a tidal encounter often leads to two arms, one leading and one trailing, while here we observe only one arm. That tidal effects are not the dominant origin of the H i bridge is reinforced from an estimate of the tidal radius of MGC 9-17-9. The radius beyond which matter is tidally stripped due to an interaction between two galaxies can be estimated using
| (1) |
where is the mass of the satellite, the mass of the main galaxy and the projected separation between the two (Binney & Tremaine 1987). The un-equality is due to the fact that the projected separation gives a lower limit to the true separation.
The ratio of the masses of the two galaxies we estimate from their rotation velocities and their relative sizes. For the rotation velocity at the edge of the regular H i disk of NGC 3079 (5 arcmin = 23.3 kpc radius) we find 200 km s-1 (see Fig. 2) while for MCG 9-17-9 we find 40 km s-1 at a radius of 0.7 arcmin = 3.3 kpc. This gives a mass ratio of 166. The projected separation between the two galaxies is 33 kpc.
Using these values in Eq. 1 gives a tidal radius of kpc, larger than the radius of the regular, unaffected disk of MCG 9-17-9. However, this estimate is not very much larger than the size of the disk of MCG 9-17-9 and it might well be that, e.g. during those phases of the encounter between where the satellite may have been closer to NGC 3079, tidal effects have played some role. The distortion of the outer disk of NGC 3079 also points to this. However, given that the bridge connects to MCG 9-17-9, the formation of the bridge seems to be still ongoing and, given the estimated tidal radius, it is unlikely that tidal effects are the main reason for the H i stream near MCG 9-17-9.
5.1.2 The case for ram pressure
Another scenario is that the H i bridge is caused by ram pressure stripping of H i from MCG 9-17-9 by the halo of hot gas NGC 3079 is known to posses (Strickland et al., 2004).
The gas in a galactic disk is stripped if the the ram pressure of the hot halo gas is greater than the restoring gravitational force per unit area of the galaxy’s disk (Gunn & Gott, 1972). The density of the hot gas, , required for stripping gas at a disk radius can be estimated, assuming a gas disk sitting in a uniform spherical stellar/dark matter system, from
| (2) |
where is surface mass density of the gas disk, the rotational velocity, the velocity of the galaxy through the hot halo, and the radius of the disk under consideration (Gunn & Gott, 1972).
From the total H i image, we see that the disk of MCG 9-17-9 appears disturbed for column densities below cm-2 at a radius of 3.3 kpc. For the rotation velocity we use, as before, 40 km s-1, while for the velocity of the galaxy w.r.t. the hot medium we assume 200 km s-1, somewhat larger than the observed velocity difference between NGC 3079 and MCG 9-17-9. This gives us an estimate for the density of the hot gas required for ram pressure stripping to occur at the column density level and radius observed of cm-3.
This value should be compared with estimates of the density of the hot halo of NGC 3079. An extensive X-ray halo, with a luminosity of erg s-1 and a temperature of K, has been detected around NGC 3079 (ROSAT; Pietsch et al. 1998, Chandra; Cecil et al. 2002; Strickland et al. 2004). From the parameters derived for an exponential distribution of the hot gas (well-fit) by Strickland et al. (2004), we get, for the location of MCG 9-17-9, an observed density of cm-3, where is a volume filling factor. A very similar density was derived by Pietsch et al. (1998) for the hot halo of NGC 3079 assuming a simple spherical distribution. These densities are quite close to that required for ram pressure to occurring at the column density and radius we observe the H i disk of MCG 9-17-9 to be affected.
From the above analysis of both tidal and ram-pressure stripping, we conclude that the stripping that is currently occurring for MCG 9-17-9 is mainly due to the interaction with the halo of hot gas known to surround NGC 3079. The observed densities of the halo match quite well the estimated required densities for the stripping to occur at the observed column densities and radius. The estimated tidal radius is larger than the size of the disk of MCG 9-17-9. However, the difference is not very large and it is conceivable that, during an earlier phase of the encounter where possibly MCG 9-17-9 was closer to NGC 3079, tidal effects may have been important. The distorted outer H i disk of NGC 3079 also suggest that this is the case.
5.2 The two tails of NGC 3073
The ‘cometary’ appearance of the H i in NGC 3073 was first observed and discussed by Irwin et al. (1987). Our deeper data reveal that the H i tail of NGC 3073 is not only more extended, but also that it appears to be composed of two tails superimposed (Fig. 7).
Irwin et al. discuss the interesting possibility that this tail of NGC 3073 is due to ram-pressure stripping by the fast star-formation driven wind coming from the central regions of NGC 3079. This possibility was also discussed by Strickland et al. (2004). Before we discuss this option in more detail, we first consider the alternatives of tidal effects and ram-pressure stripping by the hot halo of NGC 3079.
The first option can likely be excluded. In the previous section we showed that tidal effects are currently not very strong for MCG 9-17-9 and there are a number of reasons why for NGC 3073 this is even more the case. In the first place because the distance between NGC 3079 and NGC 3073 is likely to be larger, given the larger projected separation of 50 kpc. Moreover, NGC 3073 is more massive than MCG 9-17-9, reducing the tidal impact of NGC 3079. Using the results from Cappellari et al. (2013), we estimate the rotation velocity of NGC 3073 to be 86 km s-1, compared to 40 km s-1 for MCG 9-17-9. Taking this together, we find that the tidal radius for NGC 3073 is likely to be larger than about 17 kpc, which is much larger than the size of the galaxy (1.2 kpc radius), ruling out a tidal origin for the H i tail.
Similarly, we can also rule out that the general halo of hot gas is stripping the H i from NGC 3073. In an similar way as done for MCG 9-17-9, we estimate that the required density of the hot halo in order to be able to strip the gas from NGC 3073 is cm-2 which is much larger than the observed densities.
However, as Irwin et al. (1987) remark, it is possible that the ram pressure from the wind coming from NGC 3079 is stripping NGC 3073. This is mainly, since ram pressure depends on velocity as , because of the high velocity of the wind (1000 km s-1 Cecil et al. 2001). For this velocity, the required density to strip the H i at the column density observed ( cm-2), is about cm-3. The lower limit for the electron density of the super-wind, near the starburst in the centre of NGC 3079, is estimated to be cm-3 (Strickland et al. 2004). Assuming that the density of the wind declines with distance from the starburst according to , we obtain a density of about at the location of NGC 3073. Given the uncertainties, this matches the required density for stripping and we reiterate the suggestion made by Irwin et al. (1987) that the cometary H i tail of NGC 3073 is due to ram-pressure stripping by the fast, starburst driven wind from the centre of NGC 3079.
6 The interplay between the central activity and the H I disk
The finding of the H i outflow seen in absorption can be added to the many interesting features of the nuclear region of NGC 3079. The broad and shallow blueshifted H i absorption component is blueshifted up to 600 km s-1 with respect to the systemic velocity. Being detected in absorption, this ensures that the gas is in front of the radio continuum and the blueshifted velocities indicate that the absorbing gas is outflowing. Such a broad, blueshifted component has been tentatively seen also in the VLA observations of Gallimore et al. (1994). A component with such large velocities must be associated to extreme, non-gravitational radial motions.
Fast H i outflows have been detected in several other radio sources with a range of AGN power. Many cases detected so far have been found to be associated to powerful radio jets (e.g., Morganti et al. 2005, 2013), although cases associated to low-power radio sources (e.g., NGC 1266; Nyland et al. 2013, Mrk 231; Morganti 2011) are also known. In a number of these objects, the most likely origin for the outflow is considered to be the kinetic push by the radio plasma jet following its interaction with a dense ISM (e.g. Morganti et al., 2013). This has also been suggested to occur in lower-power radio sources such as NGC 1266 (Nyland et al., 2013), a source with a radio power more similar to that of NGC 3079.
In the case of NGC 3079, it is hard to identify the origin of the outflow. This is due to the difficulty to disentangle the effects due to the starburst from those caused by the AGN, as it has been discussed in detail for the outflow of ionised gas by Veilleux et al. (1994) and Cecil et al. (2002). According to these studies, the starburst component is the most likely driver, although an AGN component cannot be excluded. Indeed, while the high infrared luminosity and the morphology of the well-known bubble observed in NGC 3079 suggest the stellar wind to be important(Veilleux et al., 1994), it has been suggested that the energy output of the AGN and starburst activities are comparable (Iyomoto et al., 2001).
The possibility of the existence of a molecular outflow driven by the active nucleus was already suggested by Hawarden et al. (1995). Molecular outflows have now been observed in a number of objects. The multi-phase character of gas outflows, and the co-presence of molecular and atomic hydrogen (as well as ionized gas), has been established in a growing number of cases where the outflows are driven by AGN. Thus, the H i outflow detected in our observations may represent the counterpart of the outflowing molecular gas (e.g. as in the case of the radio-loud Seyfert 2 IC 5063, Morganti et al. 2015; Tadhunter et al. 2014).
The limited spatial resolution of our observations cannot add information about the precise location of the outflow. However, in order to shed light on its origin, we can at least derive the energetics of the outflow and compare this with what is associated with the starburst and the non-thermal radio emission. This should tell us whether any of them can be ruled out because of insufficient energy.
From the lower and upper limit of the column density as described in Sec. 3.2, a range of values for the mass outflow rate can be obtained following Heckman (2002) and Rupke et al. (2002):
| (3) |
where the gas is outflowing at a velocity from radius over a solid angle . If we assume the outflow originates from the nuclear region, pc, to be steradians and km s-1, the above equation yields a lower limit to the mass outflow rate of ranging from 0.05 to 0.5 yr-1 where we have allowed to range between 100 K and 1000 K. These mass outflow rates are low compared those derived for ULIRGs (ranging between 10 to 1000 yr-1, (Heckman, 2002; Rupke et al., 2002; Rupke et al., 2005a, b) and for radio galaxies, ranging between 1 and 50 yr-1 (e.g. Morganti et al., 2005).
Veilleux et al. (1994) derived an upper limit for the ionised gas outflow in NGC 3079 of yr-1 (for cm-3). Thus, the ionised gas outflow rate in NGC 3079 is relatively modest compared to ULIRGs, but of similar amplitude as the H i outflow rates.
With the H i mass outflow rates, we can derive the kinetic power of the outflow using the approach of Holt et al. (2006), including both the radial and turbulent component of the gas motion.
| (4) |
The estimated values range between a few and erg s-1, again reflecting the range of column densities.
The energy associated with the nuclear starburst as derived by Veilleux et al. (1994) is estimated to be erg s-1. Veilleux et al. (1994) quote that for values of cm-3, the injection rate of the nuclear starburst would have been able to produce the H i outflow (i.e. providing a power of erg s-1).
Recent results (e.g. Nyland et al. 2013) have shown that fast H i (and molecular gas) outflows can also be driven by low-power radio sources due to the high efficiency of the coupling between the radio plasma with the surrounding ISM/IGM e.g. Cavagnolo et al. (2010). Thus, it is worth exploring the energetics connected to the radio plasma also for NGC 3079. Indeed, the presence of an interaction of the parsec-scale jet with ambient gas in NGC 3079 has been shown by Cecil et al. (2001) and Middelberg et al. (2007).
A number of studies have recently addressed the crucial issue of the conversion between radio luminosities and jet power. We use the relations proposed by Willott et al. (1999), Wu (2009), Bîrzan et al. (2008) and Cavagnolo et al. (2010). Despite the different approaches used by these authors in deriving these relations, we obtain a reasonable agreement from these different methods, indicating a jet power of erg s-1. Thus, also the jet power appears to be large enough to drive the H i outflow. This is further supported by the presence of jet-cloud interactions in the galaxy, as suggested by Cecil et al. (2001) and Middelberg et al. (2007).
However, a caveat to the radio plasma driving the outflow is whether the putative VLBI jet is really connected to the radio lobes. Interestingly, the position angle of the VLBI scale radio jet is close to the plane of the galaxy (Irwin & Seaquist, 1988), and misaligned by about with respect to the large-scale lobes. In this situation, one could hypothesise that this is due to a deflection partly caused by the interaction with the medium: this would be supported by the presence of broad blue-shifted H i absorption. A similar (albeit not so extreme) misalignment was found in at least an other spiral galaxy - IC 5063 - where the jet is seen in the plane of the galaxy. Interestingly, IC 5063 also hosts massive outflows of ionised, H i and molecular gas (Morganti et al. 2007, 2015; Tadhunter et al. 2014).
Thus, our considerations show that it is plausible for the radio jet to have a role in driving the H i outflow. However, the connection between the complex radio continuum structure in the inner pc region (Trotter et al., 1998; Sawada-Satoh et al., 2000; Hagiwara et al., 2004; Kondratko et al., 2005; Middelberg et al., 2007) and the large-scale disk, and also the connection between the pc (Kondratko et al., 2005) and kpc-scale outflows in this galaxy still remains ambigiuous.
7 Conclusions
We have presented deep H i observations of the famous starburst/Seyfert galaxy NGC 3079 and its surroundings. The improved sensitivity of the data compared to those in the literature have allowed to uncover new and interesting features which give an improved picture of the hectic evolution of NGC 3079 and its environment:
-
1.
NGC 3079 has a more extended (out to 22 kpc radius) and disturbed H i disk than previously observed. The H i disk is lopsided on all scales, both morphologically and kinematically, and shows a mild warp on both the north and south sides. The strong kinematical lopsidedness in the central regions, and the non-circular motions associated with that, are possibly connected to the high levels of star formation in the central regions.
-
2.
NGC 3079 is clearly interacting with its neighbours. Large streams of gas and tails are visible in the NGC 3079 group. The disk of NGC 3079 is strongly affected by these interactions.
-
3.
In addition to the two previously known companion galaxies (NGC 3073 and MCG 9-17-9), H i gas has been detected from five more galaxies (three with previously unknown redshift) which are likely associated with the NGC 3079 group. Among these, two of them ([YGK81] 078 and SDSS J100311.18+553557.6) seem to be taking part in the interactions in the group.
-
4.
A long H i bridge is visible between NGC 3079 and MCG 9-17-9 spanning over a projected length of 33 kpc. We suggest that ram pressure due to the hot X-ray halo of NGC 3079 is most likely responsible for the stripping of gas from MCG 9-17-9, although also tidal effects may have been relevant in the past.
- 5.
-
6.
An H i counterpart to the ionised gas outflow of NGC 3079 has been detected in the form of a blueshifted wing of the H i absorption profile against the central continuum source, extending to velocities well outside the range of rotational velocities. However, we cannot distinguish between the starburst and AGN driving this outflow, with both having comparable power sufficient to drive the outflow.
8 Acknowledgements
The WSRT is operated by ASTRON, the Netherlands Institute for Radio Astronomy, with the support from the Netherlands Foundation for Scientific Research (NWO). N.S. acknowledges support by the Square Kilometre Array (SKA) and the Hartebeesthoek Radio Astronomy Observatory (HartRAO). S.C. acknowledges support by the South African Research Chairs Initiative of the Department of Science and Technology and National Research Foundation and SKA. R.M. gratefully acknowledge support from the European Research Council under the European Union’s Seventh Framework Programme (FP/2007-2013)/ERC Advanced Grant RADIOLIFE-320745.
References
- Baan & Irwin (1995) Baan W. A., Irwin J. A., 1995, ApJ, 446, 602
- Binney & Tremaine (1987) Binney J., Tremaine S., 1987, Galactic Dynamics
- Bîrzan et al. (2008) Bîrzan et al. 2008, ApJ, 686, 859;
- Boomsma et al. (2005) Boomsma R., Oosterloo T. A., Fraternali F., van der Hulst J. M., Sancisi R., 2005, A&A, 431, 65
- Cappellari et al. (2013) Cappellari M., et al., 2013, MNRAS, 432, 1709
- Cavagnolo et al. (2010) Cavagnolo et al. 2010, ApJ, 720, 1066
- Cecil et al. (2002) Cecil G., Bland-Hawthorn J., Veilleux S., 2002, ApJ, 576, 745
- Cecil et al. (2001) Cecil G., Bland-Hawthorn J., Veilleux S., Filippenko A. V., 2001, ApJ, 555, 338
- Chung et al. (2007) Chung, A., van Gorkom, J. H., Kenney, J. D. P., & Vollmer, B. 2007, ApJ, 659, L115
- Clark (1980) Clark, B. G. 1980, A&A, 89, 377
- de Bruyn (1977) de Bruyn A. G., 1977, A&A, 58, 221
- Duric & Seaquist (1988) Duric N., Seaquist E. R., 1988, ApJ, 326, 574
- Duric et al. (1983) Duric N., Seaquist E. R., Crane P. C., Bignell R. C., Davis L. E., 1983, ApJ, 273, L11
- Ford (1986) Ford H., 1986, Journal of the British Astronomical Association, 96, 349
- Gallimore et al. (1994) Gallimore J. F., Baum S. A., O’Dea C. P., Brinks E., Pedlar A., 1994, ApJ, 422, L13
- Gallimore et al. (1999) Gallimore, J. F., Baum, S. A., O’Dea, C. P., Pedlar, A., & Brinks, E. 1999, ApJ, 524, 684
- García-Ruiz, Sancisi, & Kuijken (2002) García-Ruiz I., Sancisi R., Kuijken K., 2002, A&A, 394, 769
- Gunn & Gott (1972) Gunn J. E., Gott III J. R., 1972, ApJ, 176, 1
- Hagiwara et al. (2004) Hagiwara, Y., Klöckner, H.-R., & Baan, W. 2004, MNRAS, 353, 1055
- Haynes et al. (1998) Haynes, M. P., van Zee, L., Hogg, D. E., Roberts, M. S., & Maddalena, R. J. 1998, AJ, 115, 62
- Hawarden et al. (1995) Hawarden T. G., Israel F. P., Geballe T. R., Wade R., 1995, MNRAS, 276, 1197
- Heald et al. (2011) Heald G., et al., 2011, A&A, 526, AA118
- Heckman (1980) Heckman T. M., 1980, A&A, 87, 152
- Heckman (2002) —, 2002, in Astronomical Society of the Pacific Conference Series, Vol. 254, Extragalactic Gas at Low Redshift, Mulchaey J. S., Stocke J. T., eds., p. 292
- Ho et al. (2009) Ho, L. C., Greene, J. E., Filippenko, A. V., & Sargent, W. L. W. 2009, ApJS, 183, 1
- Holt et al. (2006) Holt J., Tadhunter C., Morganti R., Bellamy M., González Delgado R. M., Tzioumis A., Inskip K. J., 2006, MNRAS, 370, 1633
- Irwin & Saikia (2003) Irwin J. A., Saikia D. J., 2003, MNRAS, 346, 977
- Irwin & Seaquist (1988) Irwin J. A., Seaquist E. R., 1988, MNRAS, 335, 658
- Irwin & Seaquist (1991) —, 1991, ApJ, 371, 111
- Irwin et al. (1987) Irwin J. A., Seaquist E. R., Taylor A. R., Duric N., 1987, ApJ, 313, L91
- Iyomoto et al. (2001) Iyomoto N., Fukazawa Y., Nakai N., Ishihara Y., 2001, ApJ, 561, L69
- Józsa et al. (2009) Józsa G. I. G., Oosterloo T. A., Morganti R., Klein U., Erben T., 2009, A&A, 494, 489
- Koda et al. (2002) Koda J., Sofue Y., Kohno K., Nakanishi H., Onodera S., Okumura S. K., Irwin J. A., 2002, ApJ, 573, 105
- Kondratko et al. (2005) Kondratko P. T., Greenhill L. J., Moran J. M., 2005, ApJ, 618, 618
- Koribalski et al. (2010) Koribalski B. S., 2010, in Astronomical Society of the Pacific Conference Series, Vol. 421, Galaxies in Isolation: Exploring Nature Versus Nurture, Verdes-Montenegro L., Del Olmo A., Sulentic J., eds., p. 137
- Lawrence et al. (1985) Lawrence, A., Ward, M., Elvis, M., Fabbiano, G., Willner, S. P., Carleton, N. P., & Longmore, A. 1985, ApJ, 291, 117
- McDermid et al. (2015) McDermid, R. M., Alatalo, K., Blitz, L., et al. 2015, MNRAS, 448, 3484
- Middelberg et al. (2007) Middelberg E., Agudo I., Roy A. L., Krichbaum T. P., 2007, MNRAS, 377, 731
- Morganti et al. (2005) Morganti, R., Tadhunter, C. N., Oosterloo, T. A. 2005, A&A, 444, L9
- Morganti et al. (2007) Morganti R., Holt J., Saripalli L., Oosterloo T. A., Tadhunter C. N., 2007, A&A, 476, 735
- Morganti (2011) Morganti, R. 2011, arXiv:1112.5093
- Morganti et al. (2013) Morganti, R., Fogasy, J., Paragi, Z., Oosterloo, T., Orienti, M. 2013, Sci, 341, 1082
- Morganti et al. (2015) Morganti R., Oosterloo T., Oonk J. B. R., Frieswijk W., Tadhunter C., 2015, A&A, 580, A1
- Nyland et al. (2013) Nyland, K., Alatalo, K., Wrobel, J. M., et al. 2013, ApJ, 779, 173
- Oosterloo (2011) Oosterloo, T.A. 2011, http://www.astron.nl/~oosterlo/peeling.pdf
- Pedlar et al. (1996) Pedlar A., Mundell C. G., Gallimore J. F., Baum S. A., O’Dea C. P., 1996, Vistas in Astronomy, 40, 91
- Pietsch et al. (1998) Pietsch W., Trinchieri G., Vogler A., 1998, A&A, 340, 351
- Planesas et al. (1997) Planesas P., Colina L., Perez-Olea D., 1997, A&A, 325, 81
- Rupke et al. (2002) Rupke D. S., Veilleux S., Sanders D. B., 2002, ApJ, 570, 588
- Rupke et al. (2005a) Rupke, D. S., Veilleux, S., & Sanders, D. B. 2005a, ApJ, 632, 751
- Rupke et al. (2005b) Rupke, D. S., Veilleux, S., & Sanders, D. B. 2005b, ApJS, 160, 115
- Richter & Sancisi (1994) Richter, O.-G., & Sancisi, R. 1994, A&A, 290, L9
- Sakamoto et al. (1999) Sakamoto K., Okumura S. K., Ishizuki S., Scoville N. Z., 1999, in The Formation of Galactic Bulges, Carollo C. M., Ferguson H. C., Wyse R. F. G., eds., p. 132
- Sancisi et al. (2008) Sancisi R., Fraternali F., Oosterloo T., van der Hulst T., 2008, A&AR, 15, 189
- Sault et al. (1995) Sault R. J., Teuben P. J., Wright M. C. H., 1995, in Astronomical Society of the Pacific Conference Series, Vol. 77, Astronomical Data Analysis Software and Systems IV, Shaw R. A., Payne H. E., Hayes J. J. E., eds., p. 433
- Sawada-Satoh et al. (2000) Sawada-Satoh S., Inoue M., Shibata K. M., Kameno S., Migenes V., Nakai N., Diamond P. J., 2000, PASJ, 52, 421
- Sofue et al. (2001) Sofue Y., Koda J., Kohno K., Okumura S. K., Honma M., Kawamura A., Irwin J. A., 2001, ApJ, 547, L115
- Soifer et al. (1987) Soifer B. T., Sanders D. B., Madore B. F., Neugebauer G., Danielson G. E., Elias J. H., Lonsdale C. J., Rice W. L., 1987, ApJ, 320, 238
- Strickland et al. (2004) Strickland D. K., Heckman T. M., Colbert E. J. M., Hoopes C. G., Weaver K. A., 2004, ApJSupp, 151, 193
- Tadhunter et al. (2014) Tadhunter C., Morganti R., Rose M., Oonk J. B. R., Oosterloo T. 2014, Nature, 511, 440;
- van der Hulst et al. (2001) van der Hulst J. M., van Albada T. S., Sancisi R., 2001, in ASP Conf. Ser., Vol. 240, Gas and Galaxy Evolution, Hibbard J. E., Rupen M., & van Gorkom J. H., ed., Astron. Soc. Pac., San Francisco, p. 451
- Trotter et al. (1998) Trotter A. S., Greenhill L. J., Moran J. M., Reid M. J., Irwin J. A., Lo K.-Y., 1998, ApJ, 495, 740
- Veilleux et al. (1994) Veilleux S., Cecil G., Bland-Hawthorn J., Tully R. B., Filippenko A. V., Sargent W. L. W., 1994, ApJ, 433, 48
- Walter et al. (2008) Walter F., Brinks E., de Blok W. J. G., Bigiel F., Kennicutt, Jr. R. C., Thornley M. D., Leroy A., 2008, AJ, 136, 2563
- Wannier et al. (1972) Wannier, P., Wrixon, G. T., & Wilson, R. W. 1972, A&A, 18, 224
- Wang et al. (2013) Wang J., et al., 2013, MNRAS, 433, 270
- Willott et al. (1999) Willott C. J., Rawlings S., Blundell K. M., Lacy M., 1999, MNRAS, 309, 1017
- Wu (2009) Wu Q., 2009, MNRAS, 398, 1905
Appendix A Channel maps