The Effect of Halo Mass on the H I Content of Galaxies in Groups and Clusters
Abstract
We combine data from the Sloan Digital Sky Survey (SDSS) and the Arecibo Legacy Fast ALFA Survey (ALFALFA) to study the cold atomic gas content of galaxies in groups and clusters in local universe. A careful cross-matching of galaxies in the SDSS, ALFALFA and SDSS group catalogs provides a sample of group galaxies with stellar masses and group halo masses . Controlling our sample in stellar mass and redshift, we find no significant radial variation in the galaxy H I gas-to-stellar mass ratio for the halo mass range in our sample. However, the fraction of galaxies detected in ALFALFA declines steadily towards the centers of groups with the effect being most prominent in the most massive halos. In the outskirts of massive halos a hint of a depressed detection fraction for low mass galaxies suggests pre-processing that decreases the H I in these galaxies before they fall into massive clusters. We interpret the decline in the ALFALFA detection of galaxies in the context of a threshold halo mass for ram pressure stripping for a given galaxy stellar mass. The lack of an observable decrease in the galaxy H I gas-to-stellar mass ratio with the position of galaxies within groups and clusters highlights the difficulty of detecting the impact of environment on the galaxy H I content in a shallow H I survey.
1 INTRODUCTION
The amount of cold gas in group and cluster galaxies provides information on the impact of these environments on galaxy evolution. Previous studies have shown that the distribution of cold gas in galaxies, traced by neutral hydrogen (H I), is affected primarily by tidal interactions (Toomre & Toomre, 1972) and ram pressure stripping (Gunn & Gott, 1972) (see Boselli & Gavazzi, 2006 for review of physical processes in galaxy environment).
Tidal interactions are expected to be important in galaxy groups but less so in clusters due to the large relative velocities of galaxies and short interaction time scales (Mihos, 2004). Alternatively, ram pressure stripping is thought to be responsible for H I-deficiency in cluster galaxies (Boselli & Gavazzi, 2006; Roediger, 2009; Gavazzi et al., 2013). Furthermore, ram pressure stripping can be felt by any galaxy containing gas. Ram pressure can strip the cold gas in ellipticals (e.g., Lucero et al., 2005; McCarthy et al., 2008) and dwarfs (e.g., McConnachie et al., 2007; Freeland & Wilcots, 2011), and the hot halo gas in galaxies (e.g., Jeltema et al., 2008) causing ‘starvation’ (Larson et al., 1980). For this work we select our sample to minimize the impact of tidal interactions so that we can focus on the effects of ram pressure stripping.
The impact of ram pressure stripping on galaxies has been well studied in the Virgo and Coma clusters. Statistical analyses of the H I gas content of their member galaxies provides evidence for increasing gas depletion toward the cluster center for optically-selected galaxies (e.g., Haynes et al., 1984; Haynes & Giovanelli, 1986; Solanes et al., 2001) and for H I-selected late type galaxies from ALFALFA (Gavazzi et al., 2013). The disturbed H I morphologies of individual galaxies in Virgo and Coma cluster have provided additional evidence for on-going ram pressure stripping (e.g., Bravo-Alfaro et al., 2000, 2001; Chung et al., 2009, 2007; Crowl et al., 2005; Kenney et al., 2004; Vollmer et al., 2008). Nevertheless, Taylor et al. (2012) and Cortese et al. (2008) find only marginal evidence for increasing H I-deficiency toward the inner regions of the Virgo and the Coma/A1367 clusters respectively using H I-selected samples from the Arecibo Galaxy Environment Survey (Auld et al., 2006). This lack of H I depletion in these clusters is likely due to the limited dynamic range of this flux-limited H I survey.
While statistical and individual observations suggest that interaction between galaxies and the intracluster medium is important for the removal of gas from galaxies in the most massive groups, the situation is less clear in smaller groups (Rasmussen et al., 2012). In a small number of low mass groups there is evidence for individual galaxies that have been ram-pressure stripped of their gas (e.g., Bureau & Carignan, 2002; Freeland & Wilcots, 2011; McConnachie et al., 2007; Rasmussen et al., 2006; Sengupta et al., 2007). Some of these groups also have X-ray detections of a hot intergalactic medium (IGM) consistent with the ram pressure stripping explanation.
A few recent studies have examined the impact of environment for wide range of galaxy group halo masses using statistical sample. Catinella et al. (2013) used galaxies from the GALEX Arecibo SDSS survey (GASS; Catinella et al., 2010, 2012) to show that the H I gas fraction (defined as in their work) is at least 0.4 dex smaller for galaxies with stellar masses that reside in groups with halo mass . Fabello et al. (2012) stacked ALFALFA spectra of galaxies meeting the GASS selection criteria in bins of stellar mass and local density and found a strong decline in the galaxy H I content in dark matter halos with mass . Hess & Wilcots (2013) used the SDSS group catalog (Berlind et al., 2006) and the ALFALFA 40% catalog (Haynes et al., 2011) to show that as group membership increases, galaxy group centers become increasingly deficient of H I-rich galaxies. This work builds on these studies by using a control sample (i.e., isolated field galaxies with similar stellar mass and redshift) to compare the impact of the groups and clusters to the H I gas content of galaxies.
Hydrodynamic simulations show that ram pressure stripping can remove the outer H I gas from a galaxy falling into cluster (e.g., Abadi et al., 1999; Marcolini et al., 2003; Roediger & Brüggen, 2007; Tonnesen & Bryan, 2009, 2010) within 10-100 Myr (Abadi et al., 1999; Marcolini et al., 2003; Roediger, 2009; Tecce et al., 2010) while complete unbinding of the disk gas may take a few 100 Myr (Roediger, 2009), less than the dynamical time scale in groups and clusters ( Gyr, Boselli & Gavazzi, 2006). Theoretical models of ram pressure stripping based on the original formulation in Gunn & Gott (1972) find that the ratio of the mass of the infalling galaxy to that of the host group or cluster is an important parameter governing the efficiency of ram pressure stripping (Hester, 2006) and the fraction of galaxies without cold gas increases toward the cluster center due to increasing ram pressure (Tecce et al., 2010). Therefore one can expect that gas depletion will increase toward the center of groups and clusters and that the depletion will be more significant in more massive clusters.
We use a statistical sample of galaxies with H I measurements from the ALFALFA survey to investigate the distribution of galaxy H I gas-to-stellar mass ratio as a function of the projected distance from the center of galaxy group halos for wide range of halo masses. We have combined the ALFALFA H I source catalog, the SDSS photometric and spectroscopic catalog, and the SDSS group catalog. In addition, we have created a control sample to remove the biases that arise from the correlation between stellar mass and H I gas-to-stellar mass ratio (Catinella et al., 2012; Huang et al., 2012).
In Section 2, we introduce the data sets used in this study and discuss our sample selection. In Section 3 we describe the procedure used to match SDSS galaxies, group catalog, and H I sources from ALFALFA. In Section 4, we examine the distribution of galaxy H I gas-to-stellar mass ratio and the fraction of the H I detected galaxies as a function of the projected distance from the group center and derive a simple ram pressure stripping criterion depending on group halo mass which provides a plausible explanation to our findings. In Section 5 we discuss the implications of our results and the relevant issues and summarize the results in Section 6. If not explicitly stated otherwise, we use a spatially flat LCDM cosmology with , and , where .
2 DATA
The galaxies in this sample are selected from the NASA Sloan Atlas catalog 111http://www.nsatlas.org/ (Blanton et al., 2011) and have H I 21 cm measurements in the ALFALFA 40% catalog (Haynes et al., 2011) and a group identification in the SDSS group catalog (Yang et al., 2007). We restrict the sample to galaxies in halos with masses , more than 4 members, and redshifts of . A complementary sample of isolated galaxies is used to create a control sample for this study. The cross-matching of the three catalogs is discussed in detail in Section 3 but it is useful to note that the catalogs have very different selection functions and completeness. Requiring that the galaxies be in all three catalogs produces a sample that is mainly limited by the ALFALFA selection function.
2.1 The Optical Galaxy Sample
Our optical galaxy sample is selected from the NASA Sloan Atlas catalog (Blanton et al., 2011) which includes photometric and spectroscopic measurements for 150,000 galaxies within Mpc () selected from SDSS DR8 (Aihara et al., 2011). The size of the NASA Sloan Atlas catalog is much smaller than the full SDSS DR8 because of the redshift limit. However, the NASA Sloan Atlas catalog provides more reliable and accurate photometry than the SDSS DR8 catalog. In particular, the improved background subtraction removes the size-dependent flux bias for galaxies with half-light radii of ″(Blanton et al., 2011). The NASA Sloan Atlas catalog also provides an improved photometric center for galaxies in which the SDSS spectrum is not coincident with the photometric center and has eliminated objects where the SDSS spectroscopic object is a sub-clump of a larger galaxy. These improvements allow for a more reliable estimate of stellar mass and improved matching with the ALFALFA catalog galaxies.
The optical photometry from the NASA Sloan Atlas catalog is used to derive the stellar masses of the galaxies. Galaxy stellar mass is computed from galaxy color and luminosity following Bell et al. (2003):
| (1) |
where is the SDSS -band absolute magnitude and is the color based on the Sérsic model magnitude. The color-based stellar mass measurement is used for consistency with the stellar mass definition in the SDSS group catalog (Yang et al., 2007). However, the results presented here do not change if stellar masses derived from SED fitting are used instead.
2.2 The H I Galaxy Sample
The ALFALFA survey is an extragalactic H I 21 cm line survey that provides information about the neutral atomic gas content of nearby galaxies (, Giovanelli et al., 2005). The survey covers 7000 square degrees of sky with 10 velocity resolution (after Hanning smoothing), an rms sensitivity of 1.8 mJy beam-1 (Giovanelli et al., 2005), and a positional accuracy of 24″ for sources with (Giovanelli et al., 2007). The currently available source catalog, , contains sources within 40% of the total survey area (Haynes et al., 2011) and includes measurements of redshift, H I flux, and H I line width that can be used to determine the H I mass of the source using the relation (Haynes et al., 2011):
| (2) |
where is the distance to the galaxy in Mpc, is the H I 21 cm flux density, and is the H I flux of the source integrated over the velocity.
Both “code 1” sources, which are highly reliable detections with , and “code 2” sources, which are lower signal-to-noise detections () that are likely to be real because there is a known optical counterpart at the redshift of the H I source (Haynes et al., 2011), are included in our sample. The majority (76%) of the sample consists of “code 1” sources and the fraction of “code 2” sources does not vary significantly with the projected distance from group center.
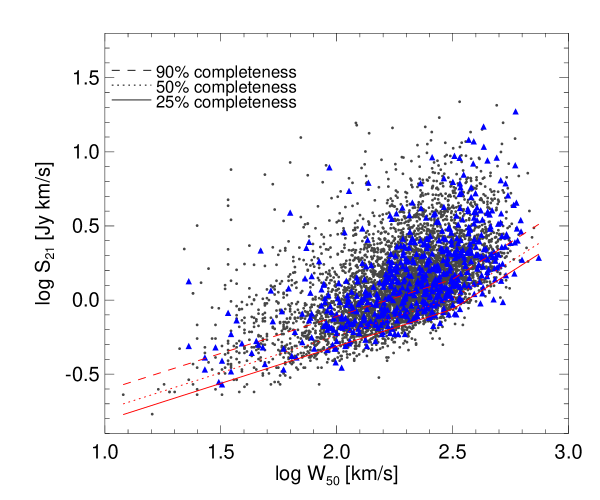
Figure 1 shows the relationship between the velocity integrated H I flux and the H I 21 cm line width measured at 50% of the peak flux, for the sample in this study. The 25%, 50%, and 90% completeness limits for the catalog (Haynes et al., 2011) are indicated by the red lines in the figure. The blue triangles are the group galaxies and the grey points are the isolated galaxies used as controls (see §3.1 for details on how this sample was selected from the cross-match of the three catalogs). The fraction of the sample below each completeness limit is nearly same for the isolated and group samples: 41% and 6% of them are below the 90% and 25% completeness limit.
2.3 The Galaxy Group Catalog
The goal of this study is to understand the impact of the group environment on the H I gas content in galaxies. To determine the group membership of galaxies in our sample, we use the SDSS DR7 group catalog222http://gax.shao.ac.cn/data/Group.html updated from the DR4 group catalog (Yang et al., 2007). The catalog uses galaxies in the SDSS DR7 spectroscopic sample with and redshift completeness . The group finding algorithm has been extensively tested using mock galaxy redshift survey catalogs and has proven to be successful in associating galaxies that reside in a common halo (Yang et al., 2005). In particular, this halo-based group finder works well for poor groups and identifies groups with only one member (i.e., isolated galaxies). The group halo masses are determined down to using two methods: ranking by luminosity and stellar mass of galaxies in groups. Although we used the luminosity ranked group halo mass, the results do not change if the stellar mass ranked halo mass is used instead. The group finder has been shown to correctly select more than 90% of the true halos with (Yang et al., 2007), which allows us to reliably study our galaxy samples within groups and clusters with halo mass .
In order to investigate galaxy H I properties as a function of the projected distance from the group center, we normalize each galaxy’s radial position by the virial radius of the group. For virial radius of group with halo mass , we adopt the radius that encloses an overdensity of 180 relative to the critical density (Yang et al., 2007):
| (3) |
which is based on the WMAP3 cosmological model parameters (Spergel et al., 2007), , and , where . While these parameters differ slightly from those used in this study, using this formulation does not make a significant difference given the low redshifts of our sample ().
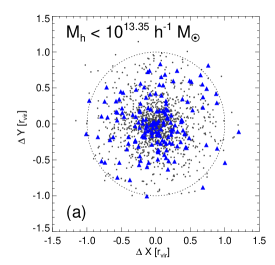
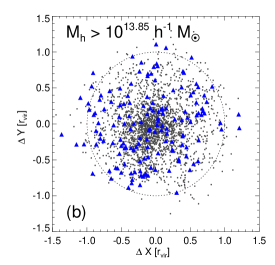
Figure 2 shows the normalized positions of the galaxies in the most massive and least massive group halos ( and ) in this study. Complete details regarding the galaxy samples in groups are discussed in Section 3.2. Compared with the distribution of the optically-selected galaxies (grey dots), the ALFALFA detected galaxies (blue triangles) are rarer near the centers of the groups with the effect significantly more pronounced for the more massive groups. This lack of H I detections near group centers matches the findings of Hess & Wilcots (2013). In Section 4.2 we investigate the H I detection fraction more carefully by using a control sample to avoid the effect of H I selection bias by the masses and distances of galaxies at different positions within group halos.
3 CROSS-MATCHING AND SAMPLE DEFINITION
3.1 Cross-matching SDSS, ALFALFA, and the Group Catalog
For each SDSS galaxy in the NASA Sloan Atlas catalog, the associated group halo was identified by locating 333All matching was done using the catalog manipulation software Topcat (Taylor, 2005) the SDSS galaxy in the group catalog that is within 5″ in position. This produces 103,287 SDSS galaxy matches. Since galaxies in the SDSS group catalog and in the NASA Sloan Atlas catalog are the same sources, 5″ positional matching is very robust and the redshift difference is typically (i.e., 30 km in velocity). Only 0.1% of matches have redshift differences of (none have ). The larger velocity differences occur for galaxies where the NASA Sloan Atlas Catalog uses a non-SDSS redshift measurement that is deemed more reliable. Generally this happens when SDSS does not have a spectrum near the photometric center of the galaxy. All 103,287 NASA Sloan Atlas galaxies that are associated with groups were then cross-matched with the catalog. Sources within 40″ in position and 0.001 in redshift (300 km in velocity) were considered potential matches.
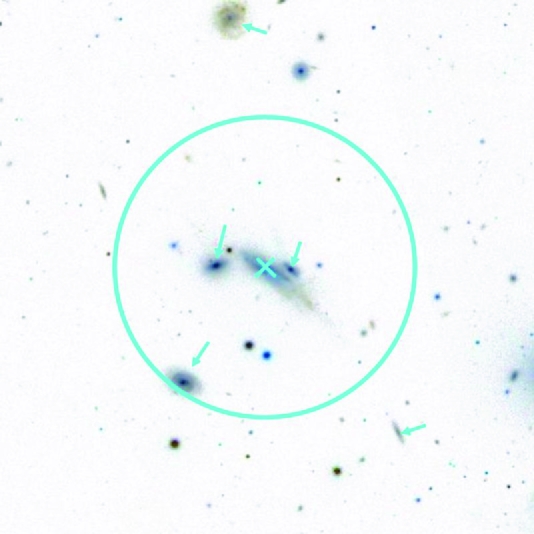
In total there were 6444 potential matches between SDSS group galaxies and ALFALFA sources. However, since the Arecibo beam is large (3.5′diameter), there can be more than one galaxy in the beam that will influence the measurement of the H I mass. Figure 3 shows an extreme example in which there are 4 galaxies in Hickson Compact Group 69 within the ALFALFA beam. In this case, the H I measurement is likely not that of a single galaxy. Cases of galaxy confusion will be more common in groups than in the field and thus the H I mass of the best matched galaxy among the multiple galaxies within the Arecibo beam will be biased (e.g., the best match indicated by the cross in Figure 3). To address this problem we exclude from the matched sample 520 galaxies that have additional SDSS sources within a 1.75′ radius. Removing these galaxies with close neighbors decreases our sample size to 5924 (a decrease of 8%) and removes systems that are likely to be experiencing strong and complex gravitational interactions as is the case in compact groups (e.g., Cluver et al., 2013; Rasmussen et al., 2012) rather than purely galaxy-IGM interactions. This proximity limit excludes galaxies that are within 20 kpc at and 105 kpc at .
The sample selected from matching the three different catalogs, excluding galaxies with close neighbors includes 5924 galaxies. For these galaxies, the catalogs provide SDSS galaxy parameters, SDSS group parameters, and the ALFALFA H I 21 cm parameters. The lower limit on the redshift () of the cross-matched sample is set by the SDSS group catalog and the upper limit () is set by the NASA Sloan Atlas catalog. This is the matched sample catalog from which we construct the final group sample with controls as discussed in the following section.
3.2 Defining the Group and Control Samples
Our cross-matched galaxy sample is limited primarily by the ALFALFA detection limits thus biasing the sample towards gas-rich systems. In particular, the detectability of an H I source depends on the galaxy redshift and the H I mass which is, at least loosely, correlated with the stellar mass (e.g., Catinella et al., 2010, 2012; Huang et al., 2012). To mitigate these biases, we constructed a control sample of isolated field galaxies. The control galaxies were selected to have similar stellar masses () and redshifts () as their group counterparts.
The catalog of 5924 galaxies provides the sample from which we drew both our isolated and group galaxies. Group galaxies were selected to have halo masses larger than , significantly larger than the 90% completeness limit () in the group catalog (Yang et al., 2007), and group membership of more than 4 galaxies. Isolated galaxies were identified as galaxies residing in groups with one member. The number of galaxies with one group member (i.e., isolated field galaxies) and with group membership of more than 4 galaxies are 4372 and 618 respectively. The remaining 934 galaxies which are not included in this study reside in groups with 2-4 members.
H I gas-to-stellar mass ratio is known to be correlated with galaxy stellar mass down to with a large scatter (0.43 dex, Catinella et al., 2012). This trend may continue to the lower masses but is harder to quantify because of sample incompleteness (Cortese et al., 2011; Huang et al., 2012; Rosenberg et al. in preparation). Because of the large scatter in this relationship, a small control sample will introduce a sampling bias and varying the numbers of controls will produce differences in the sample variance. Therefore, we use the same number of control galaxies, 8, for every group galaxy.
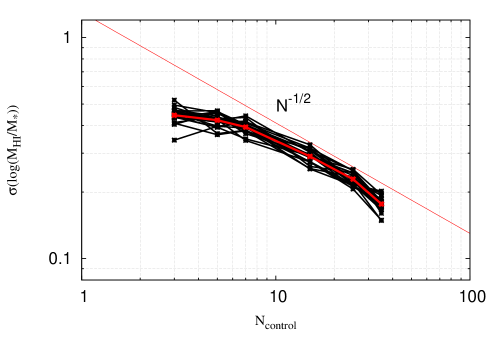
Forcing each group galaxy to have the same number of controls means that for a larger number of controls, the number of group galaxies with enough controls that meet the selection criteria ( and ) decreases. Alternatively, decreasing the number of control galaxies increases the number of group galaxies with a full complement of controls, but it also increases the variance in the control sample. To optimize the control sample size, we investigated how the standard deviation of the H I gas-to-stellar mass ratio changes as the size of the control sample changes. For 50 randomly selected pairs of values for stellar mass and redshift that lie within the survey range a control sample was assembled. The average for each group of controls was calculated, resulting in 50 values of this parameter. The mean and standard deviation of these 50 values was then computed. This procedure was repeated for control samples with and and the values for the standard deviation were plotted as a function of the number of controls in Figure 4. The same computation was carried out 20 times and the results are shown by the 20 black lines. The red line is the average of the 20 trials. This figure shows that small control samples deviate significantly from the expected statistical behavior of variance with sample size (shown by the thin solid line), , which is proportional to , because the controls are not representative of the H I gas-to-stellar mass ratio distribution. Alternatively, as the number of controls increases, the number of available group galaxies declines.
Figure 4 indicates that the optimal control sample size where the variance goes as while maximizing the number of group galaxies is between 7 and 10. We use 8 control galaxies for each group galaxy as a balance between maximizing the number of controls and maximizing the number of group galaxies. Group galaxies with fewer than 8 controls meeting the selection criteria ( dex and ) are not included in the final sample. The best controls were selected by ranking the isolated galaxies based on the normalized distance from the group galaxy in the stellar mass-redshift plane (i.e., d). The 8 closest isolated galaxies were selected as the control sample for each group galaxy. This technique is similar to that used by Ellison et al. (2008).
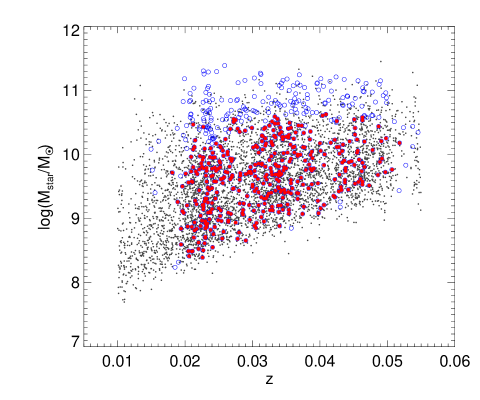
Figure 5 shows the distribution of stellar masses and redshifts for galaxies in the group and isolated samples. Small dots are the isolated galaxies used as controls and blue circles are the group galaxies. The filled circles show the final galaxy sample (390 group galaxies that each have 8 controls). Note that there are not many group galaxies with a full complement of controls above . For this reason, our final sample is limited by . The stellar mass and redshift distributions of the galaxy group sample and the sample of their associated controls are drawn from the same population with more than 99% and 95% confidence respectively, based on the Kolmogorov-Smirnov (K-S) test (Press et al., 1986).
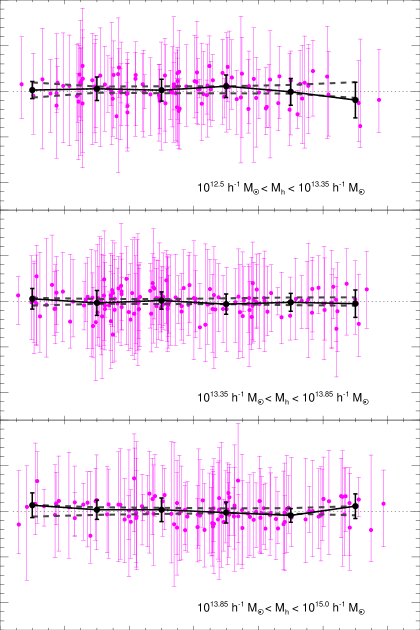
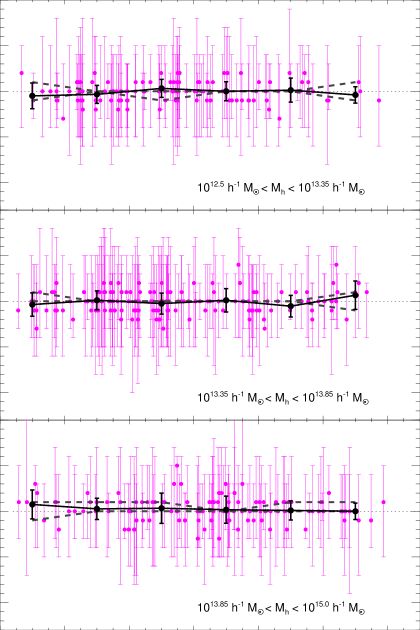
Figure 6 and 7 show galaxy stellar mass and redshift for the group and control samples as a function of the projected distance from the group center normalized by the group virial radius (). The three panels show different halo mass bins. The values are the difference between the log of the stellar mass of the group galaxy and the log of the average stellar mass of its 8 controls. The values are the difference between the redshift of the group galaxy and the average redshift of its 8 controls. Error bars associated with each group galaxy correspond to the range of stellar mass and redshift spanned by the galaxy’s 8 control samples. The black solid lines connect the average of and in 6 radial bins up to 1.2 with errors defined by standard deviations of and in each radial bin. The dashed lines show the and quantile of the range of radial variation of the average values of and . This range is obtained by randomly shuffling the galaxies’ projected distance within the full range of projected distances of the group sample while keeping the values of and the same. These ranges provide a measure of the statistical significance of the observed radial variation. Note that the error bars for each galaxy are always smaller than 0.1 in and 0.001 in since the control galaxies are selected to have smaller stellar mass and redshift difference than these values.
The radial variation of the average stellar mass compared to the control sample is within 0.01 dex which corresponds to less than 3% difference in stellar mass. The radial variation of redshift difference is within 0.0002. The stellar masses and redshifts of the group galaxies do not show any systematic radial variation with respect to the control sample, which ensures that any measured systematic trends as a function of projected group centric distance are not driven by the radial variation of these properties.
4 THE INFLUENCE OF THE GROUP ENVIRONMENT ON THE H I CONTENT IN GALAXIES
The goal of this work is to study the impact of environment on the H I gas content of galaxies in groups and clusters. To examine the impact of environment, we compare the gas content of galaxies within groups and clusters to that in field galaxies (i.e., the control sample) as a function of projected distance from the group center.
4.1 Radial Distribution of H I Gas-to-Stellar Mass Ratio as a Function of Halo Mass
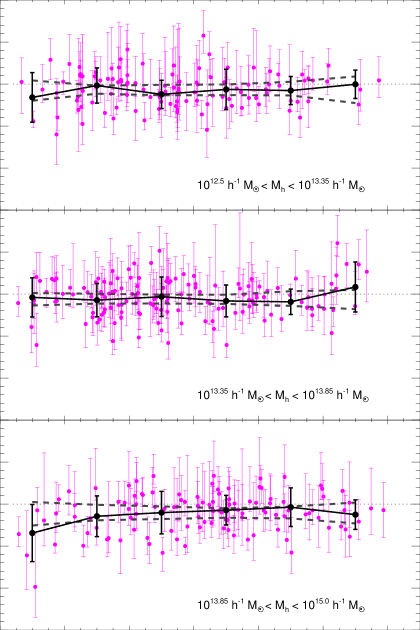
Figure 8 shows as a function of projected distance from the group center normalized by . The value is defined as:
| (4) |
where is the average value of H I gas-to-stellar mass ratio of the control sample.
The three panels show the results for three different halo mass bins, , and . The halo mass bins are chosen so that there are similar number of galaxies () in each bin and so that the variation in the number of galaxies across the radial bins is small (i.e., the standard deviation of the number of galaxies in the 6 radial bins is % of the average number of galaxies). The results presented here do not change significantly as the boundaries between the bins are shifted from to and from to . The error bars and symbols in this figure are the same as in Figure 6. The black points connected by a solid line show the average in each bin of projected distance from the group center.
Overall there is no statistically significant variation in the average as a function of the projected group centric distance. However, there is a hint of a decreasing for galaxies in the central region () of the group halos in the most massive halo bin 444These massive halos were identified with some of known galaxy clusters in the Abell catalog (Abell et al., 1989), including A160, A996, A1185, A1656 (in Coma), A1795, A1797, A2040, A2052, A2063, A2147 (in Hercules) and A2592.. The average in the smallest projected distance bin is slightly smaller than the range enclosed by the and quantile of the variation but the deviation is small so it can only hint at the impact of the most massive halos on the gas content of galaxies near their centers.
4.2 Radial Distribution of Detection Fraction as a Function of Halo Mass
The lack of a statistically significant result in Figure 8 may be driven by the selection of only the most gas-rich galaxies by ALFALFA. Therefore, we investigate the fraction of galaxies detected by ALFALFA as function of projected distance from the group center. For this analysis we compute the detection fraction for the group galaxies and compare it with the detection fraction of the associated controls. In practice, we define “detection ratio” as the ratio of the fraction of group galaxies detected at a given distance from the group center to the fraction of the associated control galaxies that are detected:
| (5) |
where is the number of galaxies detected by the ALFALFA survey and is the total number of SDSS galaxies in the ALFALFA survey region.
For each bin of projected group centric distance, we compute the numerator using all group galaxies that meet the selection criteria defined in Section 3.2. Then, for each SDSS group galaxy (both detected and not detected by ALFALFA) used for computing the numerator , we identify a set of 8 isolated control galaxies (number of group members equals one in the group catalog) with similar stellar mass and redshift ( dex and ). The denominator in Equation 5 is the fraction of the ALFALFA detected control galaxies in the projected group centric distance bin. The denominator provides a normalization of the detection fraction that is sensitive to the mass and distance of the group galaxies in each bin. For the control sample, and halo mass do not have a physical meaning. However, each control galaxy is associated with an individual galaxy that does have a projected separation from the group center so each control is associated with a particular projected separation through its associated galaxy.
Because there are different ways to select a control sample (e.g., the single best match like in Ellison et al. (2015) or allowing control galaxies to be selected only once), we performed this analysis using different selection criteria for the control sample and find no significant difference in the results. Therefore, we present the results for 8 controls, consistent with the analysis from Section 4.1.
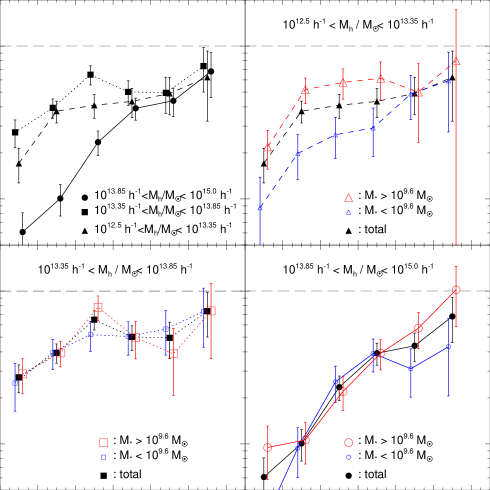
The upper left-hand panel of Figure 9 shows the detection ratio for galaxies in group halos as a function of the group-centric distance for the same three halo mass bins as in Figure 8. Error bars are Poisson errors. The average detection fraction for the control galaxies is 27% and there is little variation among the three halo mass sub-samples (as expected since these are all isolated galaxies and are only associated with a halo mass bin because of the galaxies for which they serve as a control). When broken down further, there is a 7% variation in the detection fraction of the control samples across the radial bins with which they are associated (the higher variance is due to the smaller number of control galaxies associated with each radial bin).
For all halo masses there is a decrease in the detection ratio closer to the center of the groups. The decrease in detection ratio is significantly stronger for galaxies in the most massive halo bin reaching only 6% of the detection fraction of the control sample in the smallest projected distance bin at .
We can only measure the projected distance of galaxies with respect to the group center and so in each projected radius bin there are foreground or background “interlopers”, group galaxies at significantly larger real separations from the group center than their projected separations. Therefore, the detection fraction in a given projected separation bin is an upper limit because these interlopers are further from the group center and thus more similar to the field galaxy population. To estimate the population of these interlopers in each bin, we use the projected mass profile from Łokas & Mamon (2001) which is based on an NFW profile (Navarro et al., 1997) with concentration parameter . At projected distances of , and , these model predicts interloper fractions of 0.33, 0.16, 0.11, 0.07, 0.06, and 0.05 respectively.
In the inner-most radial bin , the numbers of group galaxies detected by ALFALFA are 16, 25, 9 and the total number of group galaxies are 362, 366, 486, for the lowest, middle, and highest halo mass bins respectively, which corresponds to detection fractions of 4%, 7% and 2% respectively. If one third of galaxies in the inner-most radial bin are interlopers (120, 120 and 161 for the each halo mass bin), then even a modestly higher detection rate for these galaxies that only appear to be in the group because of projection effects would account for many of the detections. More relevant than the specific numbers, which are highly affected by small number statistics, is that these low detection rates in the centers of groups and clusters are likely to be upper limits because of these interlopers. In addition, the sample has been selected to avoid the densest groups (no more than one galaxy in the beam of the radio telescope) where some of these effects are likely to be even more severe.
4.2.1 Effect of Galaxy Stellar Mass
The differences in the depth of the gravitational potential well mean that the impact of environment on the H I in a galaxy may be correlated with galaxy mass. The three additional panels of Figure 9 show the detection ratio broken down by the galaxy stellar mass for each halo mass bin. The galaxies are divided into high (larger red symbol) and low (smaller blue symbol) stellar mass systems at a mass of which roughly corresponds to the median of the galaxy stellar mass distribution in the group sample. The detection ratio for low stellar mass galaxies () is significantly less than the ratio for high stellar mass galaxies () inside the virial radius () for the lowest halo mass bin (upper right-hand panel of Figure 9). The impact of the stellar mass of the galaxy on the detection ratio becomes less significant with increasing halo mass. For the highest mass halos, the detection ratio for low mass galaxies () just beyond the virial radius is only 43% of that in the field, corresponding to a deviation. Although the statistical significance is not large, this result may indicate that small galaxies in the outskirts of massive halos are already gas poor compared to the field galaxies with similar stellar mass and redshift.
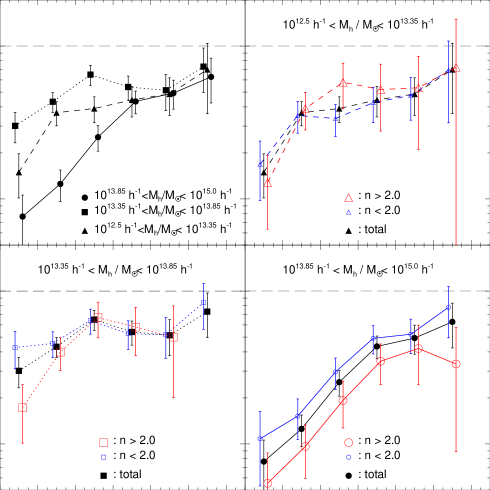
4.2.2 Effect of Galaxy Type: Sérsic index
The morphology-density relation (Dressler, 1980) implies that there are more early-type galaxies towards the centers of galaxy clusters (e.g., Blanton et al., 2005). To examine whether the decreasing detection ratio in Figure 9 is due to decreasing amounts of gas in the galaxies or to different galaxy morphologies as a function of position in the group the three additional panels of Figure 10 show the detection ratio broken down by the galaxy Sérsic index for each halo mass bin. The galaxies are divided into high (larger red symbol) and low (smaller blue symbol) Sérsic index systems at and then control sample for each galaxy with (and ) is drawn from the pool of isolated galaxies with (and ), using the same stellar mass and redshift criteria that we used. This cut in Sérsic index provides a very clean sample of late-type galaxies (Maller et al., 2009) that can be examined for gas depletion. However, the sample is more mixed and thus more difficult to interpret. We also controlled Sérsic index when making control sample by restricting Sérsic index difference between group galaxy and controls (i.e., ), however found that the result has not been changed qualitatively. The detection ratio for both low and high Sérsic index galaxies decreases toward the group center indicating that even in the disk galaxies gas is being depleted towards the center of the groups.
4.3 Halo Mass Dependent Ram Pressure Stripping
The strongly decreasing detection ratio of galaxies towards the center of the most massive halos compared with that of the lower mass halos suggests a gas depletion process that is dependent on halo mass. The H I gas depletion seen in galaxies that reside in massive clusters is best explained by ram pressure stripping (e.g., Boselli & Gavazzi, 2006; Cortese et al., 2011; Roediger, 2009; Vollmer et al., 2001). Some galaxies in groups also represent strong candidates for ram pressure stripping (e.g., Bureau & Carignan, 2002; McConnachie et al., 2007; Rasmussen et al., 2006; Sengupta et al., 2007) although it is harder to distinguish the impact of ram pressure stripping from that of tidal interactions in these lower mass halos (e.g., Kilborn et al., 2009; Rasmussen et al., 2008). The decrease in the detection fraction for galaxies with small () Sérsic indices implies that gas is being removed from the system regardless of the galaxy type and that mergers that can transform galaxies from late to early types are not the dominant reason for this result. This gas removal can take two forms in these environments, ram pressure stripping (removal of cold gas from the disk of the galaxy) and starvation (removal of hot gas from the galaxy halo). Since starvation can not be probed directly with these H I observations, we focus our discussion on ram pressure stripping. The simple criterion for ram pressure stripping first proposed by Gunn & Gott (1972) is:
| (6) |
where is the density of the hot intracluster medium (ICM), is the speed of infalling galaxy, is the galaxy stellar surface density, and is the galaxy interstellar medium (ISM) surface density. This criterion implies that gas stripping occurs if the ram pressure (i.e., force per unit area) is greater than the gravitational binding force per unit area in the ISM.
We provide a simple analytic calculation based on the Gunn and Gott (GG) criterion to examine the effect of halo mass on ram pressure stripping. The GG criteria has previously been modified to be expressed in terms of specific observables: for example, IGM electron density, a component of the galaxy velocity relative to the group, central stellar velocity dispersion of the galaxy, and H I gas density of the galaxy (e.g., Freeland & Wilcots, 2011; Grcevich & Putman, 2009; Grebel et al., 2003). To study the impact of halo mass on ram pressure stripping for a range of galaxy stellar masses we use the virial theorem and galaxy scaling relations to rewrite the left-hand side of the GG criterion to have explicit dependence on group halo mass and ICM density and the right-hand side to depend only on galaxy stellar mass (see Appendix A for details). With these changes the GG criterion depends on the mean electron number density in groups or clusters, the halo mass and the galaxy stellar mass:
| (7) |
Massive halos have high ICM densities (e.g., Cavagnolo et al., 2009) due to their strong gravitational potentials while small mass halos tend to have low ICM densities. The halo mass is also related with the X-ray luminosity through an observational scaling relation (e.g., Arnaud et al., 2007). Therefore, the virial theorem and X-ray scaling relation imply that the mean electron number density of the ICM, the halo mass, and the kinetic temperature of the ICM are related by (see Appendix A for details):
| (8) |
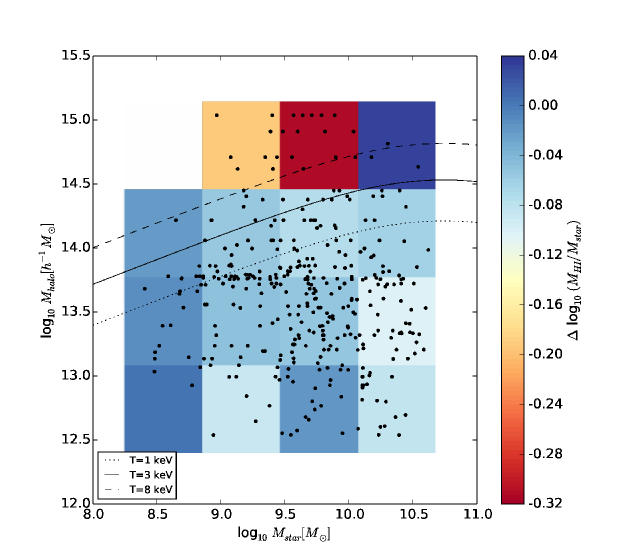
By combining these two relations and neglecting the redshift dependence, one can determine where the GG criterion is valid in the group halo mass and galaxy stellar mass plane for a given ICM temperature. Figure 11 shows the distribution of the group sample (black points) in the halo mass and galaxy stellar mass plane for galaxies within the virial radius of their group halo (where ram pressure is expected to play a role) with black lines representing Equation 7 for ICM temperatures ranging from 1 keV to 8 keV. The colored regions show the average of galaxies in each grid region weighted by their errors in . Regions with 0-1 galaxy have not been colored. The region above the black line for a given ICM temperature is where ram pressure wins over the surface gravity of the galaxy. Galaxies in halos with , are mostly located in the region where ram pressure wins, for a range of typical ICM temperatures (1-8 keV). Alternatively, galaxies in lower mass halos generally reside in the region where galaxy surface gravity wins over ram pressure. The galaxies with the lowest reside in the two bins where ram pressure stripping is expected to play the largest role.
Figure 11 implies that for the stellar mass range of the galaxies in our sample , and typical ICM temperature (1-8 keV), ram pressure is efficient for halo masses larger than , which explains the decreasing detection ratio toward the group center prominently seen in the most massive halo bin . Similarly Catinella et al. (2013) find that massive galaxies () in halos with show a decrement of 0.4 dex in H I gas-to-stellar mass ratio relative to the similar galaxies in lower density environments. Using semi-analytic galaxy formation models, Fabello et al. (2012) also infer that H I-deficient galaxies are more common in dark matter halos with . The modified ram pressure stripping criterion that depends on halo mass is used here to show that ram pressure stripping can be effective in depleting the H I for wider range of stellar mass .
5 DISCUSSION
5.1 Gas Removal in Group and Cluster Halos
Using the SDSS and ALFALFA surveys, we have examined the evidence for ram pressure stripping of H I gas in groups and clusters. We find no statistically significant evidence for a change in the galaxy H I gas-to-stellar mass ratio as a function of projected distance from the group center in this sample despite the existing evidence for gas depletion in clusters (Haynes et al., 1984; Haynes & Giovanelli, 1986; Solanes et al., 2001). This result is, however, consistent with the previous H I studies of gas depletion in Virgo Cluster galaxies (Taylor et al., 2012) and Coma Supercluster galaxies (Abell 1367, Cortese et al., 2008). The distribution of H I gas-to-stellar mass ratio in galaxies shows a large scatter (e.g., 0.43 dex in Catinella et al., 2012) even at fixed stellar mass which drives a large standard deviation (approximately 0.4 dex or a factor of 2.5 as seen in Figure 4) in . Although, in principle, it is possible to detect a difference in the average H I gas-to-stellar mass ratio between groups and field with enough statistics, our sample of groups with 8 controls (390) is not enough to detect the difference. A robust detection of gas depletion in groups will require deeper H I surveys that increase the dynamic range of detected gas fractions for a large number of galaxies in groups and clusters.
While the direct measurement of gas removal in groups and clusters using ALFALFA detected galaxies alone is not possible without relying on deeper H I survey for a sample with stellar mass threshold (GASS; Catinella et al., 2010, 2012) or stacking of ALFALFA spectra (Fabello et al., 2012), we confirm the results of Hess & Wilcots (2013) using a sample with matched controls and measure this removal indirectly through the decreasing detection ratio, which is a ratio of detection fraction for group galaxies to that for isolated galaxies. By controlling our sample for stellar mass and redshift we show that this is a real effect not a function of selection effects and sampling. We find that most significant decrease in detection ratio occurs in the most massive halos, as expected from ram pressure stripping discussed in Section 4.3. This result is consistent with previous studies by Catinella et al. (2013) and Fabello et al. (2012). Nevertheless, the detection ratio does decrease significantly in the inner-most regions of even the lowest mass groups which is consistent with the detection of X-rays in some halos of these masses (e.g., Helsdon & Ponman, 2000; Mulchaey, 2000; Zabludoff & Mulchaey, 1998).
Assuming the IGM temperature to be 1 keV for the lowest mass groups () in this study, our calculation indicates that ram pressure should only be effective for galaxies with stellar masses below yet all of the galaxies in this sample are more massive than this limit and still show a decreasing detection ratio towards the group center. Either the IGM temperature in these low mass groups is lower than assumed ( keV, e.g., Helsdon & Ponman, 2000; Trinchieri et al., 2012) implying a larger mean IGM density than from Equation 8 which is similar to the value for poor groups (, Zabludoff & Mulchaey, 1998) enough for ram pressure stripping of dwarf galaxies (e.g., Bureau & Carignan, 2002) or a process other than ram pressure stripping is responsible for removing the gas in these low mass halos (e.g., Rasmussen et al., 2012).
Using a large sample () of galaxies with H I mass inferred from optical photometry, Zhang et al. (2013) investigate the effect of galaxy stellar mass on the H I content of galaxies in groups and clusters and find that lower stellar mass galaxies show a stronger radial decrease in H I gas content toward the brightest cluster galaxy and that this trend becomes more significant for galaxies with lower stellar surface density. While we can not probe the effect of stellar surface density for given galaxy stellar mass due to small sample size, Figure 9 shows that for the lowest mass halos it is only the low mass galaxies that are significantly stripped while in the high mass halos all of the galaxies are likely to be impacted. Our result that the halo mass impacts the degree of gas depletion contrasts with those of Zhang et al. (2013) who find no difference as a function of group velocity dispersion as a proxy for halo mass. This difference may be related to the large dispersion in the velocity dispersion - halo mass relation (e.g., Weinmann et al., 2010) and/or the additional impact of tidal stripping on the gas in their sample galaxies (Zhang et al., 2013). For this study galaxies with neighbors within 1.75 ′ (which means no pair galaxies within 20 kpc at and 105 kpc at ) have been excluded. Many of the excluded galaxies with small velocity separations are likely to be undergoing tidal interactions as suggested by Scudder et al. (2012). Therefore, this sample should be significantly less strongly impacted by tidal interactions than Zhang et al. (2013) and should more clearly show the impact of ram pressure stripping on these galaxies.
5.2 Effect of Pre-processing
In hierarchical models, the gas content in galaxies decreases during interactions within small groups before they enter a large halo (e.g., Fujita, 2004). Observing this pre-processing of small groups is challenging because the current merger rate is considerably lower than in the past (Gottlöber et al., 2001). However, there is supporting evidence for pre-processing revealed, for example, by the star formation quenching as a function of galaxy environment in and around the Coma Supercluster (Cybulski et al., 2014); the distribution of post-starburst galaxies in sub-structures of galaxy clusters (Mahajan, 2013); and the ionized gas distribution in compact groups of galaxies (Cortese et al., 2006).
The detection ratio of galaxies at the largest group-centric distances (i.e., beyond the virial radius) may provide a measurement of how environment has affected the systems prior to their falling into the group. The upper left panel of Figure 9 shows with marginal (1.5) statistical significance that the H I detection fraction in massive halos () is % of the detection fraction for the control sample even beyond the virial radius (i.e., ). The effect is even more strongly pronounced for the lowest mass galaxies as shown in the lower right panel of Figure 9, where the detection fraction of the lowest mass galaxies is less than that of the control sample by 43% corresponding to a difference.
While not definitive because of the low statistical significance, this depression in the detection fraction for small galaxies in massive halos provides a tantalizing indication that these small galaxies are already H I deficient when they fall into the massive halos, as also suggested by Jaffé et al. (2012) based on the H I measurement of compact group. This trend of gas deficiency at the outskirt of massive halos supporting pre-processing scenario is predicted by semi-analytic model of mass accretion (e.g., McGee et al., 2009) and hydrodynamic simulation of H I gas content (e.g., Rafieferantsoa et al., 2014), and also implied by recent observational studies using statistical sample (e.g., Hess & Wilcots, 2013; Hou et al., 2014).
In considering the significance of this depression at large group centric distance and the other results presented here, it is important to consider whether the sample selection criteria (excluding groups with fewer than 5 members, excluding galaxies with close neighbors, and excluding galaxies with fewer than 8 controls) might bias these results. While bias can not be ruled out, these selection criteria should not influence these results within the bounds of the sample (i.e., we can not evaluate the impact of the group environment on the smallest and most compact groups) with the exceptions of the close neighbors. The removal of galaxies with close neighbors will preferentially eliminate interacting pairs. Interacting pairs, however, have not shown any significant decrease or increase in their detection fraction (Fertig et al. 2015 submitted) implying that the impact of removing galaxies with close neighbors will not introduce a significant bias to the detection ratio estimate.
6 CONCLUSIONS
We have investigated the H I gas content in groups and clusters over a wide range of halo masses and the results of this study are:
-
•
There is no statistically significant variation in H I gas-to-stellar mass ratio with projected distance from the group center in the sample studied here.
-
•
The detection ratio of galaxies decreases towards the center of groups spanning the range of masses studied here with the most significant decrease occurring towards the centers of the most massive halos.
-
•
We frame the GG criteria in terms of halo mass and stellar mass and find that the change in the radial distribution of detection ratio with respect to halo mass is qualitatively consistent with ram pressure stripping while the decrease in the detection ratio for galaxies with in the lowest mass halos is not consistent with ram pressure stripping unless the temperature of the IGM is lower than assumed (i.e., keV).
-
•
The detection ratio for low () stellar mass galaxies just beyond the virial radius of the most massive groups is 2 below unity, which could be due to pre-processing of these galaxies before they fall into the larger groups.
The lack of a significant detection of H I depletion in groups and clusters, indicates that ALFALFA is not sufficiently deep to measure this effect because of the large galaxy to galaxy dispersion in gas content. Even deeper H I surveys like the Arecibo Galaxy Environment Survey (AGES) do not find strong evidence for H I deficiency increasing toward the center of the Virgo (Taylor et al., 2012) and Coma/A1367 (Cortese et al., 2008) clusters. Explicitly measuring the amount of environment dependent gas depletion will require significantly deeper large statistical samples which might have to wait for the full SKA (Catinella et al., 2013).
Appendix A A simple form of the Gunn and Gott criterion depending on halo mass
A simple criterion for ram pressure stripping first proposed by Gunn & Gott (1972) is
| (A1) |
where is the density of hot intracluster medium (ICM), is the speed of infalling galaxy, and and is the density of galaxy stellar mass and interstellar medium (ISM) respectively. Using a simple assumption that the galaxy stellar mass () and ISM mass () are distributed along the same characteristic radius , we can rewrite this criterion as
| (A2) |
where is the mean electron number density in a galaxy cluster such that: and is the line of sight velocity dispersion of galaxies in groups and clusters (i.e., ).
If one defines the halo mass and the halo virial radius using the quantities at an overdensity of 180 and combines the virial theorem and Equation 3, one can modify Equation A2 and the ram pressure criterion including halo mass is written as
| (A3) |
where we replace by cold atomic gas mass .
Furthermore, if we adopt the scaling relations between and and between and , the physics on the right hand side of the above criterion can be described by galaxy stellar mass only. Among galaxy scaling relations, we use the relation from Masters et al. (2012) which finds the similar relation to other studies (Catinella et al., 2010; Fabello et al., 2011; Toribio et al., 2011) and the relation between and derived from the relation between galaxy stellar mass and half-light radius for late type galaxies with Sérsic index , in Shen et al. (2003). We define as which encloses nearly 100% and 90% of the total luminosity from the Sérsic profile for and respectively (e.g., Yoon et al., 2011). Then we can simplify the Equation A3 as follows.
| (A4) |
On the other hand, soft X-ray emission from galaxy cluster can be used to infer the mean electron number density of the cluster. One of the robust scaling relations is the - relation (Arnaud et al., 2007):
| (A5) |
where , is the kinetic temperature of ICM, is the total mass of a cluster enclosed by the radius and is the mass of hot gas enclosed by . By substituting with , we express the given halo mass and temperature at (i.e., ) as follows
| (A6) |
where is converted from (Reiprich et al., 2013) by assuming NFW profile (Navarro et al., 1997). By combining Equation A4 and A6 and using , one can find a region where ram pressure stripping becomes efficient for given galaxy stellar mass, halo mass and kinetic temperature of ICM in the halo, as shown in Figure 11.
References
- Abadi et al. (1999) Abadi M. G., Moore B., Bower R. G., 1999, MNRAS, 308, 947
- Abell et al. (1989) Abell G. O., Corwin Jr. H. G., Olowin R. P., 1989, ApJS, 70, 1
- Aihara et al. (2011) Aihara et al. H., 2011, ApJS, 193, 29
- Arnaud et al. (2007) Arnaud M., Pointecouteau E., Pratt G. W., 2007, A&A, 474, L37
- Auld et al. (2006) Auld et al. R., 2006, MNRAS, 371, 1617
- Bell et al. (2003) Bell et al. E. F., 2003, ApJS, 149, 289
- Berlind et al. (2006) Berlind et al. A. A., 2006, ApJS, 167, 1
- Blanton et al. (2005) Blanton et al. M. R., 2005, ApJ, 629, 143
- Blanton et al. (2011) Blanton et al. M. R., 2011, AJ, 142, 31
- Boselli & Gavazzi (2006) Boselli A., Gavazzi G., 2006, PASP, 118, 517
- Bravo-Alfaro et al. (2000) Bravo-Alfaro et al. H., 2000, AJ, 119, 580
- Bravo-Alfaro et al. (2001) Bravo-Alfaro et al. H., 2001, A&A, 379, 347
- Bureau & Carignan (2002) Bureau M., Carignan C., 2002, AJ, 123, 1316
- Catinella et al. (2010) Catinella et al. B., 2010, MNRAS, 403, 683
- Catinella et al. (2012) Catinella et al. B., 2012, A&A, 544, A65
- Catinella et al. (2013) Catinella et al. B., 2013, MNRAS, 436, 34
- Cavagnolo et al. (2009) Cavagnolo et al. K. W., 2009, ApJS, 182, 12
- Chung et al. (2007) Chung et al. A., 2007, ApJL, 659, L115
- Chung et al. (2009) Chung et al. A., 2009, AJ, 138, 1741
- Cluver et al. (2013) Cluver et al. M. E., 2013, ApJ, 765, 93
- Cortese et al. (2006) Cortese et al. L., 2006, A&A, 453, 847
- Cortese et al. (2008) Cortese et al. L., 2008, MNRAS, 383, 1519
- Cortese et al. (2011) Cortese et al. L., 2011, MNRAS, 415, 1797
- Crowl et al. (2005) Crowl et al. H. H., 2005, AJ, 130, 65
- Cybulski et al. (2014) Cybulski et al. R., 2014, MNRAS
- Dressler (1980) Dressler A., 1980, ApJ, 236, 351
- Ellison et al. (2008) Ellison et al. S. L., 2008, AJ, 135, 1877
- Ellison et al. (2015) Ellison et al. S. L., 2015, MNRAS, 448, 221
- Fabello et al. (2011) Fabello et al. S., 2011, MNRAS, 411, 993
- Fabello et al. (2012) Fabello et al. S., 2012, MNRAS, 427, 2841
- Freeland & Wilcots (2011) Freeland E., Wilcots E., 2011, ApJ, 738, 145
- Fujita (2004) Fujita Y., 2004, PASJ, 56, 29
- Gavazzi et al. (2013) Gavazzi et al. G., 2013, A&A, 553, A89
- Giovanelli et al. (2005) Giovanelli et al. R., 2005, AJ, 130, 2598
- Giovanelli et al. (2007) Giovanelli et al. R., 2007, AJ, 133, 2569
- Gottlöber et al. (2001) Gottlöber S., Klypin A., Kravtsov A. V., 2001, ApJ, 546, 223
- Grcevich & Putman (2009) Grcevich J., Putman M. E., 2009, ApJ, 696, 385
- Grebel et al. (2003) Grebel E. K., Gallagher III J. S., Harbeck D., 2003, AJ, 125, 1926
- Gunn & Gott (1972) Gunn J. E., Gott III J. R., 1972, ApJ, 176, 1
- Haynes & Giovanelli (1986) Haynes M. P., Giovanelli R., 1986, ApJ, 306, 466
- Haynes et al. (1984) Haynes M. P., Giovanelli R., Chincarini G. L., 1984, ARAA, 22, 445
- Haynes et al. (2011) Haynes et al. M. P., 2011, AJ, 142, 170
- Helsdon & Ponman (2000) Helsdon S. F., Ponman T. J., 2000, MNRAS, 315, 356
- Hess & Wilcots (2013) Hess K. M., Wilcots E. M., 2013, AJ, 146, 124
- Hester (2006) Hester J. A., 2006, ApJ, 647, 910
- Hou et al. (2014) Hou A., Parker L. C., Harris W. E., 2014, MNRAS, 442, 406
- Huang et al. (2012) Huang et al. S., 2012, ApJ, 756, 113
- Jaffé et al. (2012) Jaffé et al. Y. L., 2012, ApJL, 756, L28
- Jeltema et al. (2008) Jeltema T. E., Binder B., Mulchaey J. S., 2008, ApJ, 679, 1162
- Kenney et al. (2004) Kenney J. D. P., van Gorkom J. H., Vollmer B., 2004, AJ, 127, 3361
- Kilborn et al. (2009) Kilborn et al. V. A., 2009, MNRAS, 400, 1962
- Larson et al. (1980) Larson R. B., Tinsley B. M., Caldwell C. N., 1980, ApJ, 237, 692
- Łokas & Mamon (2001) Łokas E. L., Mamon G. A., 2001, MNRAS, 321, 155
- Lucero et al. (2005) Lucero D. M., Young L. M., van Gorkom J. H., 2005, AJ, 129, 647
- Mahajan (2013) Mahajan S., 2013, MNRAS, 431, L117
- Maller et al. (2009) Maller et al. A. H., 2009, ApJ, 691, 394
- Marcolini et al. (2003) Marcolini A., Brighenti F., D’Ercole A., 2003, MNRAS, 345, 1329
- Masters et al. (2012) Masters et al. K. L., 2012, MNRAS, 424, 2180
- McCarthy et al. (2008) McCarthy et al. I. G., 2008, MNRAS, 383, 593
- McConnachie et al. (2007) McConnachie et al. A. W., 2007, ApJL, 671, L33
- McGee et al. (2009) McGee et al. S. L., 2009, MNRAS, 400, 937
- Mihos (2004) Mihos J. C., 2004, Clusters of Galaxies: Probes of Cosmological Structure and Galaxy Evolution, p. 277
- Mulchaey (2000) Mulchaey J. S., 2000, ARA&A, 38, 289
- Navarro et al. (1997) Navarro J. F., Frenk C. S., White S. D. M., 1997, ApJ, 490, 493
- Press et al. (1986) Press W. H., Flannery B. P., Teukolsky S. A., 1986, Numerical recipes. The art of scientific computing. Cambridge: University Press, 1986
- Rafieferantsoa et al. (2014) Rafieferantsoa et al. M., 2014, ArXiv e-prints
- Rasmussen et al. (2006) Rasmussen J., Ponman T. J., Mulchaey J. S., 2006, MNRAS, 370, 453
- Rasmussen et al. (2008) Rasmussen et al. J., 2008, MNRAS, 388, 1245
- Rasmussen et al. (2012) Rasmussen et al. J., 2012, ApJ, 747, 31
- Reiprich et al. (2013) Reiprich et al. T. H., 2013, Space Science Reviews, 177, 195
- Roediger (2009) Roediger E., 2009, Astronomische Nachrichten, 330, 888
- Roediger & Brüggen (2007) Roediger E., Brüggen M., 2007, MNRAS, 380, 1399
- Scudder et al. (2012) Scudder et al. J. M., 2012, MNRAS, 426, 549
- Sengupta et al. (2007) Sengupta C., Balasubramanyam R., Dwarakanath K. S., 2007, MNRAS, 378, 137
- Shen et al. (2003) Shen et al. S., 2003, MNRAS, 343, 978
- Solanes et al. (2001) Solanes et al. J. M., 2001, ApJ, 548, 97
- Spergel et al. (2007) Spergel et al. D. N., 2007, ApJS, 170, 377
- Taylor (2005) Taylor M. B., 2005, in Shopbell P., Britton M., Ebert R., eds, Astronomical Data Analysis Software and Systems XIV Vol. 347 of Astronomical Society of the Pacific Conference Series, TOPCAT STIL: Starlink Table/VOTable Processing Software. p. 29
- Taylor et al. (2012) Taylor et al. R., 2012, MNRAS, 423, 787
- Tecce et al. (2010) Tecce et al. T. E., 2010, MNRAS, 408, 2008
- Tonnesen & Bryan (2009) Tonnesen S., Bryan G. L., 2009, ApJ, 694, 789
- Tonnesen & Bryan (2010) Tonnesen S., Bryan G. L., 2010, ApJ, 709, 1203
- Toomre & Toomre (1972) Toomre A., Toomre J., 1972, ApJ, 178, 623
- Toribio et al. (2011) Toribio et al. M. C., 2011, ApJ, 732, 93
- Trinchieri et al. (2012) Trinchieri et al. G., 2012, A&A, 545, A140
- Vollmer et al. (2001) Vollmer et al. B., 2001, ApJ, 561, 708
- Vollmer et al. (2008) Vollmer et al. B., 2008, A&A, 491, 455
- Weinmann et al. (2010) Weinmann et al. S. M., 2010, MNRAS, 406, 2249
- Yang et al. (2005) Yang et al. X., 2005, MNRAS, 356, 1293
- Yang et al. (2007) Yang et al. X., 2007, ApJ, 671, 153
- Yoon et al. (2011) Yoon I., Weinberg M. D., Katz N., 2011, MNRAS, 414, 1625
- Zabludoff & Mulchaey (1998) Zabludoff A. I., Mulchaey J. S., 1998, ApJ, 496, 39
- Zhang et al. (2013) Zhang et al. W., 2013, MNRAS, 429, 2191