First principles thermodynamical modeling of the binodal and spinodal curves in lead chalcogenides
Abstract
High-throughput ab-initio calculations, cluster expansion techniques and thermodynamic modeling have been synergistically combined to characterize the binodal and the spinodal decompositions features in the pseudo-binary lead chalcogenides PbSe-PbTe, PbS-PbTe, and PbS-PbSe. While our results agree with the available experimental data, our consolute temperatures substantially improve with respect to previous computational modeling. The computed phase diagrams corroborate that the formation of spinodal nanostructures causes low thermal conductivities in these alloys. The presented approach, making a rational use of online quantum repositories, can be extended to study thermodynamical and kinetic properties of materials of technological interest.
pacs:
64.75.Qr, 71.15.Nc, 81.30.BxI Introduction
For decades, the physical properties of lead chalcogenides have generated substantial interest in a number of fields, in particular for applications in semiconductor technology. Khokhlov-2003 PbS, PbSe, and PbTe have distinct structural and electronic properties compared to III-V and II-VI compounds. These include high carrier mobilities, narrow band gaps with negative pressure coefficients, high dielectric constants, and a positive temperature coefficient. Adachi-2005 ; Moss-2013 ; Ravich-2013 In addition, PbS, PbSe, and PbTe were predicted to be weak topological insulators, with a band inversion observed at the N point of the distorted body-centered tetragonal Brilllouin zone.curtarolo:art77 These important and varied properties have allowed lead chalcogenides to be used extensively in optoelectronic devices such as lasers and detectors, thermophotovoltaic energy converters, and thermoelectric materials. Alivisatos_science_1996 ; Khokhlov-2003 ; dalven_1973 ; Pei201240 ; Johari20125449 ; Wang20111366
As thermoelectric materials, lead chalcogenides may exhibit electrical conductivities, , in excess of -, thermopowers, , around 150 , and thermal conductivities, , on the order of -. This leads to figures of merit larger than 1 at high temperatures, . Such outstanding performances are due on the details of the electronic structure, Heremans_science_2008 ; Parker201434 ; Parker2010 ; Parker2012 ; Mecholsky-prb-2014 and on the ability to dramatically reduce the thermal conductivity with alloying and nanostructuring. He-jacs-2010 ; Chena-pnsmi-2012 ; Harman-jeml-2005 ; Zhao-jacs-2012 While pure lead chalcogenides are attractive on their own, their alloys are even more interesting. The appeal arises from their mechanical and electronic tunability, which can be optimized for specific technological needs. zaoui_mcp_2009 ; naeemullaha_cms_2014 ; yamini_pccp_2014 For example, the PbTe1-xSex pseudo-binary system has a higher value than its corresponding binary forms. Qzhang_jacs_2012 ; Pei_nature_2011 Thallium doping in PbTe causes changes in the electronic density of states, increasing the value to 1.5 at 773 K. Heremans_science_2008 Similarly, a of 1.3 at 850 K was reported for aluminum doped PbSe. Zhang_ees_2012 Furthermore, Pb9.6Sb0.2Te10-xSbx is known to exhibit lower thermal conductivity and a higher than PbSe1-xTex. poudeu_jacs_2006 This is also true for nanostructured (Pb0.95Sn0.05Te)0.92(PbS)0.08, as the low thermal conductivity leads to a 1.5 at 642 K. Androulakis_jacs_2015 The properties of this group of pseudo-binaries depend greatly on the atomic details of the material’s morphology. This can be partially understood in terms of thermodynamical features. The excellent thermoelectric performances, for example, were tentatively ascribed to the limited miscibility of the components. This gives rise to structural inhomogeneities that lower the thermal conductivity without damaging the electronic transport. Zhao-jacs-2012 Such control over the morphology could be also used to optimize functionalities associated with topological effects.
In this work we study the phase diagram of lead chalcogenide pseudo-binaries. We predict quantitatively the boundary of the solid solution (the binodal curve that defines the region of miscibility), as well as the spinodal region. These features are key for rationalizing and honing synthesis and characterization of optimized systems. To the best of our knowledge, our study is the first to completely and accurately report such characterization. The phase diagram is essential for properly establishing manufacturing processes. There has been only one previous attempt to model phase diagrams of lead chalcogenides using thermodynamic modeling (TM), boukhris_ps_2011 which predicted consolute temperature (Tc) values far from those reported in experimental studies. Liu_MineMag_1994 The disagreement was attributed to the difficulty of an exhaustive exploration of the different configurations for each composition. Here, we built upon the synergy between cluster expansion (CE) techniques, high-throughput (HT) ab initio calculations, curtarolo:art49 ; curtarolo:art53 ; curtarolo:art56 and thermodynamical modeling to find acceptable agreement between our Monte Carlo simulations (MC) and the available experimental results.
II Methodology
II.1 Thermodynamic Modeling
Pseudo-binary systems are represented by the formula (AB)aCc (or AxB1-xC) with mole fractions and of elements A and B respectively, related by +=1. The small letters a and c represent number of sites per formula. saunders_1998 ; hillert_2008 The Gibbs energy of such iso-structural pseudo-binary systems can be written as: saunders_1998 ; hillert_2008
| (1) |
where G and G represent the Gibbs free energy of AaCc and BaCc materials. These two variables can be computed at any temperature by fitting available experimental data Barin to the polynomial form Zhang_ActaMat_2007 shown in Equation (2):
| (2) |
The third term in the Equation (1) is the entropy of mixing, and the last term is the excess energy of mixing that represents the non-ideality of the system. In contrast to the entropic term, the excess energy parameter can take negative or positive values. If LA,B:C is negative, it indicates that the system tends to create a solid solution. A positive value of LA,B:C indicates a repulsive interaction between phases, penalizing formation of intermediate alloys. To find the excess mixing energy, the composition-dependent interaction parameter LA,B:C can be calculated with Equation (3):
| (3) |
The enthalpy of formation, H, is defined as:
| (4) |
where E, E, and E are the total energies of compounds (AB)aCc, AaCc and BaCc, respectively. These energies can be found from the fully relaxed structures using density functional theory (DFT).
A combination of high throughput ab initio calculations and thermodynamic modelling are used to predict the interaction parameter, L. Zhang_ActaMat_2007 ; Sheng_ActaMat_2011 ; SHSheng_ActaMat_2011 The result is a zero temperature approximation of the actual value. The most common method to describe the composition dependent interaction parameter is the Redlich-Kister equation, Redlich_IndsEngChem_1948 ; saunders_1998 ; hillert_2008 where the interaction parameter is written in a polynomial form:
| (5) |
We fit this polynomial to the formation enthalpy data obtained from DFT calculations. We checked that an polynomial is enough to obtain a good fit to the data, so that only L0, L1, and L2 need to be determined:
| (6) |
to compute the interaction parameter.
The Gibbs free energy is composition and temperature dependent. The main computational challenge lies in characterizing many configurations for many compositions. Some authors have attempted to tackle the issue, by generating, few configurations and/or few compositions. boukhris_ps_2011 ; Zhang_ActaMat_2007 ; Sheng_ActaMat_2011 ; SHSheng_ActaMat_2011 Here, we have chosen to challenge the issue more drastically, by reling on the advantages of a hybrid cluster expansion - high throughput approach curtarolo:art81 featuring: exhaustive exploration of different configurations for different compositions (CE), minimization of computational cost by reducing the number of the ab-initio calculations (CE), analysis of many compositions as typical of HT methods curtarolo:art81 ; aflowBZ , and rational use of online repositories (AFLOWLIB.org) aflowlibPAPER .
II.2 Cluster expansion
In the cluster expansion technique, the configurational energy of an alloy as written as a sum of many-body occupation variables : deFontaine_ssp_1994
| (7) |
where , , , etc. are known as effective cluster interactions and must be determined.
The above equation can be rewritten into symmetrically distinct sets of clusters, :
| (8) |
where represents symmetrically equivalent clusters in a given reference volume. burton_cg_2006 The parameters are obtained by fitting a relatively small number of DFT calculated energies.
The reliability of the predicted energy may be determined using the cross-validation score CV:
| (9) |
where ES represents the calculated energies from DFT and Ê${}_{S}$ is the predicted energies from CE.
The enumeration of configurations, calculation of the effective interaction parameters, determination of ground state structures, and prediction of more structures was performed with the Alloy Theoretic Automated Toolkit (ATAT). Walle_calphad_2002 Calculated phase diagrams were obtained with Monte Carlo (MC) simulations performed with code. The algorithm automatically follows a given phase boundary and is provided by the ATAT package. Walle_calphad_2002 ; Walle_jpe_2002 ; Walle_msmse_2002
II.3 High-throughput ab initio calculations
All DFT calculations were carried out by using the Automatic-Flow for Materials Discovery (AFLOW) curtarolo:art65 ; aflowlibPAPER ; curtarolo:art92 and DFT Vienna ab initio simulation program (VASP). kresse_vasp Calculations were performed using AFLOW standards. calderon_2015 We use the projector augmented wave (PAW) pseudopotentials PAW and the exchange and correlation functionals parametrized by the generalized gradient approximation proposed by Perdew-Burke-Ernzerhof. PBE All calculations use a high energy-cutoff, which is 40 larger than the maximum cutoff of all pseudopotentials used. Reciprocal space integration was performed using 8000 more k-points than the number of atoms. Spin-orbit coupling was not treated in the calculations due to its minimal influence in H (smaller than 1.5 meV/atom). Structures were fully relaxed (cell volume and ionic positions) such that the energy difference between two consecutive ionic steps was smaller than eV.
PbS, PbSe and PbTe crystallize in the NaCl structure and belong to the space group (# 225). Space and point group symmetries of intermediate composition structures were determined using AFLOW.
III Results and Discussion
III.1 The PbSe1-xTex alloy
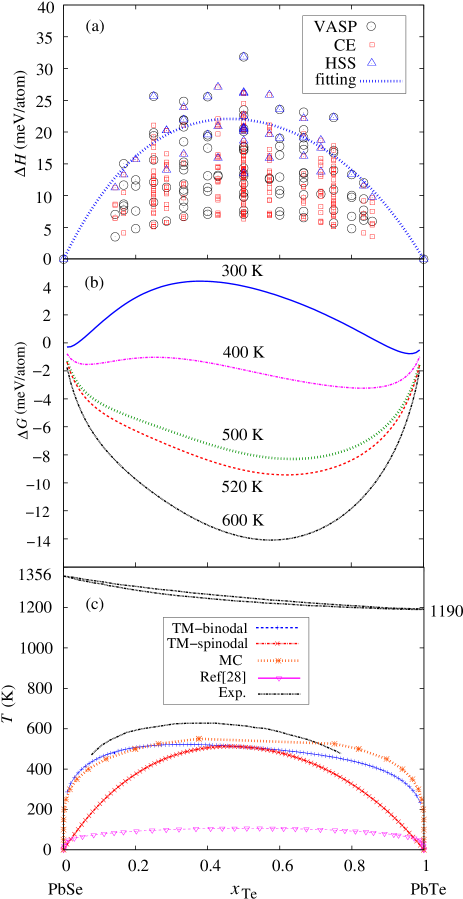
In agreement with experimental data, we found that PbSe and PbTe are immiscible systems at 0 K. This is shown in Figure. 1(a), where formation enthalpies are positive for all compositions (). The CE predicted energies are in excellent agreement with DFT calculated structures, with a cross validation score of 4. Our quantitative results confirm the Hume-Rothery rules. cottrell1967 These rules qualitatively predict the miscibility of two metals based on four properties: atomic radius, crystal lattice, valence and electronegativity. Amongst the chalcogens, the atomic radius changes from 1.04 Å in S, to 1.17 Å in Se, to 1.37 Å in Te. These size variations create a mismatch between the lattice parameters of PbTe and PbSe, causing incoherence in the interface and phase decomposition, eventually. G(x) diagrams at different temperatures are plotted in Figure. 1(b). It can be seen the G function has two minima and a single maximum at low temperatures. At high temperatures close to , it becomes convex, with one minimum.
The binodal curve is defined by the horizontal tangent points of the Gibbs free energy, G. When , the alloy starts decomposing. Additionally, our calculations let us determine the spinodal curve that discriminates metastable and unstable regions in the pseudo-alloy phase diagram. The spinodal curve is the locus of the points where the second derivative of G is equal to 0:
| (10) |
We computed first and second derivatives of the Gibbs free energy within our thermodynamical model. In order to obtain the , , that are necessary to compute at any composition, we use highly symmetric structures (HSS) Ferreira_PRB_2006 ; Marques_PRB_2007 to fit Equation (3). HSS have a larger degeneracy and thus greater weight in the properties of the ensemble; particularly at high temperatures that are close to the spinodal decomposition. After computing the constants, is obtained using Equation (1). The results obtained from the thermodynamic model are compared with our MC results, previous theoretical predictions, boukhris_ps_2011 and experimental data. Liu_MineMag_1994 ; Darrow_JMatSci_1969
Our calculations encompass the entire range of concentrations, and reproduce the asymmetry observed experimentally in the binodal curve. In order to quantitatively compare all data, we analyzed the consolute temperature or upper critical solution temperature () describing the lowest temperature at which both phases are miscible at any composition. Experimentally PbSe1-xTex alloy presents, at , a closer to 623 K. Liu_MineMag_1994 ; Darrow_JMatSci_1969 This quantity is far from the value predicted by Boukhris et al. boukhris_ps_2011 , which is around 106 K. The consolute temperature predicted by our thermodynamic model at 520 K (16.5% error) is around (see Figure.1(c)). Our results quantitatively improve the prediction of Tc with of Boukhris et al. boukhris_ps_2011 Moreover, this value approaches the results obtained by much more expensive techniques such as MC, in which we obtain a value close to 550 K (11.7% error). Discrepancies between MC and TM at larger Te (Se) concentrations arise from difficulties in converging MC calculations in the dilute limit of Se (Te). The experimental miscibility gap presents a slight asymmetric form that is reproduced by MC and our TM. This asymmetry is observed in experiments, but was not seen in previous theoretical work.boukhris_ps_2011 . This phenomenon will be discussed in the next section.
In contrast to the binodal curve, the spinodal curve is quite symmetric. The combination of the symmetric spinodal and asymmetric binodal curves at the Se-rich region causes nucleation at higher temperatures. This information is very important for fine tuning synthesis protocols to obtain the desired morphologies.
III.2 The PbS1-xTex alloy
The atomic radius of Te is 24% larger than the S radius. Thus, the PbS-PbTe system follows the same trend as PbSe-PbTe, and they are immiscible at 0 K.
Our values are greater than 0 eV for the whole range of concentrations (see Figure. 2(a)). CE predicted energies are again in agreement with DFT calculations, obtaining a CV score of about 3. The fitting for is also depicted in Figure. 2(a) using highly symmetric points. Similarly to PbSe-PbTe, the function changes to a convex shape at high temperatures (Figure. 2(b)).
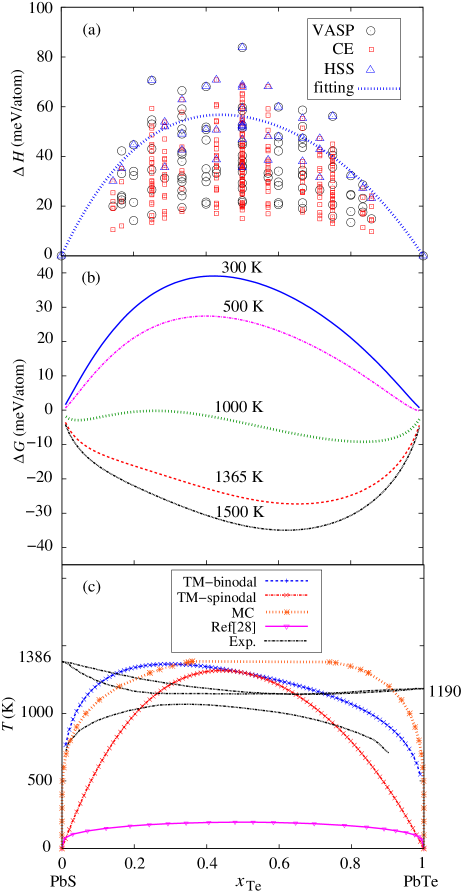
The calculated phase diagram of the PbS1-xTex alloy is shown in Figure. 2(c). Experimental results show again a slight asymmetry with a maximum around . This is in agreement with our results, while MC simulations fail to show this asymmetry. The predicted consolute temperatures for PbS-PbTe follow the same trend as PbSe-PbTe. Results published by Boukhris et al. boukhris_ps_2011 considerably underestimate the experimental value for (1083 K). Our prediction of the consolute temperature is slightly larger than experiments Liu_MineMag_1994 ; being 1385 and 1365 K using MC simulations and TM, respectively. As seen from Figure. 1(c) and Figure. 2(c) PbSe-PbTe and PbS-PbTe systems show a very similar trend of a slightly asymmetric spinodal curve, and considerably asymmetric binodal curve. This trend shows that formation of the Te-rich alloy starts at lower temperatures than Se-rich compositions.
III.3 The PbS1-xSex alloy
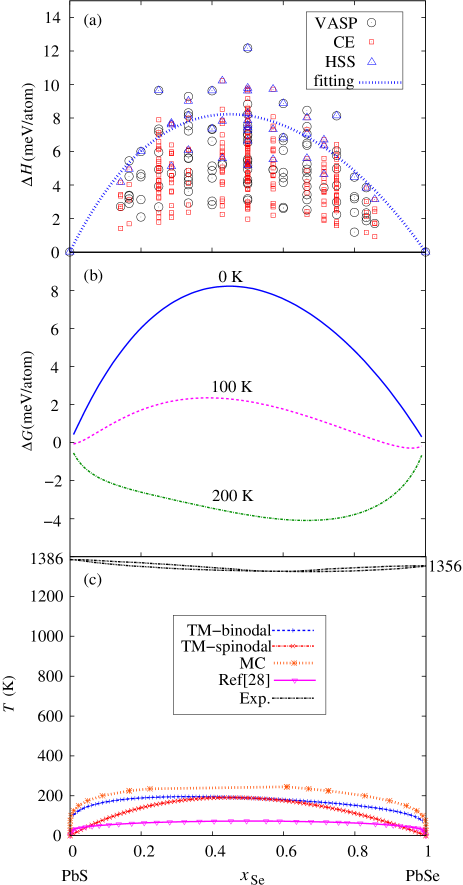
Our methodology was also applied to the PbS-PbSe system. All positive energies in Figure. 3 indicate that PbS and PbSe systems are not miscible at 0 K. As far as we know, there are no experimental data available below 573 K Darrow_JMatSci_1969 for this system. However, it has been shown that MC simulations predict the for different systems quite well, and can describe the miscibility gap. burton_cg_2006 ; burton_jap_2011 For this alloy, thermodynamic modelling predicts a slightly below 200 K and MC predicts a slightly lower than 250 K.
III.4 General considerations
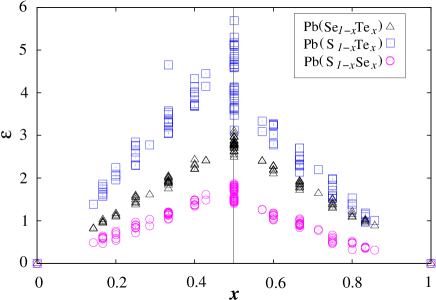
The lattice mismatch between the two solids (PbS, PbSe, or PbTe) is a good descriptor to analyze the trends observed experimentally (see Figure. 4). Lattice mismatch, , is defined as:
| (11) |
where a denotes the lattice constant of intermediate alloys and asolvent is the lattice constant of the most abundant binary alloy. There is a correlation between the lattice mismatch of the alloy, , and the consolute temperature. The higher the mismatch, the higher becomes and thus, a higher is obtained. For instance, the larger mismatch corresponds to the PbS-PbTe system, which presents a maximum enthalpy of formation at , with 80 meV/atom and a of 1083 K. For the PbSe-PbTe system, the maximum H is around 22 meV/atom and the consolute temperature is 623 K. Following this trend, PbS-PbSe system presents a smaller mismatch and a smaller 8 meV/atom. Thus, a consolute temperature smaller than 623 K is expected. If we approximate this correlation to a linear function, for a lattice mismatch around 3% we get a close to 270 K; which is in agreement with MC and our thermodynamic model results.
Mismatch between lattices can be also used to explain the asymmetry of the binodal curves. We can define the asymmetry of the curve as the ratio between the decomposition temperature of two points equidistant to . We have chosen 0.2 and 0.8 to define our asymmetry descriptor, :
| (12) |
Using this definition, we can assume that a perfectly symmetric spinodal curve has =1.
As discussed above, mismatch between lattices is directly related to the magnitude and size of the spinodal curve. Mismatch is the driving force in the three systems we are studying. Thus, we propose a second asymmetry descriptor, , based on the ratio between the lattice mismatch at two points equidistant to :
| (13) |
The asymmetry descriptor values for the three systems are shown in Table 1. shows PbS-PbSe as the most asymmetric spinodal curve, then PbS-PbTe, and finally the PbSe-PbTe system. This trend is exactly the same for , emphasizing the importance of the lattice strain in the of these systems.
| PbSe-PbTe | PbS-PbTe | PbS-PbSe | |
|---|---|---|---|
| 0.86 | 0.80 | 0.80 | |
| 0.84 | 0.59 | 0.49 |
IV Conclusions
A hybrid approach, comprising high-throughput ab-initio and cluster-expansion techniques is used to create a thermodynamic model for calculating binodal and spinodal decompositions in pseudo binary lead chalcogenides (PbSe-PbTe and PbS-PbTe). The model overcomes the limitations of previous theoretical studies, where too few compositions and/or configurations were taken into account. The obtained thermodynamical features are very close to the experimentally data, when available. We also capture the asymmetry of the binodal curve, experimentally observed and previously computationally unresolved. Additionally, phase diagrams for systems without experimental characterization, such as the PbS-PbSe alloy, are suggested. The results have been valitaded by using MC simulations, and lattice mismatch between the binary solids descriptors.
Overall the approach is suitable for the high-throughput characterization of miscibility gaps, spinodal and other decomposition phenomena.
V Acknowledgment
We thank Dr. Allison Sterling and Dr. Cormac Toher for various technical discussions. We would like to acknowledge support by the by DOD-ONR (N00014-13-1-0635, N00014-11- 1-0136, N00014-09-1-0921). The AFLOWLIB consortium would like to acknowledge the Duke University Center for Materials Genomics and the CRAY corporation for computational support.
References
- (1) D. Khokhlov, Lead Chalcogenides: Physics and Applications, Optoelectronic properties of semiconductors and superlattices (Taylor & Francis, Great Britain, 2002).
- (2) S. Adachi, Properties of Group-IV, III-V and II-VI Semiconductors (John Wiley & Sons, England, 2005).
- (3) T. Moss, G. Burrell, and B. Ellis, Semiconductor Opto-Electronics (Butterworth-Heinemann, 2013).
- (4) Y. I. Ravich, Semiconducting Lead Chalcogenides (Springer Science Business Media, New York, 2013).
- (5) K. Yang, W. Setyawan, S. Wang, M. Buongiorno Nardelli, and S. Curtarolo, A search model for topological insulators with high-throughput robustness descriptors, Nat. Mater. 11, 614–619 (2012).
- (6) A. P. Alivisatos, Semiconductor Clusters, Nanocrystals, and Quantum Dots, Science 271, 933–937 (1996).
- (7) R. Dalven, H. Ehrenreich, F. Seitz, and D. Turnbull, Solid State Physics (Academic. Press, New York, 1973).
- (8) Y.-L. Pei and Y. Liu, Electrical and thermal transport properties of Pb-based chalcogenides: PbTe, PbSe, and PbS, J. Alloy. Comp. 514, 40–44 (2012).
- (9) P. Johari and V. B. Shenoy, Tuning the electronic properties of semiconducting transition metal dichalcogenides by applying mechanical strains, ACS Nano 6, 5449–5456 (2012).
- (10) H. Wang, Y. Pei, A. D. Lalonde, and G. J. Snyder, Heavily doped p-type PbSe with high thermoelectric performance: An alternative for PbTe, Adv. Mater. 23, 1366–1370 (2011).
- (11) J. P. Heremans, V. Jovovic, E. S. Toberer, A. Saramat, K. Kurosaki, A. Charoenphakdee, S. Yamanaka, and G. J. Snyder, Enhancement of Thermoelectric Efficiency in PbTe by Distortion of the Electronic Density of States, Science 321, 554–557 (2008).
- (12) D. Parker and D. Singh, High temperature thermoelectric properties of rock-salt structure PbS, Solid State Commun. 182, 34–37 (2014).
- (13) D. Parker and D. Singh, High-temperature thermoelectric performance of heavily doped PbSe, Phys. Rev. B 82, 035204 (2010).
- (14) D. Parker, D. Singh, Q. Zhang, and Z. Ren, Thermoelectric properties of n-type PbSe revisited, J. Appl. Phys. 111, 123701 (2012).
- (15) N. A. Mecholsky, L. Resca, I. L. Pegg, and M. Fornari, Theory of band warping and its effects on thermoelectronic transport properties, Phys. Rev. B 89, 155131 (2014).
- (16) J. He, J. R. Sootsman, S. N. Girard, J.-C. Zheng, J. Wen, Y. Zhu, M. G. Kanatzidis, and V. P. Dravid, On the Origin of Increased Phonon Scattering in Nanostructured PbTe Based Thermoelectric Materials, J. Am. Chem. Soc. 132, 34–37 (2010).
- (17) Z.-G. Chena, G. Hana, L. Yanga, L. Chenga, and J. Zoua, Nanostructured thermoelectric materials: Current research and future challenge, Prog. Nat. Sci. 22, 535–549 (2012).
- (18) T. C. Harman, M. P. Walsh, B. E. Laforge, and G. W. Turner, Nanostructured Thermoelectric Materials, J. Elec. Mater. Lett. 34, L19–L22 (2005).
- (19) L.-D. Zhao, J. He, S. Hao, C.-I. Wu, T. P. Hogan, C. Wolverton, V. P. Dravid, and M. G. Kanatzidis, Raising the thermoelectric performance of p-type PbS with endotaxial nanostructuring and valence-band offset engineering using CdS and ZnS., J. Am. Chem. Soc. 134, 16327–16336 (2012).
- (20) A. Zaoui, S. Kacimi, M. Zaoui, and B. Bouhafs, Theoretical investigation of electronic structure of PbSxTe1-x and PbSexTe1-x, Mater. Chem. Phys. 114, 650–655 (2009).
- (21) Naeemullaha, G. Murtazab, R. Khenatac, N. Hassana, S. Naeemb, M. N. Khalidb, and S. B. Omrand, Structural and optoelectronic properties of PbSxSe1-x, PbSxTe1-x and PbSexTe1-x first-principles calculations, Comp. Mat. Sci. 83, 496–503 (2014).
- (22) S. A. Yamini, H. Wang, Z. M. Gibbs, Y. Pei, S. X. Doua, and G. J. Snyder, Chemical composition tuning in quaternary p-type Pb-chalcogenides – a promising strategy for enhanced thermoelectric performance, Phys. Chem. Chem. Phys. 16, 1835–1840 (2014).
- (23) Q. Zhang, F. Cao, W. Liu, K. Lukas, B. Yu, S. Chen, C. Opeil, D. Broido, G. Chen, and Z. Ren, Heavy Doping and Band Engineering by Potassium to Improve the Thermoelectric Figure of Merit in p-Type PbTe, PbSe, and PbTe1–ySey, J. Am. Chem. Soc. 134, 10031–10038 (2012).
- (24) Y. Pei, X. Shi, A. LaLonde, H. Wang, L. Chen, and G. J. Snyder, Convergence of electronic bands for high performance bulk thermoelectrics, Nature 473, 66–69 (2011).
- (25) Q. Zhang, H. Wang, W. Liu, H. Wang, B. Yu, Q. Zhang, Z. Tian, G. Ni, S. Lee, K. Esfarjani, G. Chen, and Z. Ren, Enhancement of thermoelectric figure-of-merit by resonant states of aluminium doping in lead selenide, Energ. Environ. Sci. 5, 5246–5251 (2012).
- (26) P. F. P. Poudeu, J. D’Angelo, H. Kong, A. Downey, J. L. Short, R. Pcionek, T. P. Hogan, C. Uher, and M. G. Kanatzidis, Nanostructures versus Solid Solutions: Low Lattice Thermal Conductivity and Enhanced Thermoelectric Figure of Merit in Pb9.6Sb0.2Te10-xSex Bulk Materials, J. Am. Chem. Soc. 128, 14347–14355 (2006).
- (27) J. Androulakis, C.-H. Lin, H.-J. Kong, C. Uher, C.-I. Wu, T. Hogan, B. A. Cook, T. Caillat, K. M. Paraskevopoulos, and M. G. Kanatzidis, Spinodal Decomposition and Nucleation and Growth as a Means to Bulk Nanostructured Thermoelectrics: Enhanced Performance in Pb1-xSnxTe-PbS, J. Am. Chem. Soc. 129, 9780–9788 (2007).
- (28) N. Boukhris, H. Meradji, S. Ghemid, S. Drablia, and F. E. H. Hassan, Ab initio study of the structural, electronic and thermodynamic properties of PbSe1-xSx, PbSe1-xTex and PbS1-xTex ternary alloys, Phys. Scripta 83, 065701–065710 (2011).
- (29) H. Liu and L. L. Y. Chang, Phase relation in the system PbS-PbSe-PbTe, Mineral. Mag. 58, 567–578 (1994).
- (30) O. Levy, G. L. W. Hart, and S. Curtarolo, Uncovering compounds by synergy of cluster expansion and high-throughput methods, J. Am. Chem. Soc. 132, 4830–4833 (2010).
- (31) O. Levy, R. V. Chepulskii, G. L. W. Hart, and S. Curtarolo, The New face of Rhodium alloys: revealing ordered structures from first principles, J. Am. Chem. Soc. 132, 833–837 (2010).
- (32) R. H. Taylor, S. Curtarolo, and G. L. W. Hart, Predictions of the Pt8Ti phase in unexpected systems, J. Am. Chem. Soc. 132, 6851–6854 (2010).
- (33) N. Saunders and A. P. Miodownik, CALPHAD: A Comprehensive Guide, Pergamon Materials Series (Elsevier Science, UK, 1998).
- (34) M. Hillert, Phase Equilibria, Phase Diagrams and Phase Transformations (Cambridge University Press, UK, 2008).
- (35) I. Barin, Thermochemical Data of pure substances (VCH, Germany, 1993).
- (36) R. F. Zhang and S. Verpek, Phase stabilities and spinodal decomposition in the Cr1-xAlxN system strudied by ab initio LDA and thermodynamicmodelling: Comparision with the Ti1-xAlxN and TiN/Si3N4 systems, Acta Mater. 55, 4615–4624 (2007).
- (37) S. H. Sheng, R. F. Zhang, and S. Verpek, Phase stabilities and decomposition mechanism in the Zr–Si–N system studied by combined ab initio DFT and thermodynamic calculation, Acta Mater. 59, 297–307 (2011).
- (38) S. H. Sheng, R. F. Zhang, and S. Verpek, Study of spinodal decomposition and formation of nc-Al2O3/ZrO2 nanocomposites by combined ab initio density functional theory and thermodynamic modeling, Acta Mater. 59, 3498–3509 (2011).
- (39) O. Redlich and A. Kister, Algebraic representation of Thermodynamic properties and the classification of solutions, Ind. Eng. Chem. Res. 40, 345–348 (1948).
- (40) S. Curtarolo, G. L. W. Hart, M. Buongiorno Nardelli, N. Mingo, S. Sanvito, and O. Levy, The high-throughput highway to computational materials design, Nat. Mater. 12, 191–201 (2013).
- (41) W. Setyawan and S. Curtarolo, High-throughput electronic band structure calculations: challenges and tools, Comp. Mat. Sci. 49, 299–312 (2010).
- (42) S. Curtarolo, W. Setyawan, S. Wang, J. Xue, K. Yang, R. H. Taylor, L. J. Nelson, G. L. W. Hart, S. Sanvito, M. Buongiorno Nardelli, N. Mingo, and O. Levy, AFLOWLIB.ORG: A distributed materials properties repository from high-throughput ab initio calculations, Comp. Mat. Sci. 58, 227–235 (2012).
- (43) D. de Fontaine, Cluster Approach to Order-Disorder Transformations in Alloys, in Solid State Physics, edited by H. Ehrenreich and D. Turnbull (Wiley, New York, 1994), vol. 47, pp. 33–176.
- (44) B. P. Burton and A. van de Walle, First-principle phase diagram calculations for the system NaCl-KCl: The role of excess vibrational entropy, Chem. Geol. 225, 222–229 (2006).
- (45) A. van de Walle, M. Asta, and G. Ceder, The alloy theoretic automated toolkit: A user guide, Calphad 26, 539–553 (2002).
- (46) A. van de Walle and G. Ceder, Automating First-Principles Phase Diagram Calculations, J. Phase Equilib. 23, 348–359 (2002).
- (47) A. van de Walle and M. Asta, Self-driven lattice-model Monte Carlo simulations of alloy thermodynamic properties and phase diagrams, Model. Simul. Mater. Sc. 10, 521–538 (2002).
- (48) S. Curtarolo, W. Setyawan, G. L. W. Hart, M. Jahnatek, R. V. Chepulskii, R. H. Taylor, S. Wang, J. Xue, K. Yang, O. Levy, M. Mehl, H. T. Stokes, D. O. Demchenko, and D. Morgan, AFLOW: an automatic framework for high-throughput materials discovery, Comp. Mat. Sci. 58, 218–226 (2012).
- (49) R. H. Taylor, F. Rose, C. Toher, O. Levy, K. Yang, M. Buongiorno Nardelli, and S. Curtarolo, A RESTful API for exchanging Materials Data in the AFLOWLIB.org consortium, Comp. Mat. Sci. 93, 178–192 (2014).
- (50) G. Kresse and J. Hafner, Ab initio molecular dynamics for liquid metals, Phys. Rev. B 47, 558–561 (1993).
- (51) C. E. Calderon, J. J. Plata, C. Toher, C. Oses, O. Levy, M. Fornari, A. Natan, M. J. Mehl, G. Hurt, M. B. Nardelli, and S. Curtarolo, The AFLOW Standard for High-Throughput Materials Science Calculations diagrams, Comp. Mat. Sci. 108 Part A, 233–238 (2015).
- (52) P. E. Blöchl, Projector augmented-wave method, Phys. Rev. B 50, 17953–17979 (1994).
- (53) J. P. Perdew, K. Burke, and M. Ernzerhof, Generalized gradient approximation made simple, Phys. Rev. Lett. 77, 3865–3868 (1996).
- (54) A. Cottrell, An introduction to metallurgy (St. Martin’s Press, UK, 1967).
- (55) L. G. Ferreira, M. Marques, and L. K. Teles, Ga1-xAlxN system, Madelung, and strain energies: A strudy on the quality of cluster expansion, Phys. Rev. B 74, 075324–075324 (2006).
- (56) M. Marques, L. K. Teles, and L. G. Ferreira, Influence of miscibility on the energy-gap dispersion in AlxGa1-xN alloys: First-principles calculations, Phys. Rev. B 75, 033201 (2007).
- (57) M. S. Darrow, W. B. White, and R. Roy, Micro-Indentation Hardness Variation as a Function of Composition for Polycrystalline Solution in the Systems PbS/PbTe, PnSe/PbTe, and PbS/PbSe, J. Mater. Sci. 4, 313–319 (1969).
- (58) B. P. Burton, S. Demers, and A. van de Walle, First-principle phase diagram calculations for the wurtzite-structure quasibinary systems SiC-AlN, SiC-GaN and SiC-InN, J. Appl. Phys. 110, 023507 (2011).