A SOFT X-RAY SPECTRAL EPISODE FOR THE CLOCKED BURSTER, GS 182624 AS MEASURED BY Swift AND NuSTAR
Abstract
We report on NuSTAR and Swift observations of a soft state of the neutron star low-mass X-ray binary GS 182624, commonly known as the “clocked” burster. The transition to the soft state was recorded in 2014 June through an increase of the 2–20 keV source intensity measured by MAXI, simultaneous with a decrease of the 15–50 keV intensity measured by Swift/BAT. The episode lasted approximately two months, after which the source returned to its usual hard state. We analyze the broad-band spectrum measured by Swift/XRT and NuSTAR, and estimate the accretion rate during the soft episode to be , within the range of previous observations. However, the best fit spectral model, adopting the double-Comptonization used previously, exhibits significantly softer components. We detect seven type-I X-ray bursts, all significantly weaker (and with shorter rise and decay times) than observed previously. The burst profiles and recurrence times vary significantly, ruling out the regular bursts that are typical for this source. One burst exhibited photospheric radius expansion, and we estimate the source distance as kpc, where parameterizes the possible anisotropy of the burst emission. Interpreting the soft state as a transition from an optically thin inner flow to an optically thick flow passing through a boundary layer, as is commonly observed in similar systems, is contradicted by the lower optical depth measured for the double-Comptonization model we find for this soft state. The effect of a change in disk geometry on the burst behavior remains unclear.
1 Introduction
Type I X-ray bursts arise from unstable thermonuclear burning on the surface of accreting neutron stars (NSs) in low-mass X-ray binaries (LMXBs; see, e.g., Lewin, van Paradijs & Taam, 1993, for a review). While variations in burst properties from source to source, and with time, are explained by changes in the accretion rate and the fuel composition at ignition, a detailed physical understanding of most X-ray burster systems is still lacking. For example, there is no explanation for the decrease in burst rates (leading apparently to a transition to stable burning) that occurs at accretion rates about a factor of ten below the theoretically expected value (see, e.g., Cornelisse et al., 2003; Galloway et al., 2008). The details of the relationship between accretion rate, burning physics, burst morphology, and burst recurrence times are complex and still not understood.
For the majority of burst sources, that accrete a mix of hydrogen and helium from their companion, a general picture of bursting behavior arises with four burning regimes marked by increasing local accretion rate () per NS unit area (see, e.g., Fujimoto et al., 1981; Strohmayer & Bildsten, 2006, for details). As identified in Fujimoto et al. (1981), case 3 burning occurs at low (111Defined as the mass accretion rate, , corresponding to the Eddington luminosity in a NS frame.) accretion rates, and arises from unstable hydrogen ignition in a mixed H/He environment. No example of this type of burning has confidently been observed. At higher accretion rates, corresponding to case 2, steady burning of hydrogen commences, while helium burning is still unstable. However, is low enough that the accreted hydrogen is exhausted at the base of the fuel layer by the time unstable helium ignition is triggered, so case 2 bursts should occur in a He-rich environment, and with relatively long recurrence times. The resulting burst light curves exhibit short ( s) rises and tails ( s), with high peak luminosities typically exceeding the Eddington limit, which generates photospheric radius-expansion. Hence, the ratio, defined as the value, of the persistent fluence between bursts to the burst fluence often exceeds 100. At higher accretion rates (above a few percent of ) the burst recurrence time becomes short enough that hydrogen remains in the base of the fuel layer at ignition, and these case 1 bursts exhibit long profiles characteristic of -decay-mediated hot-CNO burning, and -process tails. The values are consistently lower than in case 2. Finally, at accretion rates , He-burning should stabilise, and no further bursts are expected.
GS 182624 (aka Ginga 1826238, the “clocked” or “textbook” burster; see Ubertini et al., 1999) demonstrates the closest agreement with theoretical model predictions among the over 100-known thermonuclear burst sources222http://burst.sci.monash.edu/wiki/index.php?n=MINBAR.SourceTable. It has exhibited regular bursting behavior with highly consistent properties from burst to burst over the 30 years since its discovery as a new transient (Tanaka et al. 1989). Indeed, using RXTE observations of 24 bursts, Galloway et al. (2004) measured a relationship between persistent X-ray flux and burst recurrence time: the latter decreases almost linearly as the accretion rate increases. This implies that the accreted mass between two bursts is each time completely burned during a burst, and is approximately the same even as the accretion rate changes. The burst light curves and properties of GS 182624 have also been shown to be in good agreement with the predictions of time-dependent Kepler (Weaver et al., 1978) model predictions (see Heger et al., 2007). The observation-model comparisons indicate that the source normally undergoes rapid proton ()-process burning of mixed H/He fuel with approximately solar composition (i.e. Case 1 of Fujimoto et al., 1981).
Subsequent analysis of a more extensive burst sample showed deviations from the previously tight correlation between the flux (measured above 2.5 keV by RXTE) and recurrence time. However, simultaneous Chandra and XMM-Newton observations indicated that these deviations may result from underestimates of the persistent flux arising from a partial redistribution to lower energies, such that the accretion rate–recurrence time relationship remained close to that expected theoretically Thompson et al. (2008).
Due to the absence (so far) of Eddington-limited bursts, the source distance has been constrained in a variety of ways. A lower limit of 4 kpc was estimated from optical measurements (Barret et al., 2000), while the peak flux of sub-Eddington bursts implies an upper limit of 8 kpc (in ’t Zand et al., 1999; Kong et al., 2000). By matching the observed burst profiles with Kepler numerical model predictions, Heger et al. (2007) estimated a distance of kpc, where is the burst emission anisotropy factor. Zamfir et al. (2012) analyzed the same RXTE data as Heger et al. (2007) to establish mass and radius constraints, as well as an upper limit on the distance of kpc. For these constraints (and also for this paper) the convention of Fujimoto (1988) has been adopted, which defines (and the corresponding value for the persistent emission, , which may have a different value) such that the luminosity . Thus, implies that emission is preferentially beamed away from the line of sight, so that the isotropic luminosity implied from the flux measurements is an underestimate.
Since its discovery, GS 182624 has consistently been observed in a persistent “hard” spectral state characterized by a dominant power-law component. Other burst sources are known to switch between hard and soft states, the latter associated with higher accretion rates, which last for days to months, and are accompanied by changes in burst behavior. Due to the pattern described by these sources in an X-ray color-color diagram, these states are known as the “island” and “banana” states (van Paradijs et al., 1988, see also Galloway et al. 2008). In NS-LMXBs, spectral state transitions are thought to involve variations in the accretion flow through a truncated, optically thick and geometrically thin disk. In the low-hard (island) state the accretion disk inner radius is limited by a hot optically thin quasi-isotropic inner flow, while in the high-soft (banana) state, the hot flow vanishes as the disk inner radius extends down to the NS surface, meeting a boundary layer (see Barret, 2001; Done et al., 2007). These changes in accretion flow geometry are related to changes in mass accretion rate, and are thought to affect the burst behavior. As an example, the transient X-ray burster IGR J17473-2721 was observed in outburst in 2008, experiencing a remarkable switch from hard to soft state accompanied by a dramatic change in burst behavior, which demonstrated a hysteresis in the burst rate as a function of persistent bolometric flux (see Chenevez et al., 2011). Another particular effect of the accretion flow on the burst behavior is the interaction, during the soft state, of the boundary layer with the NS atmosphere, which influences the spectral evolution of the burst emission in a way that is not observed during hard state bursts (see Kajava et al., 2014, and references therein).
On 2014 June 8, GS 182624 was detected for the first time in a soft spectral state (Nakahira et al., 2014, see also Asai et al. 2015), which lasted more than two months, according to the long-term monitoring by the MAXI Gas Slit Camera (GSC; Matsuoka et al., 2009) and the Swift Burst Alert Telescope (BAT; Krimm et al., 2013). Here we present analysis of NuSTAR and Swift target-of-opportunity (ToO) observations of GS 182624 triggered in response to this unprecedented episode.
2 Observations and data Analysis
2.1 MAXI
The Monitor of All-sky X-ray Image (MAXI; Matsuoka et al., 2009) has been deployed aboard the International Space Station since August 2009. We use publicly available data333http://maxi.riken.jp/top/index.php?cid=1&jname=J1829-237#lc from MAXI/GSC to examine the long-term 2–20 keV intensity of GS 182624. We converted the observed GSC count-rate to mCrab units adopting for 1 Crab444Equivalent to a flux of erg cm-2 s-1 (2–20 keV)., as obtained from the average GSC count-rate over the same time interval between October 2013–October 2014.
2.2 Swift
We utilize daily averaged 15–50 keV intensity measurements for GS 182624, measured by BAT (Barthelmy et al., 2005) on the Swift satellite (Gehrels et al., 2004) downloaded from the website555http://swift.gsfc.nasa.gov/results/transients/Ginga1826-238/ (Krimm et al., 2013) for this analysis. A long-term light curve was extracted over the same time interval as for the MAXI data. The BAT count-rate was converted to mCrab adopting 1 Crab666Equivalent to a flux of erg cm-2 s-1 (15–50 keV). .
The Swift X-Ray Telescope (XRT; Burrows et al., 2005), which is sensitive to X-ray photons in the 0.2–10 keV band, observed GS 182624 on 2014 June 20 for 1 ks as a follow-up to the report of the soft state (Nakahira et al., 2014). On June 24 we requested a longer ToO observation with the goal of detecting X-ray bursts, obtaining an additional exposure of 17 ks. A third observation was scheduled to coincide with our NuSTAR ToO (see below) on June 27, for 1.5 ks. All these XRT observations (see Table 1 for details) were executed in window timing (WT) mode. The raw data were first reduced using the online XRT products tool (Evans et al., 2009) provided by the Swift team at the University of Leicester777http://www.swift.ac.uk/user_objects/, and with our own analyses, which gave consistent results with the former. Our analyses, which are used in the present paper, were performed with standard software within HEASOFT v6.16 and CALDB files from 2014 June 10.
| Time range | Exposure | No. | ||||
|---|---|---|---|---|---|---|
| Date | MJD | Instr. | Obs. ID | (UT) | (ks) | bursts |
| 2014 June 20 | 56828 | Swift/XRT | 00035342005 | 18:53–-19:10 | 0.982 | |
| 2014 June 24 | 56832 | Swift/XRT | 00035342006 | 14:06–-00:19aaEnd time is on the following day. | 16.65 | 1bbThe peak count-rate of the Swift/XRT burst is count s-1. |
| 2014 June 27 | 56835 | NuSTAR | 80001005002 | 15:36–-23:30 | 13.2 | 1 |
| Swift/XRT | 00080751002 | 22:34-–00:13aaEnd time is on the following day. | 1.501 | |||
| NuSTAR | 80001005003 | 23:30-–22:30aaEnd time is on the following day. | 38.7 | 5 |
2.3 NuSTAR
The Nuclear Spectroscopic Telescope Array (NuSTAR; Harrison et al., 2013) consists of two identical telescopes with a 10 m focal length, focusing X-rays between 3–79 keV using depth-graded multi-layer grazing incidence optics. At the focus of the telescopes are Focal Plane Modules A and B (FPMA and FPMB), each consisting of a grid of four CZT sensors, with 32 32 pixels.
NuSTAR performed a ToO observation of GS 182624 on 2014 June 27 and 28 for a total elapsed time of 108 ks divided into two contiguous datasets with exposures of 13.2 ks and 38.7 ks, respectively (Table 1). The NuSTAR data were reduced using the standard NuSTARDAS pipeline v1.4.1 utilizing CALDB files from 2014 October 20. Images obtained from FPMA and FPMB in each dataset were used to define source and background extraction regions, both situated on the same pixel sensor of the detector. Light curves and spectra of GS 182624 were extracted using the FTOOLS ‘‘nuproducts’’ from a region of radius centered on the source location in each module. Based on the NuSTAR point spread function (PSF), this aperture contains 99% of the source counts. Another circular region of radius centered about from the source was used to measure the sky and instrument backgrounds. The background outside the source extraction region is negligible ( of the source counts) below 30 keV. For analysis of the persistent emission, we subtracted the full-bandwidth background spectrum, extracted over the same time interval as the source spectrum.
2.4 INTEGRAL/JEM-X and RXTE/PCA data from MINBAR
In this paper we utilize preliminary data from the Multi-INstrument Burst ARchive (MINBAR888http://burst.sci.monash.edu/minbar). They consist of analyses of all bursts detected in public RXTE/PCA (Jahoda et al., 2006) and BeppoSAX/WFC (Boella, 1997) data through the whole lifetimes of these missions, as well as all public data from the JEM-X camera (Lund et al., 2003) onboard the INTEGRAL satellite (Winkler et al., 2003), through 2014 December. Analysis products include full-range light curves at 0.25 s (1 s) time resolution, for RXTE (INTEGRAL), as well as time-resolved spectral analyses following the procedures described by Galloway et al. (2008).
2.5 Time-resolved spectral analysis
We extracted time-resolved spectra covering each burst observed with Swift and NuSTAR and carried out spectroscopy on these data as follows. We first defined time bins using full-energy range light curves at 0.25-s time resolution. We subtracted the pre-burst level, and defined time bins forward and backward from the time of peak count-rate such that each bin had approximately the same number of detected counts. For Swift, the aim was 350 counts; for NuSTAR, the aim was 200 counts each in FPMA/B. The shortest time bin for the Swift burst was 3 s; for the NuSTAR bursts, 1 s. Half of the time bins for the NuSTAR bursts were 3 s or shorter. Trial-and-error suggests that shorter bins offer no improvement on the spectral fit parameters.
The NuSTAR burst data were significantly affected by dead time, as is commonly the case when observing bright objects (Harrison et al., 2013). This effect reduces the detected count-rate below that incident on the detectors, and so a correction must be applied (see Bachetti et al., 2015). The most energetic burst (#3; see section 3.2) reached a peak net intensity of approximately 1200 count s-1, which corresponds to almost twice the Crab count-rate (corrected for dead time, PSF, and vignetting). At this intensity, and including the pre-burst (persistent) emission, the dead time fraction was about 0.75. At the median count-rate for all the bins of 200 count s-1, the dead time fraction was 0.4. The high dead time fraction necessitated the time binning described above being performed on the detected counts (rather than the inferred incident count-rate).
We rebinned each spectrum to ensure at least 10 counts per bin. We fit each spectrum with an absorbed blackbody model, with the neutral absorption fixed at (in ’t Zand et al. 1999). For the Swift spectra, we fit in the range 0.3–10 keV and included a systematic error of 3%, as recommended in the Swift CALDB release note #9999http://www.swift.ac.uk/analysis/xrt/files/SWIFT-XRT-CALDB-09_v16.pdf. For the NuSTAR spectra, we assumed no systematic error and fit in the energy range 3–20 keV.
3 Results
We show the long term intensity and spectral state history of GS 182624 in Fig. 1, via the joint MAXI and Swift/BAT light curves, where the times of the NuSTAR and Swift ToO observations are indicated.
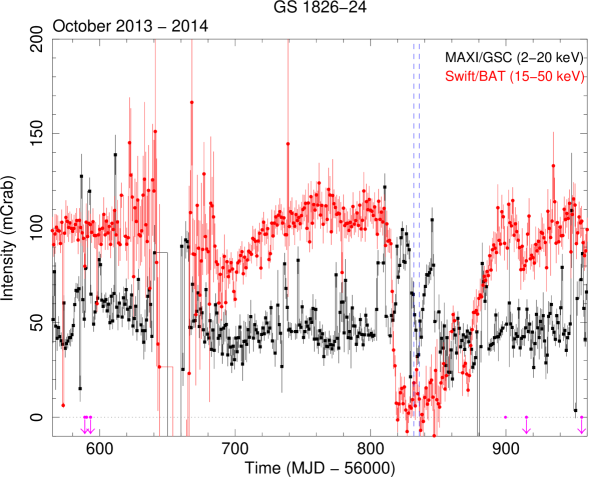
Beginning around MJD 56803 (2014 May 26) the 2–20 keV MAXI/GSC intensity increased over a week-long interval to more than a factor of two higher than the typical value of 45 mCrab. During this excursion, the 15–50 keV Swift/BAT intensity was steady. A closer inspection of the MAXI light curve at the orbital resolution reveals that the flare on MJD 56810 was likely due to an X-ray burst, and a handful more bursts were detected by MAXI all along the source soft state episode. One of these bursts occurred during the time interval covered by our observations, but unfortunately at a time coinciding with one of the NuSTAR orbital data gaps (see §3.2); the other bursts were separated by more than one day from our Swift and NuSTAR observations. The MAXI/GSC daily intensity returned to the pre-flare level by MJD 56814, but one day later began to increase again, this time accompanied by a steep decrease in the Swift/BAT intensity. On MJD 56820 (2014 June 12), the 15–50 keV intensity became below the Swift/BAT detection level, and remained below 20 mCrab for the next 30 days. The 2–20 keV intensity was above the typical level through to MJD 56850, excluding a 5-day interval beginning MJD 56832 (and coinciding with the scheduling of our ToO observations). The 15–50 keV intensity recovered to the typical level of approximately 110 mCrab over a much more extended period of about 50 days. For the sake of completeness 101010At the time of writing this paper, we note that a similar soft episode of GS 182624 was recorded by BAT and MAXI for a duration of about 20 days around 2015 June 3 (MJD 57176), and again from 2015 July 9 (MJD 57212) through August 2015., we note a previous episode in 2013 October-November during which the MAXI daily light curve seems to make a few short excursions to approximately the same level as in 2014 June, although the BAT count-rate did not simultaneously decrease (see also Asai et al., 2015, Fig. 2).
3.1 Persistent emission
We investigated the persistent spectrum using 0.3–10 keV Swift/XRT and 3–78 keV NuSTAR spectra. It appears from the long term MAXI light curve shown in Fig. 1 that our Swift and NuSTAR observations were performed while the 15–50 keV intensity was still suppressed, but the 2–20 keV intensity had temporarily returned to mCrab, roughly consistent with the level prior to the flaring activity.
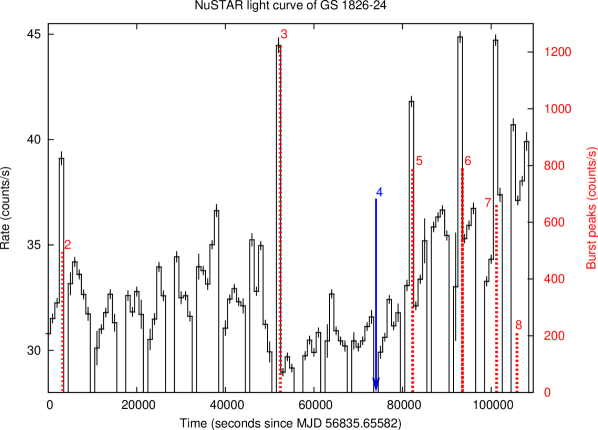
The source intensity light curve obtained with NuSTAR is shown in Fig. 2, where both the variation of the persistent intensity between bursts, and the peak count-rate of six bursts are displayed simultaneously. Burst #3 (see below), which has the highest peak intensity, occurred after the longest separation from the previous event (assuming no burst is missed during the regular data gaps). The persistent count-rate was steady at approximately 32 count s-1 within this interval, dropping slightly to a minimum immediately following the burst, and from this point rising steadily to a level about 30% higher towards the end of the observation.
In order to establish a cross-calibration of Swift/XRT and NuSTAR/FPMA and FPMB (see also Madsen et al., 2015), we first identified all the times of overlap between the observations with the two instruments. There were only two such intervals, between MJD 56835.94105 and 56835.94730 (duration 540 s), and between MJD 56835.99881 and 56836.00189 (duration 266 s). We refer to these two intervals as O1 and O2, respectively. We extracted Swift/XRT spectra from observation 00080751002 over each of these intervals, and NuSTAR/FPMA and FPMB spectra from observations 80001005002 (O1) and 80001005003 (O2).
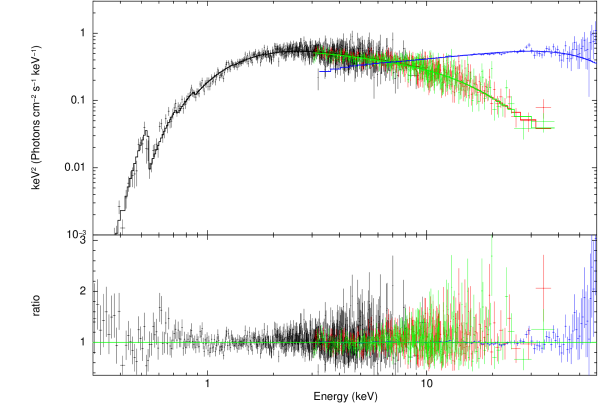
We carried out a joint fit of the spectrum for both intervals O1 and O2 simultaneously in the range 0.3–10 keV (XRT) and 3–40 keV (NuSTAR), with the double Comptonization model adopted by Thompson et al. (2008). We grouped the XRT and NuSTAR spectra to ensure a minimum of 10 counts per bin for XRT, and 30 counts per bin for NuSTAR. No source emission was detected with NuSTAR above 50 keV. We set the neutral absorption along the line of sight with the column density frozen at (in ’t Zand et al., 1999) with updated inter-stellar medium abundances (Xspec tbabs model of Wilms et al. 2000). The composite model consists of two compTT components in Xspec (Arnaud, 1996, and references therein), one with a low electron temperature and high optical depth , and the other with a high and low . The electron temperature for the high- component was effectively unconstrained in the fits, and so we froze this value at 20 keV (as measured by RXTE observations in 2002–3; see Thompson et al., 2008). The resulting fit, with the spectral parameters tied between the two intervals, gave a reduced for 1804 degrees of freedom. The full set of spectral fit parameters are listed in Table 2, and the unfolded spectrum and data-to-model ratio for interval O1 are shown in Figure 3.
Simpler spectral models, such as a single Comptonization component, do not yield acceptable fits for plausible absorption columns. We also included a constant multiplicative factor in order to establish any relative flux offset between the Swift/XRT and NuSTAR instruments. The best-fit value of this parameter was , indicating that the two instruments are consistent within their absolute flux calibration.
As expected based on the Swift/BAT and MAXI light curves, the spectrum measured by Swift and NuSTAR in 2014 June was substantially softer than previous measurements. The electron energy for the softer component ( in Table 2) was about a factor of two lower, while the optical depth was similar. Although we cannot constrain the electron temperature for the second component, with that parameter fixed at roughly the same value observed previously, the optical depth for this, , was less than half the previous value, indicating a spectrum decreasing much more steeply to higher energies. This is illustrated by the comparison with the most recent RXTE observation, on MJD 55683.59171, of 10.126 ks duration, with the Proportional Counter Units (PCUs) 1,2,4 active (Fig. 3). At that time the hardness ratio of Swift/BAT to MAXI intensities was , compared to the corresponding value in 2014 June of .
We then applied the double Comptonization model to each of the inter-burst intervals for bursts #2–8 (see 3.2). For the interval between bursts 2 and 3, which spans the two NuSTAR observations, we extracted for simplicity a spectrum only from observation 8001005003, because the average count-rate was about the same; this covers 6.81 hr of the total (13.636 hr) separation. We fitted these spectra simultaneously with the double Comptonization model, and experimented by trial-and-error, allowing different combinations of parameters to vary between the intervals. We first freed each of the Comptonization normalizations, and found that freeing only one additional parameter, , was sufficient to obtain an adequate fit overall, with () for 4806 DOF (Table 2). We used the cflux convolution model component in Xspec to measure the unabsorbed model flux within each interval in the 3–25 keV energy range.
As is customary, we used an “ideal” response to extrapolate the best-fitting spectral model outside the instrument bandpass to the range 0.1–1000 keV, and adopted this as the bolometric flux (see also Thompson et al., 2008). Unlike the previous study by Thompson et al. (2008), for which the correction to the bolometric flux based on the absorption was approximately 5%, the spectrum during the 2014 June observations was so soft that the correction was closer to 35%. We estimate the average unabsorbed bolometric flux (for comparison to the results of Thompson et al., 2008) at erg cm-2 s-1.
| Double Comptonization model | IntervalaaTime interval between bursts #i and #i+1. | |||||||
|---|---|---|---|---|---|---|---|---|
| Parameter | Units | O1 & O2 | – | – | – | – | – | – |
| ————————————————————– (4.0) ————————————————————– | ||||||||
| keV | ———————————————— ————————————————— | |||||||
| keV | ———————————————— —————————————————— | |||||||
| ———————————————— —————————————————— | ||||||||
| keV | ———————————————— —————————————————– | |||||||
| keV | ————————————————————– (20) ————————————————————– | |||||||
| (DOF) | 1.011 (1804) | ——————————————— 1.0181 (5650) ———————————————— | ||||||
| Absorbed flux (3–25 keV) | ||||||||
| Unabsorbed fluxbbExtrapolated, assuming an ideal response. The flux is calculated as the mean of the fluxes for the models over each of the Swift/XRT and NuSTAR spectra, and the uncertainty is calculated as the standard deviation. (0.1–1000 keV) | ||||||||
3.2 Thermonuclear bursts
We detected seven type-I (thermonuclear) bursts during our ToO observations in 2014 June, the first by Swift on MJD 56832.99124, and the remaining six detected by NuSTAR as shown in Fig. 2. As mentioned above, one more burst appears in the MAXI orbital light curve at (M. Serino; private communication). We do not have more detailed data for this burst, but we note that its time coincides with a NuSTAR orbital data gap. We number these bursts #1 to 8 based on their chronological order (see also Table 3).
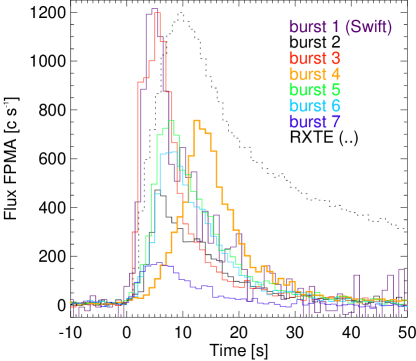
The bursts we observed were significantly shorter than previous bursts, as determined by the duration over which the count-rate exceed 25% of the maximum. The typical timescales are s (see Table 3), compared to s for the RXTE bursts in the MINBAR sample (Fig. 4). We fitted a one-sided Gaussian to the rising part of each burst and translated the standard deviation to the time it takes the Gaussian to rise from 25% to 90% of the peak value (corresponding to 1.206 times the standard deviation; see also Galloway et al., 2008). We observed considerable diversity among the NuSTAR bursts, both in burst rise time (in the range 2–12 s) and peak intensity (a range of a factor of 8). This inconsistency between successive bursts is also atypical for this source (e.g. Galloway et al., 2004). The brightest NuSTAR burst exhibited the shortest rise time, of 2 s. The last burst observed (#8) was also the weakest, and occurred after the shortest recurrence time ever observed in this source (see below). The rise time for this burst (and also burst #5) was similar to the decay time, so that the burst was almost symmetric in profile.
The shortest separation between any observed burst pair was between the last two bursts observed by NuSTAR, #7 and 8 in Table 3. These events were observed on MJD 56836.82851 and 56836.88213, respectively, with a separation of 1.287 hr. Previously, GS 182624 has exhibited consistently regular bursts, so we tested whether the bursts observed in 2014 June were consistent with a regular recurrence time. The separations of the previous three pairs, at 2.1, 3.179 and 2.082 hr, respectively, are not consistent with the separation for the final pair, nor any integer multiple, as expected if bursts were missed in data gaps. However, the final burst observed with NuSTAR was much weaker in both fluence and peak flux (see Table 3) than the other bursts in the same observation, so we consider the possibility that the final burst was the second (or third) component of a so-called “short-recurrence time burst”, groups of up to four events seen in most sources accreting mixed H/He fuel (Keek et al., 2010). Although 1.287 hr is beyond the usual range of delays seen for such events, it is possible the last burst followed more closely another event which fell in the data gap which ended just 7.81 min earlier. In that case, we should discount the final burst, and consider only the four previous ones (including the MAXI burst). The separation between the successive pairs of bursts were related in approximately a 3:2 ratio, suggesting that the bursts were occurring regularly every 1.05 hr. However, if that were the case, the expected time of one of the missing bursts between the observed events #5 and 6 fell in the middle of an observation interval in which no bursts were observed. Thus, we can rule out regular bursting during the time interval covered by our observations at high confidence.
| Burst | Start time | Rise timeaaMeasured from the count-rate burst light curve from 25% to 90% of the peak value in the relevant energy band. | TimescaleaaMeasured from the count-rate burst light curve from 25% to 90% of the peak value in the relevant energy band. | ||||||
|---|---|---|---|---|---|---|---|---|---|
| no. | Instr. | Obs. ID | (MJD) | (hr) | (s) | (s) | Peak fluxbbExtrapolated peak bolometric flux in units of erg cm-2 s-1. | FluenceccIntegrated burst bolometric fluence in units of erg cm-2. | ddAs every burst interval was interrupted by at least one data gap, the -values must formally be considered upper limits. |
| 1 | Swift/XRT | 00035342006 | 56832.99124 | ||||||
| 2 | NuSTAR | 80001005002 | 56835.69484 | 64.89 | |||||
| 3 | NuSTAR | 80001005003 | 56836.26299 | 13.636 | |||||
| 4 | MAXI | 56836.5224eeThis burst is recorded from the public MAXI orbital light curve. | |||||||
| 5 | NuSTAR | 80001005003 | 56836.60928 | ||||||
| 6 | NuSTAR | 80001005003 | 56836.74176 | 3.179 | |||||
| 7 | NuSTAR | 80001005003 | 56836.82851 | 2.082 | |||||
| 8 | NuSTAR | 80001005003 | 56836.88213 | 1.287 |
3.3 Burst energetics and spectral variations
We carried out time-resolved spectral analysis as described in §2.5. We found an adequate fit to each time-resolved net burst spectrum (with the pre-burst emission subtracted as background) using an absorbed blackbody model. The resulting distribution of reduced values is shown in Fig. 5. The maximum value for any of the fits was 1.34; this is consistent with expectations for a good fit given the number of degrees of freedom. We list the burst spectral parameters in Table 3.

Figure 6 shows time-resolved spectroscopic results for the Swift and NuSTAR bursts. The time-resolved spectroscopic analysis of the brightest burst, #3, indicates the characteristic evolution of a photospheric radius expansion (PRE) burst, with a local maximum observed in the blackbody normalization at the same time as a minimum in the blackbody temperature (Fig. 6b). The presence of PRE in other sources is strongly correlated with the source being in a soft state Muno et al. (2004).
The peak flux reached during this burst was erg cm-2 s-1. This value is a factor of 1.42 higher than the mean peak flux of the non-PRE bursts observed by RXTE since 2000, of erg cm-2 s-1, and a factor of 1.24 higher than the peak flux of the brightest burst yet observed from the source: erg cm-2 s-1as qutoed from the MINBAR database.


We integrated over the measured fluxes to give the fluence for each burst, and computed the burst timescale as the ratio of the fluence to peak flux, i.e. . A measure of burst energetics is given by , the ratio of persistent and burst fluences (e.g. Lewin & Joss, 1983). In this expression for , and are the average bolometric persistent flux and the waiting time since the last preceding burst, respectively. We use the MAXI burst so as to better constrain the -value of the following NuSTAR burst (#5), although this is obtained with a relatively high uncertainty due to the approximate knowledge of the time of the MAXI burst.
4 Discussion
The 2014 June soft spectral state of GS 182624 was the first ever recorded for this well-studied source, and it revealed a number of new observational features, including the first burst exhibiting photospheric radius expansion, and weak, irregular bursting behavior, including the shortest burst interval ( hr) measured to date.
4.1 The source distance
The brightest burst observed with NuSTAR, #3, exhibited spectral evolution consistent with PRE, thought to indicate the burst flux reaching the Eddington limit. Assuming the peak flux corresponds to the Eddington luminosity for an atmosphere with solar composition, and taking into account the effects of gravitational redshift at the surface of a , 10 km radius neutron star (e.g. Galloway et al., 2008) the inferred distance is kpc, where represents the possible anisotropy of the burst emission (see §4.3). In at least one other system, 4U 1636536, which is thought to accrete mixed H/He fuel as assumed for GS 182624 (see Bildsten, 2000; Galloway et al., 2004), the effective Eddington limit is thought to be instead the higher limit appropriate for a pure He atmosphere Galloway et al. (2006). If we instead adopt that value, the implied distance is kpc. Further, Kuulkers et al. (2003) measured the Eddington luminosity for a group of LMXBs with independently known distances from their globular cluster host as erg s-1. Based on this value the implied distance is kpc.
These larger distances are problematic for several reasons. First, the non-PRE bursts observed previously reach an average maximum flux only a factor of 1.42 lower than burst #3, implying that the non-PRE bursts exceed the Eddington limit for mixed H/He fuel. This also seems to be the case for 4U 1636536, which infrequently shows PRE bursts consistent with the H/He limit Galloway et al. (2006). However, for GS 182624 the He-derived distances also exceed the upper limit of kpc derived from comparing the non-PRE burst light curves to Kepler numerical model predictions (Zamfir et al., 2012). Thus, though we cannot absolutely rule out other possibilities, we adopt a distance of kpc as this is the only one that satisfies the constraints obtained by Zamfir et al. (2012), and we conclude that the effective Eddington limit for GS 182624 is for mixed H/He fuel.
4.2 The persistent spectral state
Since previous observations of GS 182624 have consistently found the source in the hard (island) spectral state, we discuss here to what extent the 2014 June observation is distinct from that state. Extensive previous RXTE observations of other “atoll” class LMXBs (so named because of their characteristic pattern in X-ray color-color diagrams) find that the hard and soft X-ray colors (defined as the ratio of counts between pairs of energy bands – for RXTE, the energy bands used were 8.6–18.0 and 5.0–8.6 keV for the hard color, and 3.6–5.0 and 2.2–3.6 keV for the soft color) of these sources define an arc or a Z-shaped track (e.g. Galloway et al., 2008). Unfortunately, because GS 182624 was never observed by RXTE to go into a soft state, it’s color-color diagram is not well defined, and instead all observations cluster around a soft color value of , and hard color . These values, extracted from the catalog of RXTE observations of Galloway et al. (2008), are corrected for the PCA gain, which varied over the mission; the corresponding values prior to the gain correction for the epoch closest to the end of the mission would be 15% lower in soft color, and 4% higher in hard.
We estimated the corresponding colors for the 2014 June observation in the same energy bands used for the RXTE analysis, and for the most recent gain epoch. We created a simulated persistent spectrum in Xspec, adopting the best-fit spectral model with a response calculated for a late-epoch RXTE observation. The estimated PCA colors for the source in 2014 June are 1.189 (0.476) for soft (hard) color. In other atoll sources, a significant decrease in both soft and hard color is associated with a transition to the “banana” or soft spectral state. Although it is impossible to be certain in the absence of a well populated color-color diagram for GS 182624, the spectral measurements strongly support a state transition similar to that seen in other atoll sources. Furthermore, although the higher accretion rate that might be implied by the spectral state transition is not supported by the estimate of the bolometric flux, such discrepancies are also well-known in other atoll sources (see e.g. Fig. 6 of Galloway et al., 2008).
For other atoll sources, the soft “banana” persistent spectral state is usually interpreted as indicating a higher accretion rate, and naïvely, the higher average burst rate for GS 182624 during 2014 June would seem to support this interpretation. However, the inferred bolometric persistent flux level of erg cm-2 s-1 is in fact in the middle of the range of bolometric fluxes that the source has been observed at historically (e.g. Thompson et al., 2008). Thus, we find no evidence to support a markedly different accretion rate, unless the radiative efficiency (or perhaps the persistent emission anisotropy) has changed markedly. The Swift and NuSTAR observations fell between two much higher peaks of the MAXI light curve (Fig. 1); it seems likely that the source could have been up to a factor of two brighter still in the soft state, just a few days before or after.
We note that Ji et al. (2014) report the diminution of the hard X-ray persistent emission during GS 182624 bursts observed by RXTE. These authors explain such hard X-ray shortages as due to the cooling of the hot corona by the soft X-ray burst photons (see also Ji et al., 2015). We tested for similar variation in the hard X-ray emission during the six bursts observed by NuSTAR, but the source intensity above 30 keV was persistently so weak (only a few counts/s) that we could not find any significant variation. This may be consistent with Ji et al. (2014) results, as our observations occurred when GS 182624 was in a soft state during which a negligible corona or hot accretion flow is supposed to be present.
4.3 The bursting regime
GS 182624 has so far been characterized by consistently regular s long bursts recurring at approximately periodic intervals between 3.56 and 5.74 hr, varying inversely as an almost linear function of the source persistent flux (Galloway et al., 2004). Apart from the burst detected by MAXI on MJD 56810 (see §3), we found no observations in the few weeks preceding or succeeding the soft episode. However, JEM-X detected two bursts before the soft spectral episode, in 2013 October 23 and 28 (MJD 56588 and 56593), and afterwards, on 2014 September 15 and October 25 (MJD 56915 and 56955), respectively. As shown in Fig. 1, the four JEM-X bursts occurred while the source spectral state was rather stable, with the (BAT / MAXI) hardness ratio consistently about ). All four bursts before and after 2014 June show similar shapes and durations as other bursts from GS 182624 previously observed with JEM-X in the 3–25 keV energy range, i.e. longer rise times (from 6 to 9 s) and timescales (between 40 and 60 s). While it is not possible to infer the burst rate with such widely separated burst detections, the long burst timescales and characteristically hard persistent spectral state strongly suggests that GS 182624 was exhibiting its normal burst behavior up to 2014 June, and following.
Based on previous measurements (Thompson et al., 2008), at the flux level seen in 2014 June we would expect regular, consistent bursts at a recurrence time of hr, and with –40. Instead, we found much weaker, inhomogeneous bursts, with fluences at most one third of the typical value measured in the past, and correspondingly higher -values. Given the lack of regularity in the bursting, and the presence of gaps between each of the burst pairs, the measured -values must be considered upper limits only, so we cannot rule out lower values, consistent with the usual mixed H/He burning. However, we can determine a lower limit on the amount of H in the burst, based on the assumption that all the accreted fuel is burned during the burst:
| (1) |
(note that the expression in Galloway et al. 2008 omits the redshift factor) where , are the mass and radius of the neutron star, is the surface gravitational redshift, and MeV nucleon-1, where is the hydrogen fraction averaged over the burning layer.
The ratio between anisotropy for the persistent and burst emissions that appears in Eq. 1 has been estimated as 1.55 for GS 182624 Heger et al. (2007). The modeling of Fujimoto (1988) suggests that a system inclination of is required to give this value of the relative anisotropies, and further implies that and . These values indicate that both the burst and persistent flux are preferentially beamed away from our line of sight, and the inferred isotropic luminosities will underestimate the true values. The combined effect on the measured -values will be to underestimate the true value by a factor of 1.55.
Due to the data gaps falling between each pair of bursts detected by NuSTAR, each of the measurements in Table 3 is an upper limit on the true value. The most constraining value should be the minimum, which is obtained for burst #5, although with relatively large uncertainty due to the lack of absolutely exact timing of the MAXI burst. The estimated , with the uncertainty dominated by the separation from the MAXI burst, of hr. The corresponding value of , assuming the range of gravitational redshift –1.28 estimated by Zamfir et al. (2012), would be in the range 2.8–3.0 MeV nucleon-1, implying in turn a hydrogen mass fraction at ignition of –0.35. We further note that, while low values of may arise from steady hydrogen burning prior to the burst, there has been insufficient time to reduce it to this degree. Indeed, assuming solar CNO metallicity , the time to burn all the hydrogen at the base of the layer is
| (2) |
where is the accreted H-fraction (e.g Galloway et al., 2004). For solar accreted composition, there is insufficient time between bursts to reduce the average H-fraction in the fuel layer to explain the -value of burst #5.
Another way to understand the discrepancy is by considering the column depth of material ignited during each burst, given by:
| (4) | |||||
again assuming implicitly that all the accreted fuel is burned in the burst. We set the value of based on the assumed average fuel composition resulting from hot-CNO burning between the bursts, i.e. (with the factor 0.5 arising because the burning takes place at the base, and we average over the entire column). We compare this with the column depth accreted between two bursts separated by a time interval , which is , where is the mass accretion rate per surface area on the NS. Given the estimated bolometric persistent flux of (2.4– erg cm-2 s-1, and the inferred anisotropy factor, we estimate the accretion rate at 12–15% of the Eddington rate (at a distance of 5.7 kpc). This accretion rate is in the range expected for Case 1 burning of Fujimoto et al. (1981), corresponding to mixed H/He burning triggered by thermally unstable helium ignition. Assuming that the nuclear burning is completely conservative, one would expect to be close to . Instead, we find that consistently underestimates , even for the relatively close pairs of bursts (Fig. 7).
We infer that the assumption of conservative burning (i.e. that all accreted fuel is burned during the bursts) cannot be reconciled with the data, implying that some other process is reducing the available fuel prior to ignition. This burning appears to preferentially removing hydrogen, based on the short burst timescales and since the reduction is in excess of the normal steady hot-CNO burning.

We conclude that GS 182624 bursts inefficiently in the soft state, and igniting fuel with significantly lower hydrogen fractions than the previously inferred solar value. The burst intervals are too short for the lower H-fractions to arise purely by hot-CNO burning between the bursts, unless the CNO metallicity is of order ten times solar. Steady burning of accreted fuel in addition to hot-CNO burning would explain both the relative inefficiency of the thermonuclear bursts, and would also provide an extra fuel source to explain the relatively low ignition columns.
The results of our spectral analysis of the persistent emission compared to previous observations indicate a softening, but at a similar inferred accretion rate. Such a softening of the spectrum would normally be explained by a transition from the usual truncated accretion disk, with optically thin inner flow, to an optically thick flow passing through a boundary layer, as is commonly observed in other LMXBs (see, e.g., Barret & Olive, 2002). However, for GS 182624 in 2014 June, this transition is not supported by the data, since the optical depths , for both components are lower than in the hard state. Some caution is required in interpreting these parameters alone, as they are strongly anticorrelated with the corresponding electron temperatures , , and we fix the latter at 20 keV. Since the evidence for increased mass accretion rate is weak, we further attribute the markedly different burst behavior, also to the change in disk geometry. Although it is presently not understood precisely how the disk geometry can affect the burst behavior, the manifestly different burst properties in the soft state has been observed in several other sources (e.g. Cornelisse et al., 2003), and this interaction is increasingly being explored in the literature (see, e.g., Worpel et al., 2013; Kajava et al., 2014; Ji et al., 2015), also in the hard state (see, e.g., in ’t Zand et al., 2012, 2013).
5 Acknowledgements
JC would like to thank Niels Jørgen Westergaard for useful discussions. JC acknowledges financial support from ESA/PRODEX Nr. 90057. PR acknowledges financial contribution from contract ASI-INAF I/004/11/0 and ASI-INAF I/037/12/0. This work made use of data from the NuSTAR mission, a project led by the California Institute of Technology, managed by the Jet Propulsion Laboratory, and funded by the National Aeronautics and Space Administration. We thank the NuSTAR and Swift Operations teams for executing the ToO observations, and the Software and Calibration teams for analysis support. This research has used the NuSTAR Data Analysis Software (NuSTARDAS) jointly developed by the ASI Science Data Center (ASDC, Italy) and the California Institute of Technology (USA). The MAXI data are provided by RIKEN, JAXA and the MAXI team. Swift/BAT transient monitor results are provided by the Swift/BAT team. This work made use of data supplied by the UK Swift Science Data Centre at the University of Leicester. This paper utilizes preliminary analysis results from the Multi-INstrument Burst ARchive (MINBAR), which is supported under the Australian Academy of Science’s Scientific Visits to Europe program, and the Australian Research Council’s Discovery Projects and Future Fellowship funding schemes.
Facilities: NuSTAR, Swift, MAXI
©2014. All rights reserved.
References
- Arnaud (1996) Arnaud, K. A. 1996, in Jacoby G.H., & Barnes J., eds, Astronomical Data Analysis Software and Systems V. ASP Conf. Series 101, p. 17
- Asai et al. (2015) Asai, K., et al., 2015, ArXiv:1506.01896
- Bachetti et al. (2015) Bachetti, M., Harisson, F.A., Cook, R., et al., 2015, ApJ 800, 109
- Barret et al. (2000) Barret, D., Olive, J. F., Boirin, L., et al. 2000, ApJ 533, 329
- Barret (2001) Barret, D. 2001, AdSpR 28, 307
- Barret & Olive (2002) Barret, D. & Olive, J. F. 2002, ApJ 576, 391
- Barthelmy et al. (2005) Barthelmy, S.D., et al. 2005, Space Sci. Rev., 120., 143
- Bildsten (2000) Bildsten, L., 2000, in AIP Conf. 522, Cosmic Explosions, ed S. Holt & W. Zhang (woodbury NY; AIP), 539
- Boella (1997) Boella, G., Butler, R.C., Perola, G.C., et al. 1997, A&AS 122, 299
- Burrows et al. (2005) Burrows, D.N., et al. 2005, Space Sci. Rev. 120., 165
- Chenevez et al. (2011) Chenevez, J., Altamirano, D., Galloway, D., et al. 2011, MNRAS 410, 179
- Cornelisse et al. (2003) Cornelisse, R., in ’t Zand, J., Verbunt, F., et al. 2003, A&A 405, 1033
- Done et al. (2007) Done, C., Gierliński, M., & Kunota, A. 2007, A&A Rev. 15, 1
- Evans et al. (2009) Evans P.A., Beardmore A.P., Page K.L., et al. 2009, MNRAS 397, 1177
- Fujimoto et al. (1981) Fujimoto M.Y., Hanawa T., and Miyaji S. 1981, ApJ 247, 267
- Fujimoto (1988) Fujimoto, M. Y. 1988, ApJ, 324, 995
- Galloway et al. (2004) Galloway D.K., Cumming A., Kuulkers E., et al. 2004, ApJ 601, 466
- Galloway et al. (2006) Galloway D.K., Psaltis D., Muno M.P., Chakrabarty D. 2006, ApJ, 639, 1033
- Galloway et al. (2008) Galloway D.K., Muno M.P., Hartman J.M, et al. 2008, ApJS 179, 360
- Gehrels et al. (2004) Gehrels N., et al. 2004, ApJ 611, 1005
- Harrison et al. (2013) Harrison F.A., Craig W., Christensen F., et al. 2013, ApJ 770, 103
- Heger et al. (2007) Heger, A., Cumming, A., Galloway, D., & Woosley, S.E. 2007, ApJ 671, L141
- in ’t Zand et al. (1998) in ’t Zand, J.J.M., Bazzano, A., Cocchi, M., et al. 1998, IAU Circ. 6846
- in ’t Zand et al. (1999) in ’t Zand J.J.M., Heise J., Kuulkers E., Bazzano A., et al. 1999, A&A 347, 891
- in ’t Zand et al. (2012) in ’t Zand, J.J.M., Homan, J., Keek, L., Palmer, D.M. 2012, A&A 547, 47
- in ’t Zand et al. (2013) in ’t Zand, Galloway, D.K., Marshall, H.L., et al. 2013, A&A 553, 83
- Jahoda et al. (2006) Jahoda, K., et al. 2006, ApJS 163, 401
- Ji et al. (2014) Ji, L., et al. 2014, ApJ 782, 40
- Ji et al. (2015) Ji, L., et al. 2015, ArXiv:1504.08094
- Kajava et al. (2014) Kajava, J., et al. 2009, MNRAS 445, 4218
- Keek et al. (2010) Keek L., Galloway D., in ’t Zand J., et al. 2010, ApJ 718, 292
- Kong et al. (2000) Kong, A.K.H., Homer, L., Kuulkers E., et al. 2000, MNRAS 311, 405
- Krimm et al. (2013) Krimm, H.A., et al. 2013, ApJSS 209, 14
- Kuulkers et al. (2003) Kuulkers, E., et al. 2003, A&A 399, 663
- Lewin & Joss (1983) Lewin W.H.G. & Joss P.C., in Accretion-Driven Stellar X-ray Sources, eds. W. H. G. Lewin &E. P., J., van den Heuvel, 1983, (Cambridge Univ. Press)
- Lewin, van Paradijs & Taam (1993) Lewin W.H.G., van Paradijs J. & Taam R. 1993, Space Science Reviews 62, 223
- Lund et al. (2003) Lund N., et al. 2003, A&A, 411, L231
- Madsen et al. (2015) Madsen K., Reynolds S., Harisson F.A., et al. 2015, ApJ 801, 66
- Matsuoka et al. (2009) Matsuoka, M., Kawasaki, K., Ueno, S. et al. 2009, PASJ 61, 999
- Muno et al. (2004) Muno, M. P., Galloway, D. K., & Chakrabarty, D. 2004, ApJ, 608, 930
- Nakahira et al. (2014) Nakahira, S., et al. 2014, ATel 6250
- Strohmayer & Bildsten (2006) Strohmayer, T.E.,& Bildsten, L. 2006, in Compact stellar X-ray sources, ed. W.H.G. Lewin & M. van der Klis, (Cambridge: Cambridge University Press), (arXiv:astro-ph/0301544)
- Tanaka (1989) Tanaka, Y., 1989, in Proc. 23rd ESLAB Symp. Two Topics in X-ray Astronomy, ed. J. Hunt & B. Battrick (SP-296; Noordwijk; ESA)
- Thompson et al. (2008) Thompson, T., Galloway, D., Rothschild, R., Homer, L. 2008, ApJ 681, 506
- Ubertini et al. (1999) Ubertini, P., Bazzano, A., Cocchi, M., et al. 1999, ApJ 514, L27
- van Paradijs et al. (1988) van Paradijs, J., Penninx, W., and Lewin, W.H.G. 1988, MNRAS 233, 437
- Weaver et al. (1978) Weaver, T.A., Zimmerman, G.B., & Woosley, S.E 1978, ApJ 225, 1021
- Wilms et al. (2000) Wilms, J., Allen, A., & McCray, R. 2000, ApJ 542, 914
- Winkler et al. (2003) Winkler, C., Courvoisier, T. J.-L., et al. 2003, A&A, 411, L1
- Worpel et al. (2013) Worpel H., Galloway, D., Price, D. 2013, ApJ 772, 94
- Zamfir et al. (2012) Zamfir, M., Cumming, A., & Galloway D. 2012, ApJ, 749, 69