Correlation between rearrangements and soft modes in polymer glasses during deformation and recovery
Abstract
We explore the link between soft vibrational modes and local relaxation events in polymer glasses during physical aging, active deformation at constant strain rate, and subsequent recovery. A softness field is constructed out of the superposition of the amplitudes of the lowest energy normal modes, and found to predict up to 70% of the rearrangements. Overlap between softness and rearrangements increases logarithmically during aging and recovery phases as energy barriers rise due to physical aging, while yielding rapidly rejuvenates the overlap to that of a freshly prepared glass. In the strain hardening regime, correlations rise for uniaxial tensile deformation but not for simple shear. These trends can be explained by considering the differing degrees of localization of the soft modes in the two deformation protocols.
pacs:
64.70.P, 81.05.Kf, 61.43.Fs, 61.43.BnI Introduction
The mechanical behavior of solids is often successfully described by continuum mechanics of a homogeneous medium. Polymer glasses, however, exhibit structural heterogeneity at the nanoscale. For instance, local elastic shear moduli evaluated in small volume elements containing several tens of monomers can differ substantially from the bulk macroscopic value Yoshimoto et al. (2004). As a result, amorphous materials can be separated into stiff and soft regions. At the same time, glassy dynamics at the monomer level is heterogeneous, with groups of particles relaxing rapidly in a collective manner while other regions remain essentially immobile Aichele et al. (2003); Berthier et al. (2011). Understanding the existence or absence of a link between local structure and dynamics is one of the important open questions in the physics of disordered materials.
Recent molecular simulations of a variety of model glass formers have provided strong evidence that the locations of structural rearrangements correlate with measures of structural heterogeneity. For instance, simulatons of a model polymer glass under tensile deformation show that nonaffine residual monomer displacements are largest in regions with small positive shear moduli Papakonstantopoulos et al. (2008). Simulation studies of the athermal deformation of amorphous two-dimensional binary mixtures also indicate that the nonaffine displacement field resulting from the macroscopic shear deformations of a few percent is directly related to the spatial structure of the elastic moduli Tsamados et al. (2009); Mizuno et al. (2013), while little correlation is found to other structural variables such as local density.
An alternative description of structural heterogeneity that also untilizes a harmonic description has been developed around the notion of soft vibrational modes. Amorphous solids generally exhibit an excess amount of low energy modes (Boson peak), and a large number of them are quasilocalized, i.e. they involve only very few particles Laird and Schober (1991). The particles involved in these modes exhibit structural differences in their neighborhood configuration Schober and Laird (1991), suggesting that they might play the role of defects in crystals. Recently, it has become possible to identify the structural signatures of rearranging particles with generalized structure functions that describe radial and bond orientations Cubuk et al. (2015). A “softness field” formed by the superposition of the amplitudes of the lowest frequency normal modes also yields a heterogeneous partitioning into hard and soft regions. Multiple recent simulation studies in supercooled liquids Widmer-Cooper et al. (2008, 2009); Hocky and Reichman (2013) and amorphous packings under shear at zero Tanguy et al. (2010); Manning and Liu (2011); Mosayebi et al. (2014) or finite temperature Schoenholz et al. (2014) confirm that regions of large vibrational amplitude overlap with the loci of structural rearrangements. An advantage of the soft mode description over the elastic moduli approach is that the soft modes also anticipate the direction of particle motion in a rearrangement Smessaert and Rottler (2014); Rottler et al. (2014). This correlation is robust and insensitive to the specific model system or diagnostic of the rearrangement. Low energy sound waves therefore scatter off flow defects and provide information about those collective particle motions that are most easily excited.
In a recent contribution, we explored quantitatively the robustness of this softness field for the prediction of monomer relaxation in aging polymer glasses Smessaert and Rottler (2014) for different temperatures and aging times. We showed that rearrangements identified as rapid changes in the particle positions (hops out of local cages) are up to seven times more likely at the softest regions, where the direction of motion also aligns near perfectly with the local polarization vectors. These correlations are only erased once more than 50% of the entire system has undergone rearrangements.
In the present work, we report a study of the correlation between irreversible rearrangements and local softness in actively deformed polymer glasses. This is important because previous studies have focused only on steadily sheared two-dimensional monomeric glasses formers Tanguy et al. (2010); Manning and Liu (2011); Schoenholz et al. (2014), while polymers are distinctly three-dimensional and exhibit strain hardening. Here we subject the polymer to uniaxial tensile deformation (extensional flow) and compare to the simple shear protocol used in previous studies. Moreover, we explore subsequently correlations between soft regions and local relaxation events in the regimes of aging, deformation, and recovery. During the aging phase, correlations grow due to a descent into deeper energy minima, but return quickly to their as-quenched values once plastic flow sets in. In the uniaxial tensile deformation protocol, correlations rise again with increasing strain, which we show to arise from an increase in the degree of localization of the soft modes as the aspect ratio of the sample changes. In simple shear by contrast, this effect is absent and correlations remain near constant during deformation. During the recovery phase, correlations increase only weakly as inherent structure energies return to their undeformed values.
II Methods
We study the polymer glass using molecular dynamics techniques and the well-known finitely extensible nonlinear elastic (FENE) bead-spring model Kremer and Grest (1990), which is an excellent computer glass-former Bennemann et al. (1998); Smessaert and Rottler (2012). Each linear polymer consists of 50 identical monomers with covalent bonds along the polymer backbone that were modeled by a non-linear stiff spring-like interaction. Inter- and intra-chain interactions between not covalently bonded monomers are modeled with a 6-12 Lennard-Jones (LJ) potential, which was truncated and force-shifted Allen and Tildesley (1989) with a cut-off of 2.5 times the bead diameter for computational efficiency, and to ensure that the Hessian is defined. The latter is important for the analysis of the vibrational spectrum. All quantities are stated in the usual LJ-units based on well energy , particle diameter , mass and characteristic time scale , which is just below twice the mean collision time. The simulation time step was set to , and all results are averaged over 20 independent simulation runs.
We simulate N=10,000 particles comprising 200 polymers in an initially cubic simulation box with periodic boundary conditions. Our simulation protocol is a direct extension of our earlier study that quantified the correlation between soft modes and irreversible particle rearrangements called hops in quiescent polymer glasses Smessaert and Rottler (2014). The glass is generated by rapidly quenching an equilibrated melt with density at constant volume (NVT) from to with a constant quench rate of . For the remainder of the simulation, the temperature is held constant. In a first step, the glass is aged without deformation at zero pressure (NPT) to the age at , which is just below the glass transition temperature. In the uniaxial tensile deformation protocol, the glass is then deformed in one direction with a constant strain rate , while the pressure perpendicular to the deformation axis is kept at zero. As a result, the simulation box shape changes from cubic to rectangular. The deformation ends at a final engineering strain with being the simulation box size along the deformation axis. In a final step, both deformation and barostat were turned off so that the system recovers at fixed volume and the stresses relax. This post-deformation recovery regime was explored for a time . The simple shear protocol imposes a constant shear rate of the same magnitude by deforming the simulation box into a parallelepiped. Here no additional barostating is performed.
Two key measurements are performed during the simulation: At different times during aging, deformation and recovery, we first store a configuration snapshot for the identification of the soft modes and then detect irreversible particle rearrangements in the whole simulation box immediately following the time of the snapshot. As introduced in full detail in Ref. Smessaert and Rottler (2014), we calculate a softness measure for each particle based on its participation in the low energy vibrational modes. This calculation was done in multiple steps: Starting from a snapshot, we first found the inherent structure using a combination of gradient descent and damped dynamics (FIRE Bitzek et al. (2006)) algorithms with a minimal total force criterion. Then, the Hessian
| (1) |
is calculated from the inherent structure particle locations as well as the potential energy , and the lowest energy eigenmodes are calculated using ARPACK. The softness of a particle is defined as the superposition of the participation fractions in the low energy vibrational modes Widmer-Cooper et al. (2008, 2009); Mosayebi et al. (2014),
| (2) |
Here, the polarization vector is the projection of the eigenvector of mode on the degrees of freedom of particle . The softness field depends on a single parameter, the number of low energy modes , and the scaling factor is added to make the softness an intensive quantity in terms of . An optimal value of (2% of the modes) is chosen based on our previous analysis Smessaert and Rottler (2014). A particle is ”softer” the larger , which is used to rank the particles according to their relative softness. The absolute value of is not in itself meaningful, since the participation fractions are normalized quantities, i.e., .
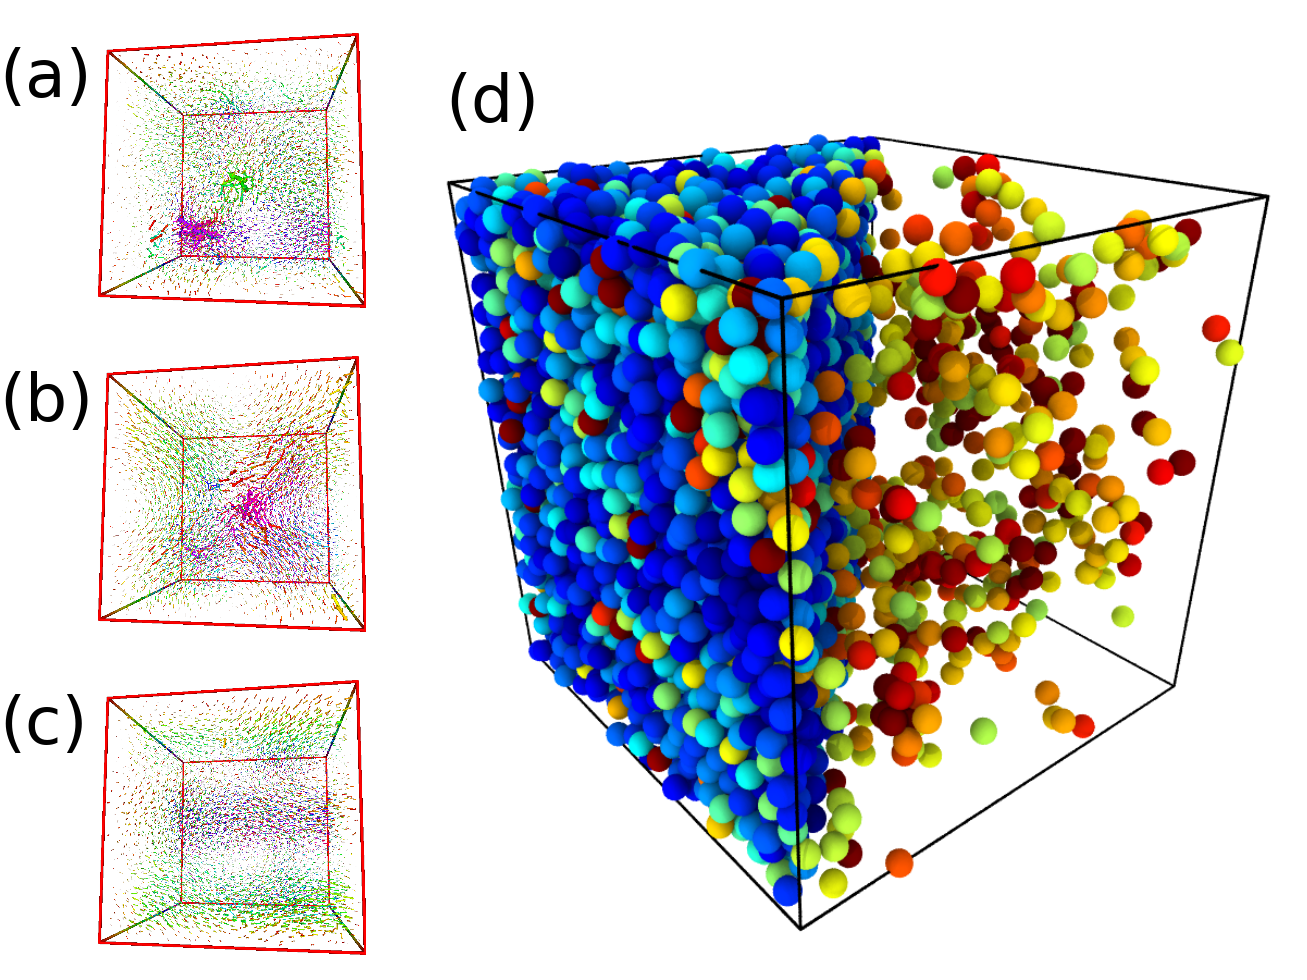
Figure 1(a-c) visualizes three exemplary low energy eigenmodes calculated at the end of the aging period by plotting their polarization vector fields. One can see that the modes (a) and (b) are quasi-localized, since large polarization vectors are concentrated on a small number of particles that are spatially clustered. The spectrum also exhibits extended, planar-wave like modes and an example is shown in panel (c). Panel (d) shows a snapshot of the system where each particle is colored according to its softness (blue is small and red is large ). On the right side of the simulation box, we only show the 10% softest particles, illustrating the heterogeneous spatial distribution.
Irreversible particle rearrangements are identified using a detection algorithm that was introduced in a previous study Smessaert and Rottler (2013), where it is explained in greater detail. In short, we monitor the trajectory of each particle on-the-fly during the simulation and isolate rapid changes or hops of particles by calculating the mean distance squared
| (3) |
between the earlier (A) and later (B) half of the trajectory of particle in a time window that moves with the simulation. Here, the averages [] are taken over all trajectory points in A [B] and [] is the mean position in the respective trajectory segment. A hop is detected when , and we record particle identifier, time of hop, as well as initial and final position. The value of the threshold is related to the plateau in the mean square displacement Smessaert and Rottler (2013). To isolate the irreversible rearrangements we exclude back-and-forth hops of a particle between the same two positions. This is done by removing a sequence of two hops of the same particle, if the final position of the second hop is within a distance of of the initial position of the first hop.
III Results
We discuss the spatial correlation between softness field and monomer hops in terms of a predictive success rate Smessaert and Rottler (2014). Here, the softness field is binarized into a soft spot map denoted by assigning a softness of one to the fraction of particles with largest softness and zero to the other particles. We then calculate the fraction of the first hopping particles that are part of a soft spot, or
with if particle is one of the first particles to hop after the measurement of the softness field, and otherwise.
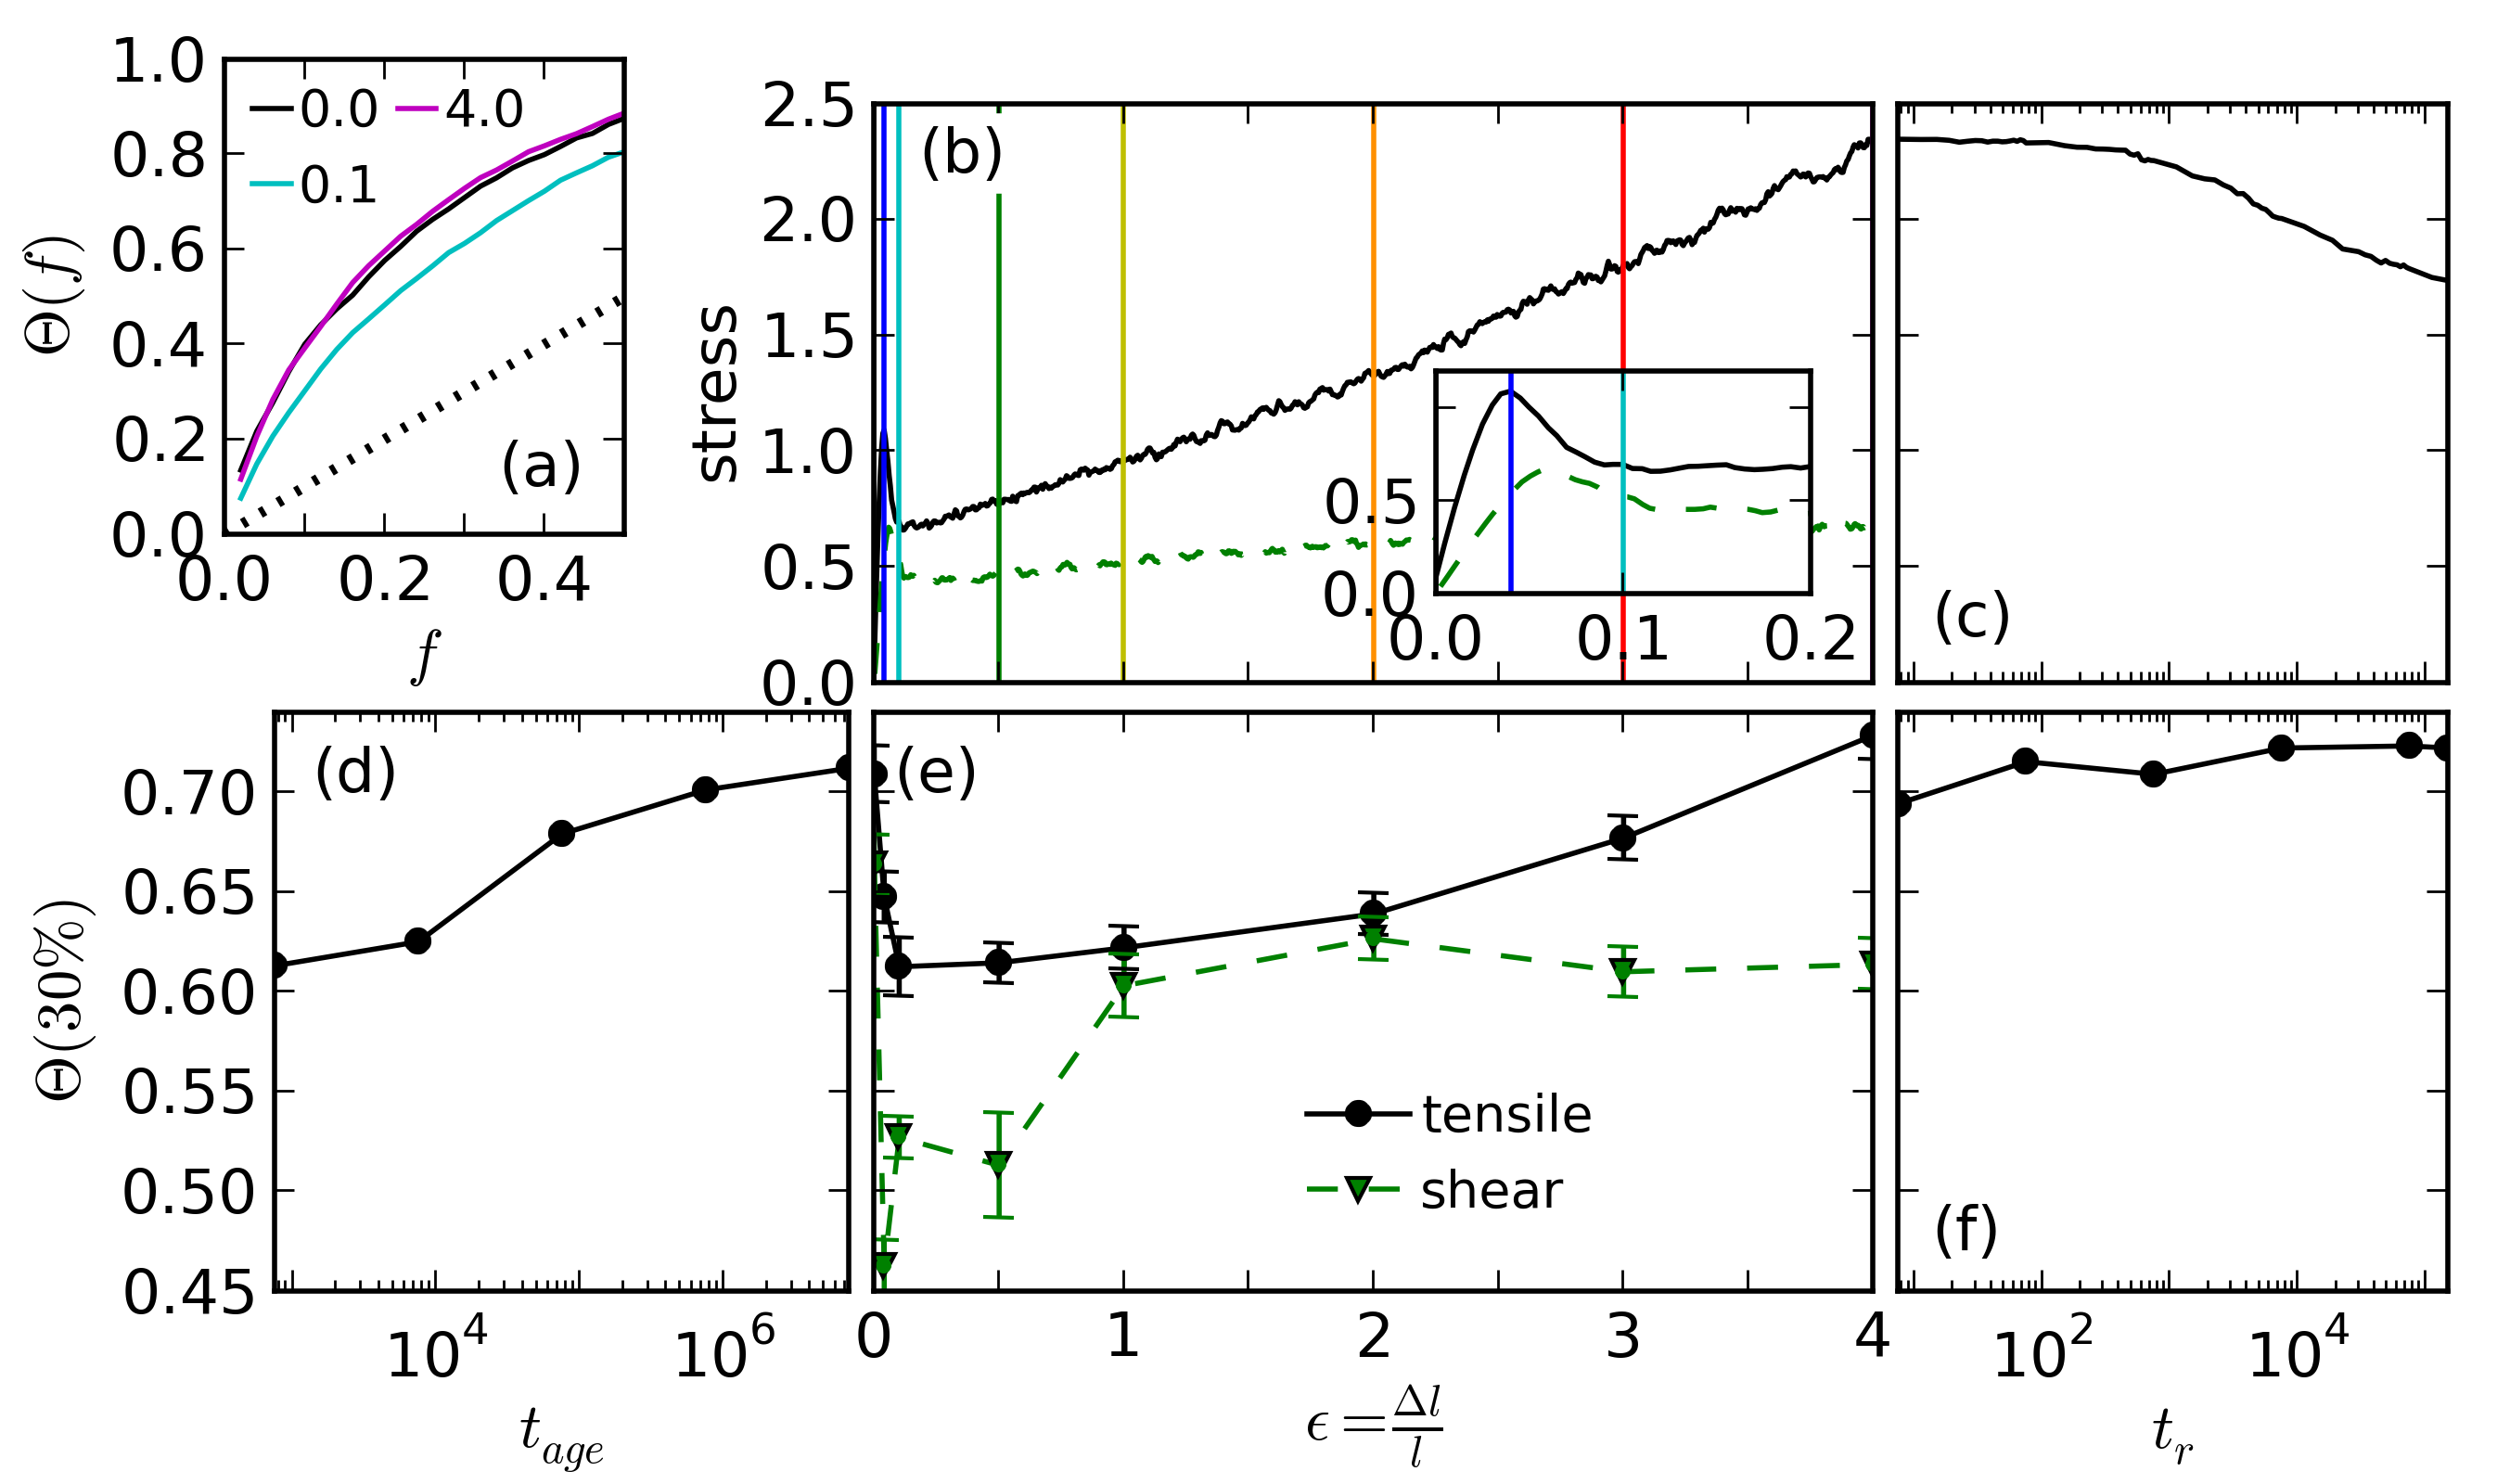
Figure 2(a) shows the predictive success rate measured at three different strains during the uniaxial tensile deformation (qualitatively similar curves are found under simple shear). Stress-strain curves for the two deformation modes are shown in Fig. 2(b) and reveal post-yield strain hardening in both cases, albeit to a much lower degree in the simple shear case. It can be seen that the three strains shown in panel (a) correspond to the onset of deformation at the end of the aging period, right after the yield peak, and the end of the strain hardening regime. The dotted line indicates for randomly distributed soft spots (no correlation) for comparison. For all strains, we find a larger than random correlation between softness field and the occurrence of hops.
To facilitate the analysis of trends in the spatial correlation during aging, deformation and recovery, we now focus on the predictive success rate at a coverage fraction of 30%. This is the fraction where the difference between measured and uncorrelated value (dashed line) is maximal. In Fig. 2(d) we show the evolution of during the initial aging period. In agreement with the results reported in Ref. Smessaert and Rottler (2014), the correlation increases from to as the age grows by four orders of magnitude. Panel (e) shows the predictive success rate measured at different points during uniaxial tensile and simple shear deformation. In the tensile case (solid line), the spatial correlation in the elastic regime at is roughly equal to the value found in the quiescent state immediately prior to the deformation. At the yield strain , the correlation has decreased to and at the end of the strain softening regime () has reached the pre-aging value . Even larger decreases in fact below the pre-aging value are seen in the pure shear case. This reversal of the aging effects is consistent with mechanical rejuvenation, by which deformation strains exceeding the yield strain erase the thermal history and return the material to a freshly quenched glassy state Smessaert and Rottler (2012).
Interestingly, trends in spatial correlation begin to diverge between the two deformation modes in the strain hardening regime. Under uniaxial tension, we find that monotonically increases with growing strain. The increase accelerates at large strains , reaching a value of at , which is above the predictive success rate measured in the quiescent state prior to the deformation. By contrast, the correlation during simple shear saturates at the value of the freshly quenched glass for strains larger than one. In the recovery regime, investigated only for the tensile case (panel (f)), first drops slightly but then increases again weakly as the material continues to age.
What is the origin of the different behavior of the softness-rearrangement correlation in tensile vs. simple shear deformation? In order to answer this question, we analyze the low energy vibrational mode spectrum during the deformation period more carefully. The extent of localization of a mode can be quantified by the participation ratio
| (4) |
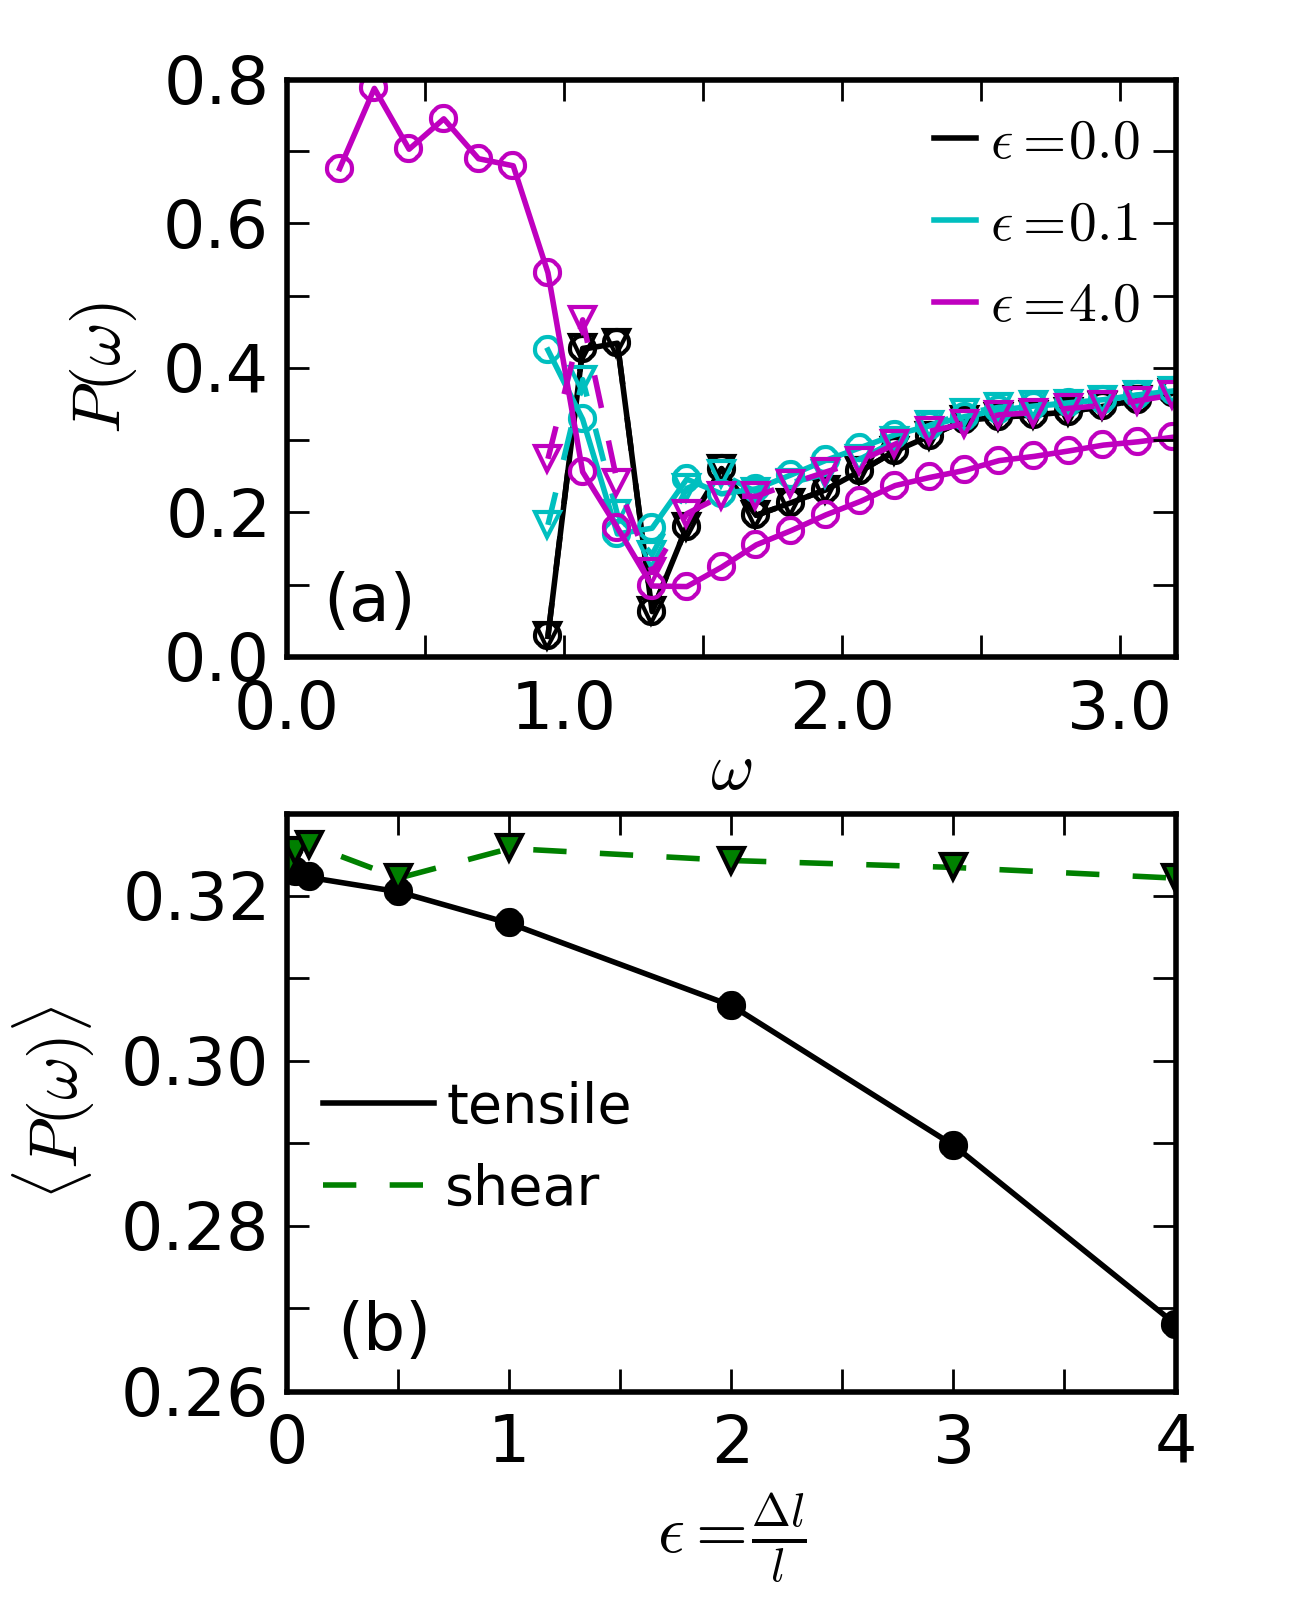
A value of means that all particles are participating equally in mode , whereas a small value indicates that the mode is quasi-localized around a few active particles. In Fig. 3 (a) we show the participation ratio as function of mode frequency . Since the vibrational spectrum is a feature of the inherent structure, at strain reflects the quiescent state at the end of the aging period. The participation ratios at the end of the strain softening regime () are nearly unchanged, with a slight shift of the extended modes (large participation ratio) towards smaller frequencies for both deformation modes.
Important differences emerge in the strain hardening regime at . While for simple shear is unchanged, uniaxial tension deformation results in two new features: First, we find modes with large participation ratio at much smaller frequencies. This change is due to the large (400%) elongation of the simulation box along the deformation axis in our uniaxial tension simulation, which allows modes with larger wavelength to ”fit” into the simulation volume. In general one expects extended modes to emerge on the low energy side of the spectrum as the system dimension increases, since the material looks increasingly homogeneous on large length scales. At same time, however, we find that the participation ratios of the modes at are reduced compared to the undeformed system. With increasing linear dimension, the likelihood of finding a low energy quasilocalized mode is therefore enhanced. This effect is absent in the simple shear case, during which the simulation box periods do not change.
In fig. 3(b) we show the evolution of the mean participation ratio of all modes used for the calculation of the softness field with deformation. For tensile deformation, we find a gradual reduction of the average participation ratio, indicating that the soft modes become more and more localized as the deformation grows. By contrast, the average participation ratio does not change during simple shear. These results suggest that the change in participation ratio is merely a consequence of the changing box dimensions during uniaxial strain. In order to separate deformation effects from geometry, we have equilibrated the same polymer glass in a simulation box that has identical shape to a deformed polymer at 400% strain and computed the distribution of participation ratio at zero load. These distributions are identical to those found at the end of the hardening regime, which confirms that the change in is of geometrical origin.
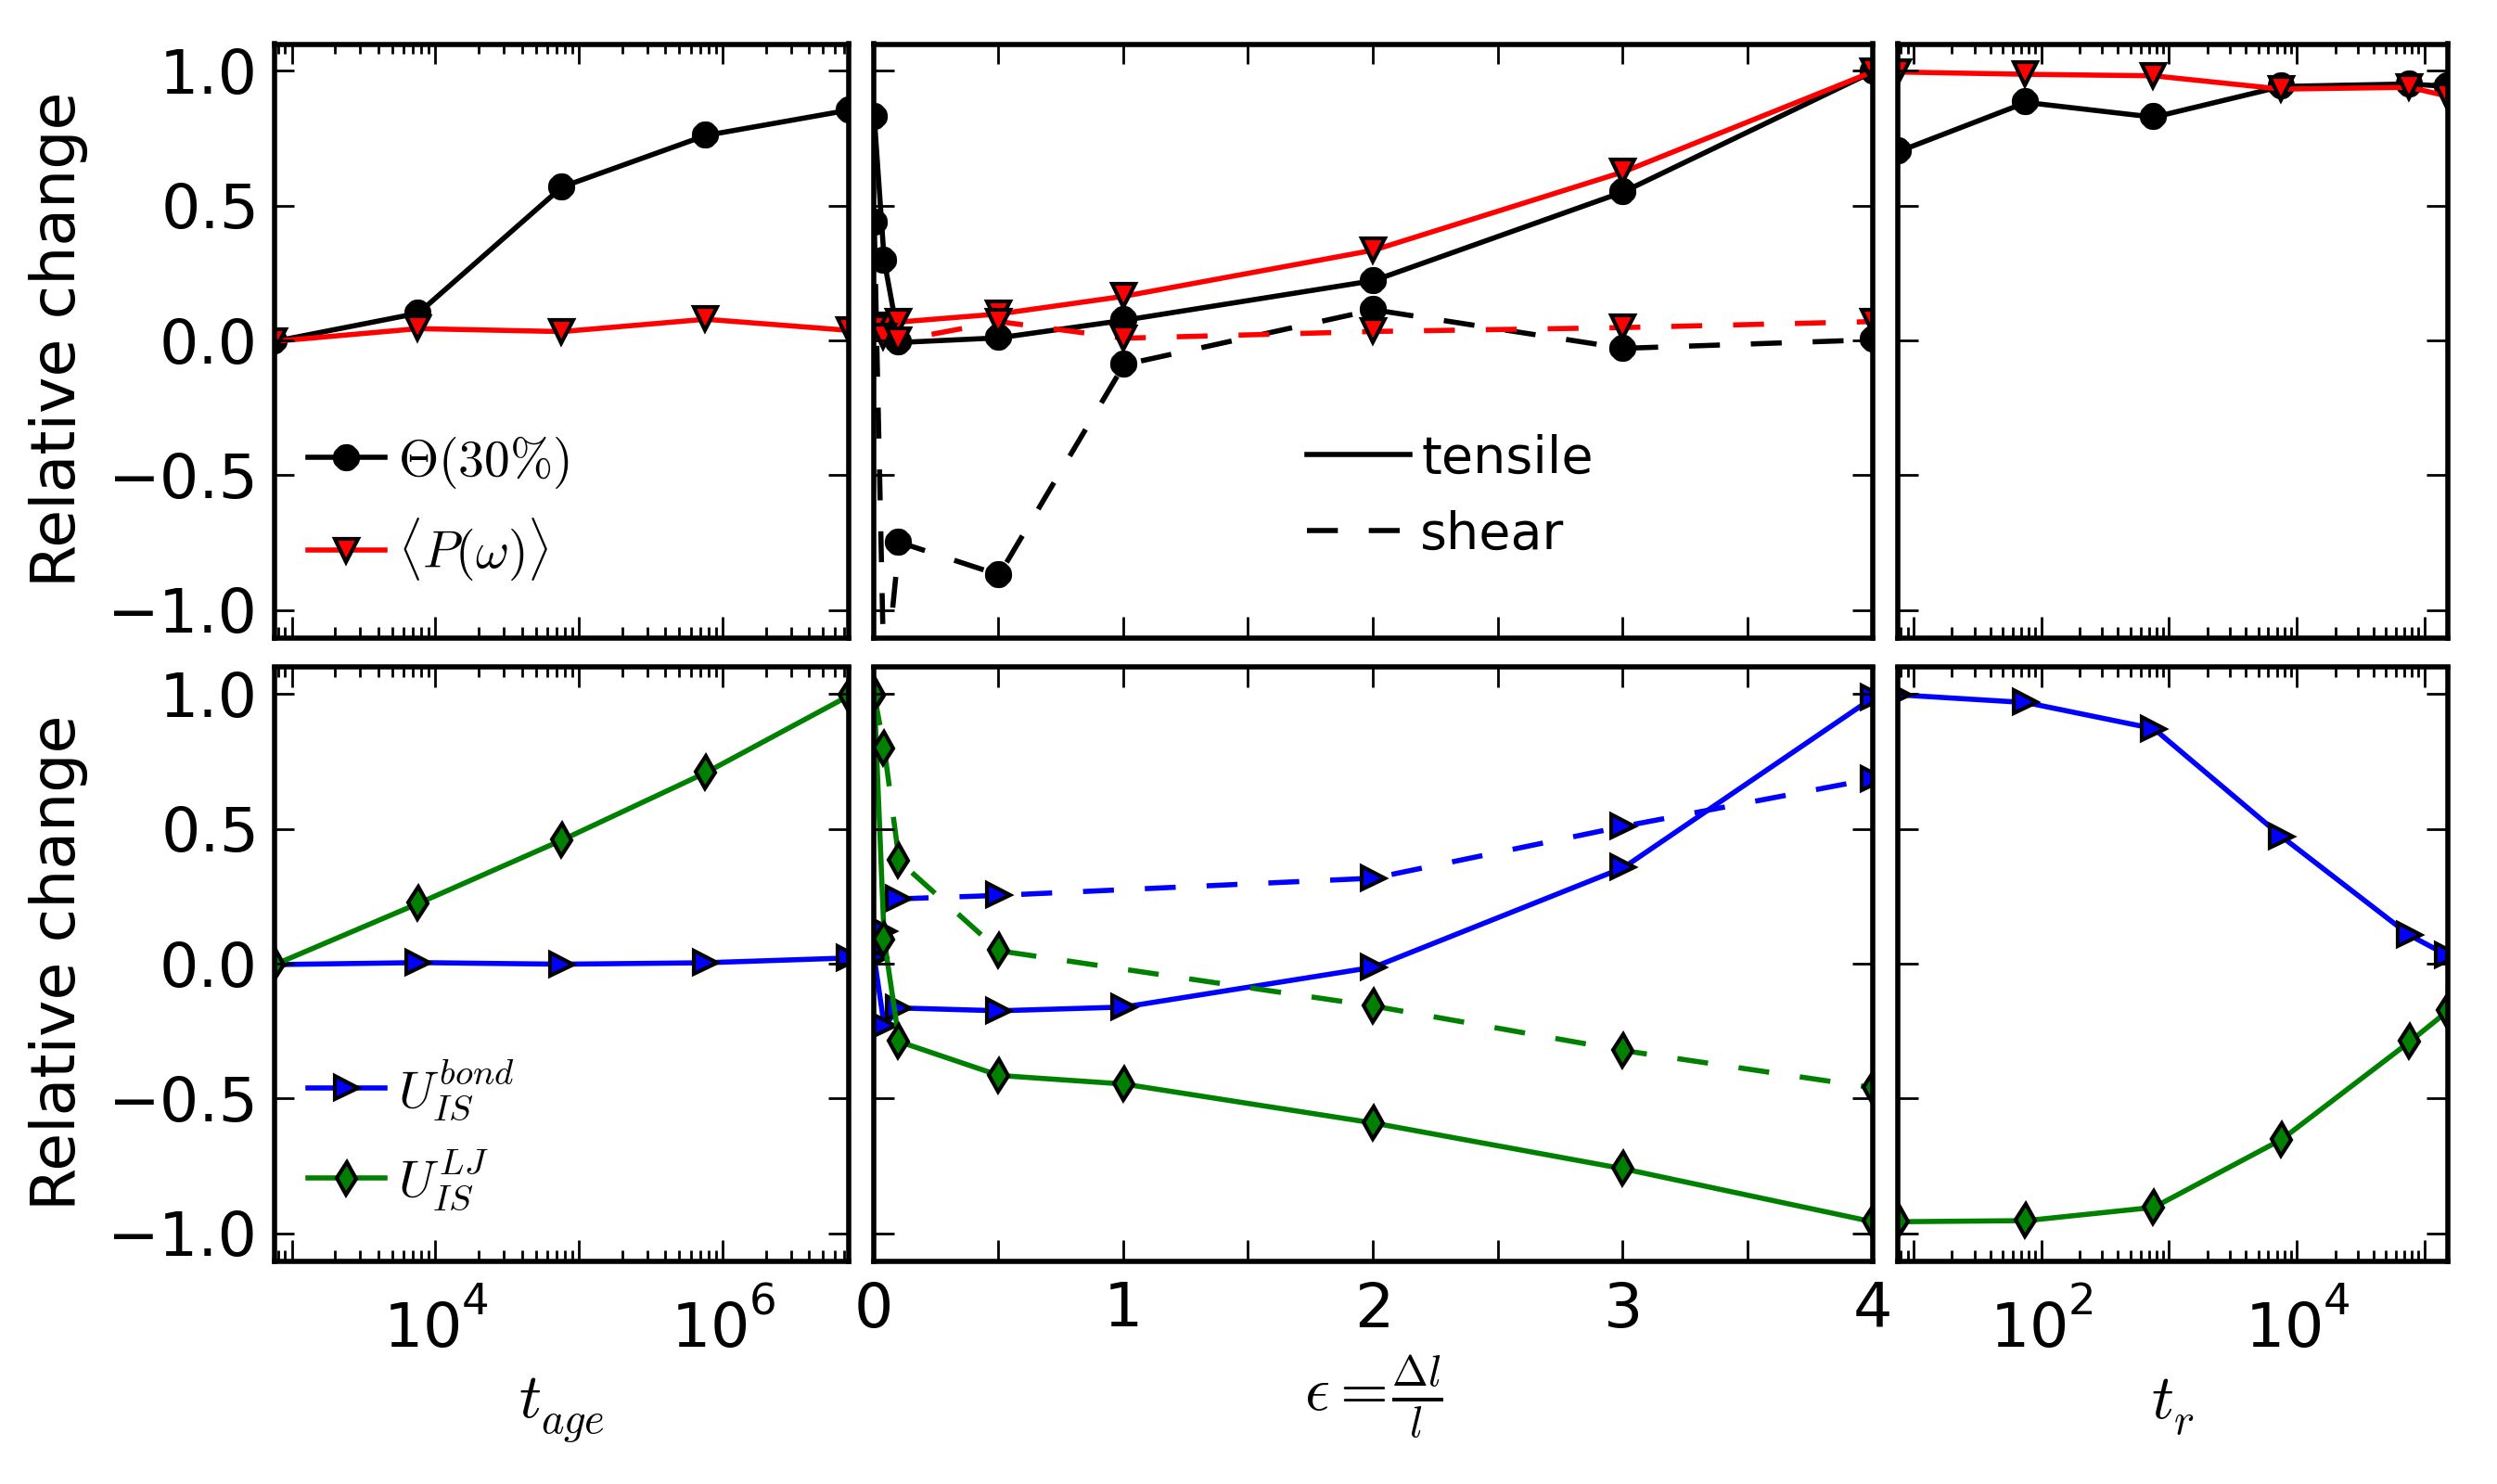
We now show that the increasing degree of localization of the soft modes under uniaxial deformation explains the rise of the overlap between softness and rearrangements. To this end, we compare the evolution of to changes in the mean participation ratio in the top panels of Fig. 4. To facilitate the comparison, we introduce a scaling that normalizes these quantities by the extremal change during the simulation run. The relative change of a quantity Q with regard to a reference value from the freshly quenched state is defined as , where is the extremal value measured during the aging, deformation and in the recovery regime. For the spatial correlation we use the maximal value, while for the mean participation ratio we use the minimal value. The top left panel shows that the mean participation ratio does not change during aging, while the overlap rises roughly logarithmically. The overlap between hops and soft modes improves as the system reaches deeper energy wells and the energy barriers for rearrangement rise with age. During uniaxial tensile deformation (middle panel), we find that after the initial rejuvenation drop, rises in lockstep with the mean participation ratio . This observation suggests that the improving overlap of in the hardening regime is indeed due to an increased amount of highly localised modes. During simple shear by contrast, neither overlap nor mean participation ratio increase with strain. is again constant in the recovery regime where the simulation box size does not change.
The bottom panels of Fig. 4 provide as additional information the evolution of the inherent structure energy, separated into contributions from pairwise LJ interactions and covalent bonds. During aging (left panel), we see the well-known logarithmic aging increase of while the mean bond energy remains constant. These trends mirror those in the panel above for the overlap. In the deformation stage (middle panel), decreases as the glass is pulled up higher on the energy landscape, while increases as more and more energy is stored in the covalent bonds of the aligning polymer chains. While this increase of with strain is also broadly consistent with the rise of the overlap measure in the uniaxial tensile deformation, it disagrees in simple shear deformation where the overlap is constant. Moreover, in the recovery regime (right panel), drops rapidly while is very weakly increasing. These observations provide further evidence that strain hardening does not influence the softness map - rearrangement correlations. Our recovery regime is just long enough for both inherent structure energies to reach their undeformed values.
IV Discussion
We have investigated the correlation between local relaxation events, identified as irreversible monomer hops out of local cages, and a softness map constructed from the superposition of low energy vibrational modes, in polymer glasses during physical aging, deformation and structural recovery. In the as-quenched glass, hops are about twice as likely to occur on soft spots than elsewhere in the polymer. This correlation increases logarithmically to about 2.4 over 4 decades of aging time and rises because physical aging amplifies the influence of the potential energy landscape on the dynamics. Both simple shear and uniaxial tensile deformation rapidly rejuvenate this correlation once plastic flow sets in. Further uniaxial tensile deformation increases the soft spot-relaxation overlap again due to an increase in quasilocalized modes as the sample elongates in the tensile direction, while no such effect occurs in simple shear. Strain hardening, although present in our model polymer, does not seem to play a major role in these trends. Accordingly, the present effects can be expected in short molecule glass formers as well.
The present results indicate that two factors control the ability of soft modes to predict structural rearrangement: position on the energy landscape, and degree of localization of the lowest energy modes. The lower the inherent structure energies and the higher the barriers, the better the ability of the potential energy landscape (a T=0 property) to predict dynamics at elevated temperature near the glass transition. Additionally, the extent of overlap also depends on system size. Although the longest wavelength modes tend to have plane wave character, increasing the system size simultaneously generates more highly localized modes below the Boson peak, and these are most efficient in finding soft spots. These results call for a systematic study of finite size effects on the low energy vibrational spectrum of disordered solids and their relationship to rearrangements.
Acknowledgments
We thank E. del Gado for helpful discussions. This work was supported by the Natural Sciences and Engineering Research Council of Canada (NSERC). Computing time was provided by Compute Canada.
References
- Yoshimoto et al. (2004) K. Yoshimoto, T. S. Jain, K. V. Workum, P. F. Nealey, and J. J. de Pablo, Phys. Rev. Lett. 93, 175501 (2004).
- Aichele et al. (2003) M. Aichele, Y. Gebremichael, F. W. Starr, J. Baschnagel, and S. C. Glotzer, J. Chem. Phys. 119, 5290 (2003).
- Berthier et al. (2011) L. Berthier, G. Biroli, J.-P. Bouchaud, L. Cipelletti, and W. v. Saarloos, Dynamical Heterogeneities in Glasses, Colloids, and Granular Media (Oxford University Press, 2011).
- Papakonstantopoulos et al. (2008) G. J. Papakonstantopoulos, R. A. Riggleman, J.-L. Barrat, and J. J. de Pablo, Phys. Rev. E 77, 041502 (2008).
- Tsamados et al. (2009) M. Tsamados, A. Tanguy, C. Goldenberg, and J.-L. Barrat, Phys. Rev. E 80, 026112 (2009).
- Mizuno et al. (2013) H. Mizuno, S. Mossa, and J.-L. Barrat, Phys. Rev. E 87, 042306 (2013).
- Laird and Schober (1991) B. B. Laird and H. R. Schober, Phys. Rev. Lett. 66, 636 (1991).
- Schober and Laird (1991) H. R. Schober and B. B. Laird, Physical Review B 44, 6746 (1991).
- Cubuk et al. (2015) E. Cubuk, S. Schoenholz, J. Rieser, B. Malone, J. Rottler, D. Durian, E. Kaxiras, and A. Liu, Physical Review Letters 114, 108001 (2015).
- Widmer-Cooper et al. (2008) A. Widmer-Cooper, H. Perry, P. Harrowell, and D. R. Reichman, Nat Phys 4, 711 (2008).
- Widmer-Cooper et al. (2009) A. Widmer-Cooper, H. Perry, P. Harrowell, and D. R. Reichman, The Journal of Chemical Physics 131, 194508 (2009).
- Hocky and Reichman (2013) G. M. Hocky and D. R. Reichman, The Journal of Chemical Physics 138, 12A537 (2013).
- Tanguy et al. (2010) A. Tanguy, B. Mantisi, and M. Tsamados, EPL 90, 16004 (2010).
- Manning and Liu (2011) M. L. Manning and A. J. Liu, Phys. Rev. Lett. 107, 108302 (2011).
- Mosayebi et al. (2014) M. Mosayebi, P. Ilg, A. Widmer-Cooper, and E. Del Gado, Phys. Rev. Lett. 112, 105503 (2014).
- Schoenholz et al. (2014) S. Schoenholz, A. Liu, R. Riggleman, and J. Rottler, Physical Review X 4, 031014 (2014).
- Smessaert and Rottler (2014) A. Smessaert and J. Rottler, Soft Matter 10, 8533 (2014).
- Rottler et al. (2014) J. Rottler, S. S. Schoenholz, and A. J. Liu, Phys. Rev. E 89, 042304 (2014).
- Kremer and Grest (1990) K. Kremer and G. S. Grest, J. Chem. Phys. 92, 5057 (1990).
- Bennemann et al. (1998) C. Bennemann, W. Paul, K. Binder, and B. Dünweg, Phys. Rev. E 57, 843 (1998).
- Smessaert and Rottler (2012) A. Smessaert and J. Rottler, Macromolecules 45, 2928 (2012).
- Allen and Tildesley (1989) M. P. Allen and D. J. Tildesley, Computer Simulation of Liquids (Oxford University Press, 1989).
- Bitzek et al. (2006) E. Bitzek, P. Koskinen, F. Gähler, M. Moseler, and P. Gumbsch, Phys. Rev. Lett. 97, 170201 (2006).
- Smessaert and Rottler (2013) A. Smessaert and J. Rottler, Phys. Rev. E 88, 022314 (2013).