Dark Matter Admixed Type Ia supernovae
Abstract
We perform two-dimensional hydrodynamic simulations for the thermonuclear explosion of Chandrasekhar-mass white dwarfs with dark matter (DM) cores in Newtonian gravity. We include a 19-isotope nuclear reaction network and make use of the pure turbulent deflagration model as the explosion mechanism in our simulations. Our numerical results show that the general properties of the explosion depend quite sensitively on the mass of the DM core : a larger generally leads to a weaker explosion and a lower mass of synthesized iron-peaked elements. In particular, the total mass of 56Ni produced can drop from about to as increases from 0.01 to . We have also constructed the bolometric light curves obtained from our simulations and found that our results match well with the observational data of sub-luminous Type-Ia supernovae.
95.35.+d, 97.20.Rp,
1. Introduction
1.1. Type-Ia supernovae
Type-Ia supernovae (SNIa) are important astrophysical objects because of the similarity in their light curves and spectra (Branch & Tammann, 1992), which leads to wide applications of SNIa in cosmological distance measurement such as the determination of the Hubble parameters (Leibundgut & Pinto, 1992) and the discovery of the accelerating expansion of the universe (Riess et al., 1998; Perlmutter et al., 1999). However, despite their important roles in modern cosmology, both the progenitor system and explosion mechanism of SNIa are not yet fully understood. While it is generally believed that SNIa are due to the thermonuclear explosion of a carbon-oxygen white dwarf (WD) in binary systems, it is still unclear whether the companion is a normal non-degenerate star or another WD. Traditionally, SNIa is attributed to the explosion of a WD at the Chandrasekhar mass limit (Arnett, 1969). The WD has a mass initially far from the mass limit. Depending on the accretion rate, the mass can either gradually grow until the baryonic matter becomes degenerate (Nomoto, 1982a), or a detonation front forms at the envelope and sheds away the outer mass (Nomoto, 1982b). Both mechanisms provide conditions for the formation of a first trigger (Nomoto et al., 1984) which spreads in the form of a deflagration wave (Nomoto et al., 1976) and unbinds the star. However, neither pure deflagration (Nomoto et al., 1984) nor pure detonation model (Arnett, 1969) is adequate to explain the observed velocity profile, optical light curve, spectra, galactic chemical abundance and explosion strength. Furthermore, recent studies show that SNIa can be formed without invoking Chandrasekhar mass WD (Scalzo et al., 2014). For example, violent white dwarf mergers can also explain the SNIa distributions (Pakmor et al., 2013).
The difficulties encountered by the pure deflagration and pure detonation models have led to extensions of models including the pure turbulent deflagration (PTD) model (Reinecke et al., 1999a, b, 2002a, 2002b), delayed-detonation transition (DDT) model (Khoholov, 1989; Khokhlov, 1991a, b, c; Khokhlov et al., 1997) and gravitationally confined detonation (GCD) model (previously known as the detonation failed deflagration model) (Plewa, 2007; Kasen & Plewa, 2007; Jordan et al., 2008; Meakin et al., 2009; Jordan et al., 2012). Each model has its own theoretical difficulties. For example, while the PTD model can produce explosion with a variety of strengths (Roepke et al., 2006), there are still unburnt low-velocity carbon and oxygen near the core, which are not observed (Roepke et al., 2007). The DDT model can provide sufficient intermediate mass elements (IME) and leave very little fuel (Gamezo et al., 2004, 2005). However, the possibility of transition is still being debated (Lisewski et al., 2000).
In recent years, the PTD, DDT and GCD models are studied extensively in multi-dimensional simulations (Long et al., 2014; Seitenzahl et al., 2013; Jordan et al., 2012). The models can well explain the phenomena of normal SNIa, i.e., supernovae with a correlated peak luminosity against B-band decline rate, chemical stratification and a large velocity gradient (Benetti et al., 2005). However, there is a significant number of peculiar SNIa which are sub-luminous and super-luminous (Li et al., 2001). In particular, sub-luminous SNIa have a much lower absolute magnitude of B-band at maximum. For example, the famous SN1991bg (Filippenko et al., 1992) recorded a 2.5 mag and 1.6 mag dimmer in B- and V-band peak magnitudes. The B-band decline rate is faster than the norm, with a lower expansion velocity and stronger Si II absorption lines (Doull & Baron, 2011). It was initially assumed that such unusual SNIa are extremely rare. However, there are now sufficient number of sub-luminous SNIa that they are classified as the FAINT group as suggested in (Benetti et al., 2005). Detailed study shows that the light curves in this group of SNIa are also homogeneous among themselves as those of normal SNIa (Doull & Baron, 2011). The faintest SNIa ever found to date is SN2008ha (Foley et al., 2009), with a low magnitude of mag and extremely low expansion velocity km s-1.
In view of the discovery of sub-luminous and super-luminous SNIa, the explosion of a Chandrasekhar-mass WD can no longer be the sole explanation of SNIa because of the lack of variety in its explosion. The sub-Chandrasekhar mass double detonation model is often regarded as the explanation for sub-luminous SNIa (Woosley & Weaver, 1994). The model suggests that when the mass accretion of a WD from its companion is adequately fast, the matter on its envelope, mostly helium, can be ignited and an implosion is triggered (Nomoto, 1982b). The front converges at the WD core and a second explosion is created. This model allows a WD to be burnt if the matter is not yet degenerate. By tuning the host WD mass, less luminous SNIa can be modeled, which can be fitted to explain certain sub-luminous SNIa, for instance SN1991bg (Ruiz-Lapuente et al., 1993). The helium detonation is found robust in inducing a second explosion (Fink et al., 2009) and the predicted optical signal is compatible with observations (Kromer et al., 2010; Sim et al., 2012). However, recent studies of this model with less massive helium shell show similar features as normal SNIa (Sim, 2010; Ruiter et al., 2011, 2014) instead of sub-luminous ones. Furthermore, the detonation might not be started robustly (Livne & Glasner, 1990). Even when a helium detonation is triggered, the detonation wave might not penetrate deep into the carbon/oxygen core (Moll & Woosley, 2013), and the distribution of outer chemical elements can be in conflict with observation data (Hoeflich & Khokhlov, 1996; Hoeflich et al., 1996).
Another popular proposal for explaining sub-luminous SNIa is the pure turbulent deflagration model with remnant. This model assumes that the deflagration only partially burns the WD, and parts of the WD remain bounded after the explosion. It is applied to the SN2002cx class of the sub-luminous SNIa. The synthetic color light curves and the spectra can match well with the observational data (Jordan et al., 2012; Kromer et al., 2013a; Fink et al., 2014). In (Kromer et al., 2015) this model is further shown to be in good agreement with the faintest SN2008ha. The recent observational hints of the SN2008ha remnant (Foley et al., 2014) also support this model as the origin of this class of sub-luminous SNIa.
Violent merging of two low-mass WD’s is also a possible candidate of explaining the sub-luminous SNIa. For example, (Pakmor et al., 2010) showed that this model provides a good match to the observed features of SN1991bg, while in (Kromer et al., 2013b) the light curves and spectra of SN2010Ip are well reproduced.
1.2. Dark matter astrophysics
The effects of various dark matter (DM) candidates on stellar evolution and structure have been studied in details. For example, the effects of DM annihilation as the energy source in early stars have been considered in (Spolyar et al., 2008; Ripamonti et al., 2010; Fairbairn et al., 2008; Freese et al., 2009; Spolyar et al., 2009; Hirano et al., 2011). The DM particle capture and evaporation rates of the sun (Gould, 1987a, b) and the Earth (Gould, 1988) were studied in early 1990s. The dense core of compact stars is also a good probe of DM (Bertone & Fairbairn, 2008; Fan et al., 2011; de Lavallaz & Fairbairn, 2010). DM particles can annihilate or decay inside a compact star and thus provide an energy source (Gonzalez & Reisenegger, 2010; Perez-Garcia & Silk, 2014). For example, it has been suggested that the energy is sufficient to maintain the surface temperature of WDs (Moskalenko & Wai, 2007; Hooper et al., 2012) and neutron stars (Kouvaris, 2008; Kouvaris & Tinyakov, 2010). On the other hand, non-self-annihilating DM can affect the star by its gravity. The self-gravitating DM core inside a compact star might collapse, which forms a black hole and engulfs the star (Goldman & Nussinov, 1989; de Lavallaz & Fairbairn, 2010). The detection of ancient compact stars can thus provide limits on the DM scattering cross section for different types of DM particles (Kouvaris & Tinyakov, 2011; Kouvaris, 2012; McDermott et al., 2012; Bramante et al., 2013).
1.3. Motivation
Previously, we have studied the equilibrium structure and stability of compact stars with cores composed of non-self-annihilating DM particles which are modeled by an ideal Fermi gas (Leung et al., 2011, 2012, 2013). In particular, for DM particle mass of about 1 GeV, we found that the DM core can affect the structure of a WD significantly. The DM core can be as massive as about and the Chandrasekhar mass limits of these WD can be smaller than those without DM by as much as 40%. An implication of our findings in (Leung et al., 2013) is that the initial conditions of SNIa might not be as universal as generally assumed. In this paper, we study how DM affects SNIa explosions by performing two-dimensional hydrodynamic simulations of the thermonuclear explosions of Chandrasekhar-mass WDs with DM cores. We find that these objects generally have weaker explosions and lower masses of synthesized iron-peaked elements, and hence they may account for the sub-luminous class of SNIa.
The plan of this paper is as follows: In Section 2 we outline the equations and methods that we used in the numerical simulations. Section 3 presents the general results of our SNIa simulations in terms of the explosion energy, nucleosynthesis, and features of the propagating flame surface. We also compare the bolometric light curves constructed from our simulations with the observational data of sub-luminous SNIa. Finally, we summarize in section 4.
2. Methods
We have developed a two-dimensional hydrodynamical code with Newtonian gravity to model SNIa. The code makes use of the Weighted Essential Non-Oscillatory (WENO) scheme for spatial discretization (Barth & Deconinck, 1999). This is a fifth-order scheme which processes piecewise smooth functions with discontinuities in order to simulate the flux across grid cells with high precision, while avoiding spurious oscillations around the shock. The discretization in time is performed by using the five-stage, third-order, non-strong stability preserving explicit Runge-Kutta scheme (Barth & Deconinck, 1999). Various consistency and convergence tests have been done to validate our code (Leung et al., 2015). Here we only outline the essence of the code.
2.1. Initial Model
In the simulation there are both baryonic normal matter (NM) and DM. The initial density profiles are obtained by solving the hydrostatic equilibrium equations for both NM and DM:
| (1) | |||
| (2) |
where and are the NM and DM density, respectively. The enclosed masses of and are determined by
| (3) | |||
| (4) |
The initial NM is assumed to be isothermal with a temperature of K. The chemical composition is 50% 12C and 50% 16O by mass. To construct the initial WD models and simulate the NM dynamics, we employ the equation of state (EOS) developed and calibrated in (Timmes & Arnett, 1999; Timmes & Swesty, 1999). The EOS describes the equilibrium thermodynamics properties of a gas which includes 1. electrons in the form of an ideal gas with arbitrarily degenerate and relativistic levels, 2. ions in the form of a classical ideal gas, 3. photons described by the Planck distribution, 4. contributions from electron-positron pairs. On the other hand, the DM is modeled by an ideal degenerate Fermi gas with a particle mass of 1 - 10 GeV (Leung et al., 2011, 2012, 2013), which is motivated by recent hints on possible detection of GeV scale DM particles in some direct DM searches, such as DAMA and CoGeNT (Bernabei et al., 2013; Aalseth & others, 2011). One concern is that the admixed DM core may alter the stellar evolution path during the main-sequence stage, where deviations from standard stellar evolution theory have not been observed. We show in the Appendix that the range of considered does not bring significant effects on the evolution tracks, especially of the carbon-oxygen WD progenitors, namely 4 - 7 main-sequence stars.
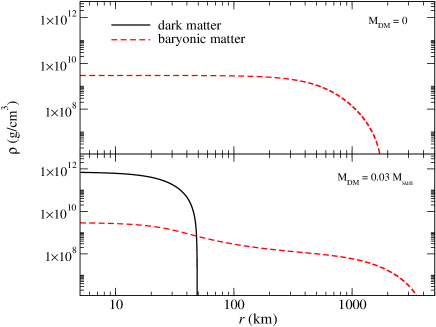
We plot in Fig. 1 the density profiles of two of our initial models with GeV. The upper panel of Fig. 1 is a standard model without DM (Model 2D-PTD-3-0-c3 in Table 1). The lower panel shows the NM and DM profiles of a stellar model with a DM core of mass (Model 2D-PTD-3-3-c3 in Table 1). The central DM density of this model is about 3 orders of magnitude higher than that of the NM. Due to its high compactness, the DM core produces a strong gravitational field around the core region and leads to a cusp-like structure in NM and steep NM density gradient in the core. We remark that the density profiles shown here are different from those in (Leung et al., 2013) owing to the choice of DM particle mass and the total mass of admixed DM. In Fig. 6 of (Leung et al., 2013) the EOS of DM particle is chosen to be 10 GeV ideal degenerate Fermi gas instead of 1 GeV in this article. Also, in the same figure of (Leung et al., 2013), the admixed DM mass is about , which is one order of magnitude lower than those in Fig. 1.
2.2. Hydrodynamics
The thermonuclear explosion of a WD with a DM core is inherently a two-fluid system where the NM and DM couple through gravity. In principle, one has to model the dynamics of the two fluids consistently by solving two different sets of hydrodynamics equations. However, the typical density of DM in our simulations is about two or three orders of magnitude higher than that of NM. The size of the DM core is also much smaller than the stellar radius. As a result, the dynamical time and length scales of NM and DM differ by orders of magnitude, and hence performing a consistent and accurate two-fluid hydrodynamics simulation for SNIa would be a computationally challenging task. On the other hand, due to its high compactness, the dynamics of the DM core is governed mainly by its self-gravity. The motion of NM near the core is influenced by the DM, but not vice versa. Furthermore, the total energy release and nucleosynthesis in the explosion depend mainly on the propagation of the flame, which lies well outside the DM core. It may thus be reasonable to neglect the motion of DM in the explosion.
As a first step towards understanding the effects of DM on SNIa explosions, we only model the dynamics of NM in the simulations. The DM core is assumed to be stationary and affects the NM only through its gravitational field. The hydrodynamic code solves the two-dimensional Euler equations for NM in cylindrical coordinates with a detailed nuclear reaction network coupled with sub-grid turbulence. The equations are
| (5) | |||
| (6) | |||
| (7) | |||
| (8) |
where , , , and are the mass density, velocities in the and directions, pressure and total energy density of the baryonic matter. The total energy density includes both the thermal and kinetic contributions , where is the specific internal energy. The specific turbulence energy is determined by Eq. (8). The gravitational potential is sourced by both fluids and is determined by the Poisson equation
| (9) |
In Eqs. (7) and (8), and are the heat sources from nuclear fusions and sub-grid turbulence, respectively; is the heat loss due to neutrino emission, and is the effective eddy viscosity. We refer the reader to (Niemeyer & Hillebrandt, 1995; Reinecke et al., 2002a) for a detailed discussion on how these quantities are determined in the simulations. To calculate the heat production from nuclear reactions, we incorporate the 19-isotope nuclear reaction network subroutine developed by Timmes (1999) into our hydrodynamic code. The isotopes include 1H, 3He, 4He, 12C, 14N, 16O, 20Ne, 24Mg, 28Si, 32S, 36Ar, 40Ca, 44Ti, 48Cr, 52Fe, 54Fe, 56Ni, neutron and proton. The fusion network includes reactions starting from hydrogen burning up to silicon burning. Reactions of and are also included.
We employ the PTD model as the explosion mechanism using the standard configurations that have been considered in the literature. In particular, an initial flame of shape is imposed for all the simulation models and the propagation of the flame is modeled by the standard level-set method (see Reinecke et al. (1999a) for details). Finally, we also construct the theoretical light curves from our simulation data by using the analytical model for SNIa (Arnett, 1982), which assumes the photon diffusion limit. This model takes three input parameters: the ejecta mass , ejecta velocity and the nickel mass , which can be derived from the simulation results. We also employ the opacity g-1cm2 and the gamma-ray deposition function according to Arnett (1982).
3. Results
3.1. General properties
In our simulations, the central density of NM is fixed to be because it is expected that the minimum density needed for triggering the thermonuclear explosion is about (Iwamoto et al., 1999; Woosley, 1997; LeSaffre et al., 2006; Seitenzahl et al., 2011). We treat the DM core mass as a parameter in the simulations, and we assume GeV unless otherwise noted.
The properties of four of our typical simulation models are listed in Table 1, where () and () are the central density and total mass of NM (DM), respectively. is the initial stellar radius. The first model 2D-PTD-3-0-c3 in the table represents a standard model without DM. The other three models in the table have different DM core masses ranging from to . All these configurations are very close to the corresponding Chandrasekhar-mass limits for the given . The resulting mass of 56Ni, energy released through nuclear reactions , and total energy are also presented in the table. For the same central density of NM, the baryonic mass of the star decreases as increases. However, the (baryonic) radius of the star increases with .
| Model | (km) | |||||||
|---|---|---|---|---|---|---|---|---|
| 2D-PTD-3-0-c3 | 3.0 | 0.0 | 1.377 | 0.00 | 0.33 | 7.2 | 2.1 | |
| 2D-PTD-3-1-c3 | 3.0 | 150 | 1.313 | 0.01 | 0.25 | 5.8 | 1.5 | |
| 2D-PTD-3-2-c3 | 3.0 | 530 | 1.223 | 0.02 | 0.14 | 3.9 | 0.46 | |
| 2D-PTD-3-3-c3 | 3.0 | 1050 | 1.015 | 0.03 | 1.1 | -0.85 |
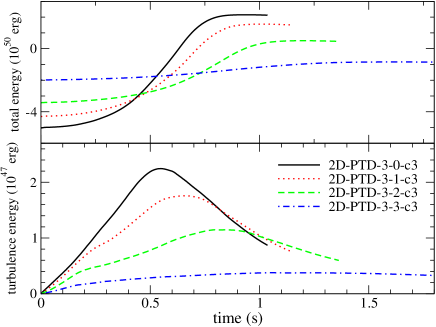
In the upper panel of Fig. 2 we plot the total energy for the models listed in Table 1. Note that for a fixed central NM density, the total NM mass decreases as increases. As a result, the initial total energy increases with because most of the binding energy is contributed by NM. At early time, models with less DM have faster energy growth than those with a more massive DM core. The total energy released, by comparing the initial and final energies, decreases when increases. For Model 2D-PTD-3-3-c3, the effects of the admixed DM core are so large that the WD remains bound at the end of the simulation due to its much lower energy release. In the lower panel of Fig. 2, we plot the total turbulence kinetic energy against time for the same models. Similar to the total energy released, the sub-grid turbulence energy drops when increases. The upper panel of Fig. 2 also shows that the rate of energy release, reflected by the slopes of the curves, decreases as increases, which implies that the time needed for a WD to reach the same amount of burnt matter increases. We list the mass fractions of major elements at the end of the simulations in Table 2. In general, the amounts of unburnt fuel and IME increase with , while those of iron-peaked elements drop. For example, the unburnt 12C are about 34% and 46% of the total mass for models 2D-PTD-3-0-c3 () and 2D-PTD-3-3-c3 (), respectively. On the other hand, the mass fraction of 56Ni decreases significantly from about 24% to 2.8% as increases from 0 to . This is related to the different initial density distributions in the models. For a larger , the amount of matter that can reach sufficiently high density for complete combustion decreases.
| Isotope | 2D-PTD-3-0-c3 | 2D-PTD-3-1-c3 | 2D-PTD-3-2-c3 | 2D-PTD-3-3-c3 |
| 12C | 0.30 | 0.32 | 0.36 | 0.43 |
| 16O | 0.33 | 0.35 | 0.39 | 0.46 |
| 24Mg | ||||
| 28Si | ||||
| 32S | ||||
| 36Ar | ||||
| 40Ca | ||||
| 44Ti | ||||
| 48Cr | ||||
| 52Fe | ||||
| 54Fe | ||||
| 56Ni | 0.22 | 0.18 | 0.11 |
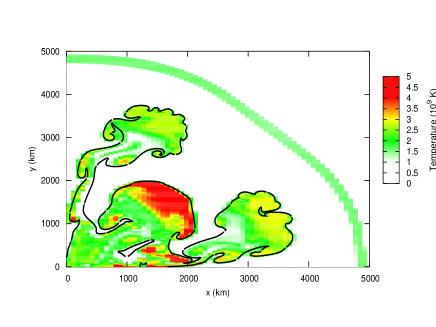
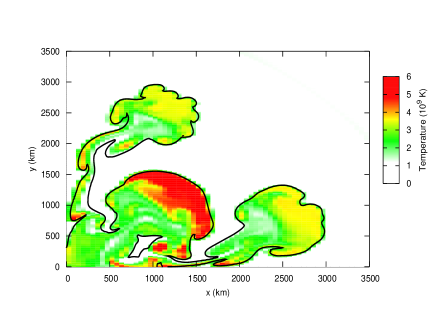
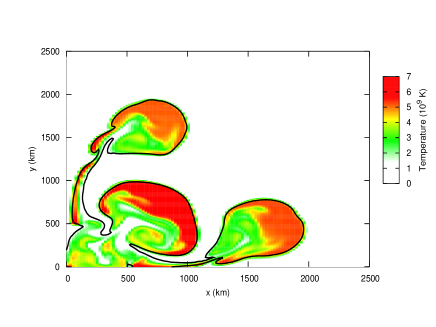
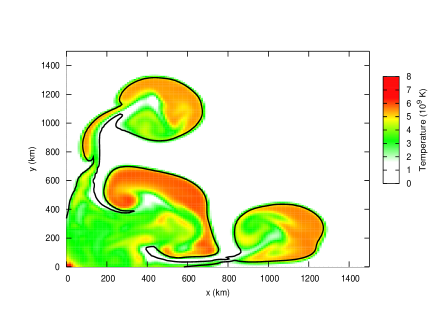
Next we consider the effects of DM on the flame surface. We plot in Figs. 3-6 the flame surfaces (represented by the temperature) at s for the models listed in Table 1. In Model 2D-PTD-3-0-c3, which is the standard PTD model without DM considered in the literature (see for example Niemeyer & Woosley (1997), Reinecke et al. (1999a) and Reinecke et al. (2002a)), the flame shows a convoluted structure, with clear instabilities of flame-fluid interaction including the Rayleigh-Taylor instabilities and Kelvin-Helmholtz instabilities. The injection of fuel into the flame can be seen as well. When increases, the injection of fuel can still be found. But the Kelvin-Helmholtz instabilities are suppressed. The flame surface also becomes smoother and less turbulent.
3.2. Connection with Sub-luminous Supernovae
The light curve of a sub-luminous SNIa has a low peak luminosity, suggesting that the 56Ni content is lower than ordinary SNIa. The explosion is very weak and only partial ejecta are dispelled instead of a disruption of the whole star. Notice that, how much and how the mass is ejected in the explosion are not clear unless the simulation continues until the homologous expansion phase is reached, which takes place about ten seconds after the deflagration/detonation stage has ended (Roepke & Hillebrandt, 2005; Roepke, 2005). However, this involves using either a sufficiently large simulation box which can accommodate the rapidly expanding ejecta or expanding meshes to prevent the ejecta from leaving the box (Roepke, 2005).
Since the amount of ejecta mass is an important parameter in constructing the resultant light curves from the simulations, we constrain it in the following ways. First the minimum ejecta mass is estimated by counting all the fluid elements with positive energy at the end of the simulation. Second we assume that the maximum ejecta mass is equal to the total mass of the star.
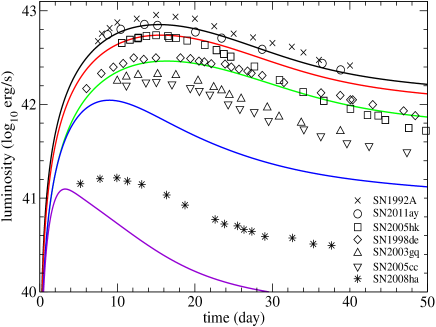
In Fig. 7 we show the bolometric light curves for the four simulation models listed in Table 1 (from the top solid line to the next-to-bottom solid line) and also one additional model (the bottom line) not listed in the table. The extra model has a DM core mass . For the first three models (2D-PTD-3-0-c3, 2D-PTD-3-1-c3, 2D-PTD-3-2-c3), the total final energies are positive and hence we use the maximum ejecta mass for each model to construct the light curves. On the other hand, we use the minimum ejecta mass to construct the light curves for the remaining two models because their total final energies are negative. Fig. 7 shows that the peak luminosity depends sensitively on . In particular, it can decrease by almost two orders of magnitude as increases from 0 to . In the figure, we also plot the data from the constructed bolometric light curves for some examples of sub-luminous SNIa for comparison. It can be seen that our SNIa simulations with admixed DM give a range of peak luminosities that covers the observed sub-luminous SNIa including the exceptionally dim SN2008ha.
Our results suggest that the variations of the observed light curves of different sub-luminous SNIa may be due to the fact that the underlying WDs of the systems contain different amounts of DM. For a given observed SNIa light curve, we can use as a parameter for performing hydrodynamical simulations to fit the observed data. In principle, for a given , a unique light curve can be determined by the resulting velocity profile and total mass of ejecta obtained from the simulation. However, as we discussed above, the total mass of ejecta cannot be determined accurately from the simulations due to computational limitations. We thus calculate two different light curves corresponding to the minimum and maximum ejecta masses for a chosen .
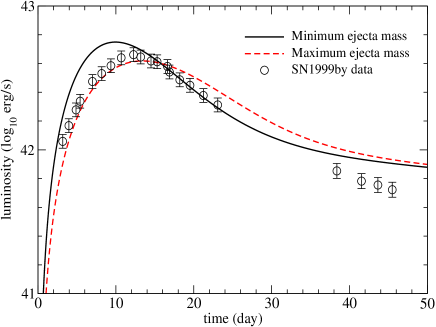
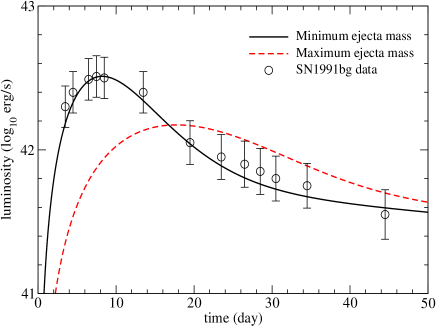
In Fig. 8 we plot the bolometric light curves by using the results from a simulation model with . The solid and dashed lines in the figure are obtained by using the minimum and maximum ejecta masses, respectively. This simulation model has a positive total final energy. As a result, the minimum and maximum ejecta masses estimated from the simulation are comparable, and hence the two constructed light curves are also quite close to each other. We expect that the light curve corresponding to the actual ejecta mass should lie between the two limits. In the figure, the observational data of a sub-luminous supernova SN1999by (with error bars) are also presented for comparison. The error bars correspond to the uncertainties in the distance modulus and measurements. It is seen that the data around the peak luminosity lie very close to the region between the two constructed theoretical light curves, which represents effectively our uncertainty in the calculation. At later time, the observational data decays faster than the theoretical light curves. One possible reason may be that our assumption of the opacity law and gamma-ray deposition function are no longer valid at later time.
As a different example, we plot in Fig. 9 the bolometric light curves of a simulation model with . Contrary to the simulation model with discussed above, this model has a negative total final energy and hence the estimated minimum ejecta mass differs from the maximum ejecta mass quite significantly. As a result, the two corresponding light curves (solid and dashed lines) are not close to each other. In the figure, the observational data of another sub-luminous supernova SN1991bg is also plotted, which agrees quite well with the theoretical light curve constructed with the minimum ejecta mass.
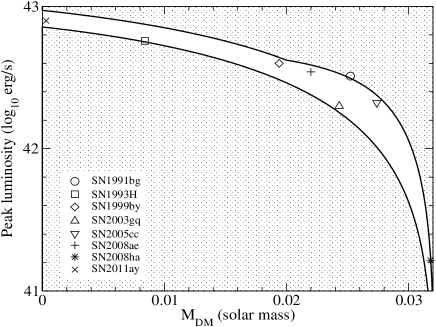
The above examples show that the admixture of dark matter can produce SNIa light curves with large variations in peak luminosities comparable with those of sub-luminous SNIa. also affects the peak luminosity, but its influence is much less pronounced than . On the other hand, dominates the width of a light curve. This suggests that the observational data of an SNIa can provide hint on the ejecta mass and its admixed DM mass, with determining the peak luminosity while the light curve width. Given the light curve data of an SNIa, we search for the best-fitted pair of and , where the values of and are derived from simulations as functions of . Models with the minimum chi-squared values are chosen to be the representing models of that SNIa. In Table 3 we list the models with minimum chi-squared values of several well observed sub-luminous SNIa. The table lists the agreeing , with their implied , ejecta velocity and the two ejecta mass limits and , which are derived from simulations. We regard that the DM admixture of this model can be a possible explanation of an observed sub-luminous SNIa if its fitted lies within the two limits of . All sub-luminous SNIa in the list except SN1991bg and SN1993H give an inside the two limits, showing that these SNIa could possibly have admixed DM cores in the WD progenitors. The SN1993H (SN1991bg) has an ejecta mass just above (below) the upper (lower) limit, showing that the observational data is declining slower (faster) than what the current configuration can provide.
In Fig. 10 we plot the peak-luminosity against the fitted of the mentioned SNIa. The peak luminosities of some observed SNIa are included as data points. The shaded regions of the plot are excluded by this model because these regions correspond to models with an ejecta mass out of the bounds. Given an the range of peak luminosities is very small compared to the observed range of SNIa peak luminosities. This implies that the admixed DM mass can be well constrained by the peak luminosity.
| Supernova | DM origin | ||||||
|---|---|---|---|---|---|---|---|
| SN1991bg | 0.025 | 0.20 | 0.084 | 0.44 | 1.14 | 0.21 | No |
| SN1993H | 0.008 | 1.37 | 0.216 | 0.74 | 1.35 | 0.69 | No |
| SN1999by | 0.019 | 0.61 | 0.148 | 0.58 | 1.24 | 0.54 | Yes |
| SN2003gq | 0.024 | 0.82 | 0.094 | 4.61 | 1.16 | 0.25 | Yes |
| SN2005cc | 0.027 | 0.33 | 0.058 | 3.70 | 1.01 | 0.14 | Yes |
| SN2008ae | 0.022 | 0.67 | 0.120 | 5.22 | 1.20 | 0.38 | Yes |
| SN2008ha | 0.032 | 0.12 | 0.004 | 2.19 | 1.00 | 0.09 | Yes |
| SN2011ay | 0.000 | 1.35 | 0.320 | 7.63 | 1.38 | 0.73 | Yes |
In summary, our work shows that the admixture of DM can explain the observation data of sub-luminous SNIa. However, as discussed in Sec. 1, it should be noted that matching of the bolometric light curves of sub- luminous SNIa can also be achieved in other models (Pakmor et al., 2010; Kromer et al., 2013a, b; Fink et al., 2014; Kromer et al., 2015).
4. Conclusion
In this paper, we have performed two-dimensional Newtonian hydrodynamic simulations to study the effects of DM on the thermonuclear explosion of WDs near the Chandrasekhar mass limit. Our initial models are constructed by solving the two-fluid hydrostatic equilibrium equations for NM and DM with a fixed central NM density of , which is expected to be near the minimum density for triggering the explosion. The typical models studied by us are solar-mass WDs with small DM cores () formed by DM with a particle mass of 1 GeV. As a first step towards understanding the effects of DM on SNIa, we assume that the DM core is stationary during the evolution, and we only model the dynamics of the NM fluid. This should be a good approximation as the DM core should be affected mainly by its self-gravity due to its high compactness. We employ the PTD model as the explosion mechanism and use the standard level-set method to model the flame surface during the dynamical evolution.
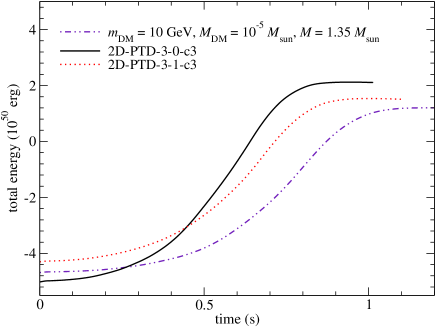
We have only considered the PTD model as the explosion mechanism in this work. It would be interesting to extend our work by using other possible explosion mechanisms such as the DDT and GCD models as discussed in Sec. 1. Finally, we have also assumed that the DM core is formed by non-self-annihilating fermionic DM with particle mass 1 GeV. How would our results be changed if one considers much more massive DM particle candidates? We plot in Fig. 11 the total energy against time for Models 2D-PTD-3-0-c3, 2D-PTD-3-1-c3 and an extra model similar to Model 2D-PTD-3-1-c3 but with and GeV. The initial mass of the extra model is 1.35 . Despite the small in the new case, the effects of DM on the energy release during explosion is comparable with Model 2D-PTD-3-1-c3, which has . As found in our previous work Leung et al. (2013), for the same or central density, a higher has a stronger effect on the density profile comparing to the case of GeV. It is because the DM core is more compact and creates a stronger gravitational attraction field, which changes the initial density profile more significantly. These changes in the density profiles are also reflected by the drop of energy release in SNIa explosions. Our results show that SNIa explosions are sensitive to both the drop of Chandrasekhar mass, as shown in the 1 GeV case, and to the particle mass. However, modeling more massive DM core with GeV is difficult because the region expected to be admixed with DM will be even smaller, implying that a much higher resolution is needed in order to model both DM and NM consistently.
Our numerical results show that an increase in or leads to a change in the SNIa explosion by either decreasing the Chandrasekhar limit for low or altering the density profile for high . First, the explosion becomes weaker and the total energy release is reduced. The total turbulence energy, which is an important indicator for the PTD model, also decreases. Second, the amounts of unburnt fuel and IME increase, while those of iron-peaked elements decrease. In particular, the total mass of 56Ni depends quite sensitively on and decreases from about 0.3 to as increases from 0.01 to for the GeV case. Finally, the Kelvin-Helmholtz instabilities are suppressed and the flame surface also becomes smoother and less turbulent as increases. We have also constructed the bolometric light curves from our simulations and compared them with the observational data of sub-luminous SNIa. Our results shows that varying the DM core mass from about 0.01 to yields a range of peak luminosities that covers the observational data very well. The variations of the observed light curves of different sub-luminous SNIa may be due to the fact that the precursor WDs contain different amounts of DM.
5. Acknowledgment
We thank F. X. Timmes for his open-source subroutines for the Helmholtz equation of state, nuclear reaction network and the neutrino emission luminosity. This work is partially supported by a grant from the Research Grant Council of the Hong Kong Special Administrative Region, China (Project No. 400910) and a CUHK Direct Grant 4053069. SCL is supported by the Research Grant Council of the Hong Kong Government through the Hong Kong PhD Fellowship Scheme.
References
- Aalseth & others (2011) Aalseth, C. E., et al. 2011, Phys. Rev. Lett., 106, 131301
- Arnett (1969) Arnett, W. D. 1969, Ap & SS, 5, 180
- Arnett (1982) —. 1982, Astrophys. J., 253, 785
- Barth & Deconinck (1999) Barth, T. J., & Deconinck, H. 1999, Lecture Notes in Computational Science and Engineering 9: High-Order Methods for Computational Physics (Springer)
- Benetti et al. (2005) Benetti, S., et al. 2005, Astrophys. J., 623, 1011
- Bernabei et al. (2013) Bernabei, R., et al. 2013, Int. J. Mod. Phys. A, 28, 1330022
- Bertone & Fairbairn (2008) Bertone, G., & Fairbairn, M. 2008, Phys. Rev. D, 77, 043515
- Bramante et al. (2013) Bramante, J., Fukushima, K., & Kumar, J. 2013, Phys. Rev. D, 87, 055012
- Branch & Tammann (1992) Branch, D., & Tammann, T. A. 1992, Ann. Rev. Astron. Astrophys., 30, 359
- de Lavallaz & Fairbairn (2010) de Lavallaz, A., & Fairbairn, M. 2010, Phys. Rev. D, 81, 123521
- Doull & Baron (2011) Doull, B. A., & Baron, E. 2011, Publ. Astron. Soc. Pac., 123, 765
- Fairbairn et al. (2008) Fairbairn, M., Scott, P., & Edsjo, J. 2008, Phys. Rev. D, 77, 047301
- Fan et al. (2011) Fan, Y.-Z., Yang, R.-Z., & Chang, J. 2011, Phys. Rev. D, 84, 103510
- Filippenko et al. (1992) Filippenko, A. V., et al. 1992, Astron. J., 104, 1543
- Fink et al. (2009) Fink, M., et al. 2009, Astron. Astrophys., 514, A53
- Fink et al. (2014) —. 2014, Mon. Not. R. astr. Soc., 438, 438
- Foley et al. (2009) Foley, R. J., et al. 2009, Astron. J., 138, 376
- Foley et al. (2014) —. 2014, Astrophys. J., 792, 29
- Freese et al. (2009) Freese, K., Spolyar, D., Bodenheimer, P., & Gondolo, P. 2009, arXiv:0903.0101v1
- Gamezo et al. (2004) Gamezo, V. N., Khokhlov, A. M., & Oran, E. S. 2004, Phys. Rev. Lett., 92, 211102
- Gamezo et al. (2005) —. 2005, Astrophys. J., 623, 337
- Goldman & Nussinov (1989) Goldman, I., & Nussinov, S. 1989, Phys. Rev. D, 40, 3221
- Gonzalez & Reisenegger (2010) Gonzalez, D., & Reisenegger, A. 2010, Astron. Astrophys., 522, A16
- Gould (1987a) Gould, A. 1987a, Astrophys. J., 321, 571
- Gould (1987b) —. 1987b, Astrophys. J., 321, 560
- Gould (1988) —. 1988, Astrophys. J., 328, 919
- Hirano et al. (2011) Hirano, S., Umeda, H., & Yoshida, N. 2011, Astrophys. J., 736, 58
- Hoeflich & Khokhlov (1996) Hoeflich, E., & Khokhlov, A. M. 1996, Astrophys. J., 457, 500
- Hoeflich et al. (1996) Hoeflich, P., et al. 1996, Astrophys. J., 472, L81
- Hooper et al. (2012) Hooper, D., Spolyar, D., Vallionotto, A., & Gnedin, N. Y. 2012, Phys. Rev. D, 81, 103531
- Iwamoto et al. (1999) Iwamoto, K., et al. 1999, Astrophys. J. Suppl., 125, 439
- Jordan et al. (2008) Jordan, G. C. I., et al. 2008, Astrophys. J., 681, 1448
- Jordan et al. (2012) —. 2012, Astrophys. J., 759, 53
- Kasen & Plewa (2007) Kasen, D., & Plewa, T. 2007, Astrophys. J., 662, 459
- Khoholov (1989) Khoholov, A. M. 1989, Mon. Not. R. astr. Soc., 239, 785
- Khokhlov (1991a) Khokhlov, A. M. 1991a, Astron. Astrophys., 245, 114
- Khokhlov (1991b) —. 1991b, Astron. Astrophys., 245, L25
- Khokhlov (1991c) —. 1991c, Astrophys. J., 246, 383
- Khokhlov et al. (1997) Khokhlov, A. M., Oran, E. S., & Wheeler, J. C. 1997, Astrophys. J., 478, 678
- Kouvaris (2008) Kouvaris, C. 2008, Phys. Rev. D, 77, 023006
- Kouvaris (2012) —. 2012, Phys. Rev. Lett., 108, 191301
- Kouvaris & Tinyakov (2010) Kouvaris, C., & Tinyakov, P. 2010, Phys. Rev. D, 82, 063521
- Kouvaris & Tinyakov (2011) —. 2011, Phys. Rev. D, 83, 083512
- Kromer et al. (2010) Kromer, M., et al. 2010, Astrophys. J., 719, 1067
- Kromer et al. (2013a) —. 2013a, Mon. Not. R. astr. Soc., 429, 2287
- Kromer et al. (2013b) —. 2013b, Astrophys. J., 778, L18
- Kromer et al. (2015) —. 2015, Mon. Not. R. astr. Soc., 450, 3045
- Leibundgut & Pinto (1992) Leibundgut, B., & Pinto, P. A. 1992, Astrophys. J., 401, 49
- LeSaffre et al. (2006) LeSaffre, P., Han, Z., Tout, C. A., Podsiadlowski, P., & Martin, R. G. 2006, MNRAS, 368, 187
- Leung et al. (2011) Leung, S.-C., Chu, M.-C., & Lin, L.-M. 2011, Phys. Rev. D, 84, 107301
- Leung et al. (2012) —. 2012, Phys. Rev. D, 85, 103528
- Leung et al. (2015) —. 2015, arXiv:1507.08549
- Leung et al. (2013) Leung, S.-C., Chu, M.-C., Lin, L.-M., & Wong, K.-W. 2013, Phys. Rev. D, 87, 123506
- Li et al. (2001) Li, W., et al. 2001, Astrophys. J., 546, 734
- Lisewski et al. (2000) Lisewski, A. M., Hillebrandt, W., & Woosley, S. E. 2000, Astrophys. J., 538, 831
- Livne & Glasner (1990) Livne, E., & Glasner, A. S. 1990, Astrophys. J., 361, 244
- Long et al. (2014) Long, M., et al. 2014, Astrophys. J., 789, 103
- McDermott et al. (2012) McDermott, S. D., Yu, H.-B., & Zurek, K. M. 2012, Phys. Rev. D, 85, 023519
- Meakin et al. (2009) Meakin, C. A., et al. 2009, Astrophys. J., 693, 1188
- Moll & Woosley (2013) Moll, R., & Woosley, S. E. 2013, Astrophys. J., 774, 137
- Moskalenko & Wai (2007) Moskalenko, I. V., & Wai, L. L. 2007, Astrophys. J., 659, L29
- Niemeyer & Hillebrandt (1995) Niemeyer, J. C., & Hillebrandt, W. 1995, Astrophys. J., 452, 769
- Niemeyer & Woosley (1997) Niemeyer, J. C., & Woosley, S. E. 1997, Astrophys. J., 475, 740
- Nomoto (1982a) Nomoto, K. 1982a, Astrophys. J., 253, 798
- Nomoto (1982b) —. 1982b, Astrophys. J., 257, 780
- Nomoto et al. (1976) Nomoto, K., Sugimoto, D., & Neo, S. 1976, Ap & SS, 39, 37
- Nomoto et al. (1984) Nomoto, K., Thielemann, F.-K., & Yokoi, K. 1984, Astrophys. J., 286, 644
- Pakmor et al. (2013) Pakmor, R., Kromer, M., Taubenberger, S., & Spiegel, V. 2013, Astrophys. J., 770, L8
- Pakmor et al. (2010) Pakmor, R., et al. 2010, Nature, 463, 61
- Paxton et al. (2011) Paxton, B., et al. 2011, Astrophys. J. Suppl., 192, 3
- Paxton et al. (2013) —. 2013, Astrophys. J. Suppl., 208, 4
- Paxton et al. (2015) —. 2015, arXiv:1506.03146
- Perez-Garcia & Silk (2014) Perez-Garcia, M. A., & Silk, J. 2014, arXiv:1403.6111
- Perlmutter et al. (1999) Perlmutter, S., et al. 1999, Astrophys. J., 517, 565
- Plewa (2007) Plewa, T. 2007, Astrophys. J., 657, 942
- Reinecke et al. (1999a) Reinecke, M., Hillebrandt, W., & Niemeyer, J. C. 1999a, Astron. Astrophys., 347, 739
- Reinecke et al. (2002a) —. 2002a, Astron. Astrophys., 386, 936
- Reinecke et al. (2002b) —. 2002b, Astron. Astrophys., 391, 1167
- Reinecke et al. (1999b) Reinecke, M., Hillebrandt, W., Niemeyer, J. C., Klein, R., & Gloebl, A. 1999b, Astron. Astrophys., 347, 724
- Riess et al. (1998) Riess, A. G., et al. 1998, Astron. J., 116, 1009
- Ripamonti et al. (2010) Ripamonti, E., et al. 2010, Mon. Not. Roy. Astron. Soc., 406, 2605
- Roepke (2005) Roepke, F. K. 2005, Astron. Astrophys., 432, 969
- Roepke et al. (2006) Roepke, F. K., Gieseler, M., Reinecke, M., Travaglio, C., & Hillebrandt, W. 2006, Astron. Astrophys., 453, 203
- Roepke & Hillebrandt (2005) Roepke, F. K., & Hillebrandt, W. 2005, Astron. Astrophys., 431, 635
- Roepke et al. (2007) Roepke, F. K., Hillebrandt, W., & Woosley, S. E. 2007, Astrophys. J., 660, 1344
- Ruiter et al. (2011) Ruiter, A. J., et al. 2011, Mon. Not. R. astr. Soc., 417, 408
- Ruiter et al. (2014) —. 2014, Mon. Not. R. astr. Soc., 440, L101
- Ruiz-Lapuente et al. (1993) Ruiz-Lapuente, P., et al. 1993, Nature, 365, 728
- Scalzo et al. (2014) Scalzo, R. A., Ruiter, A. J., & Sim, S. A. 2014, Mon. Not. R. astr. Soc., 445, 2535
- Seitenzahl et al. (2011) Seitenzahl, I. R., Ciaraldi-Schoolmann, F., & Roepke, F. K. 2011, MNRAS, 414, 2709
- Seitenzahl et al. (2013) Seitenzahl, I. R., et al. 2013, Mon. Not. R. astr. Soc., 429, 1156
- Sim (2010) Sim, S. A. 2010, Astrophys. J., 714, L52
- Sim et al. (2012) Sim, S. A., et al. 2012, Mon. Not. R. astr. Soc., 420, 3003
- Spolyar et al. (2008) Spolyar, D., et al. 2008, Phys. Rev. Lett., 100, 051101
- Spolyar et al. (2009) —. 2009, Astrophys. J., 705, 1031
- Timmes (1999) Timmes, F. X. 1999, Astrophys. J., 124, 241
- Timmes & Arnett (1999) Timmes, F. X., & Arnett, D. 1999, Astrophys. J., 125, 277
- Timmes & Swesty (1999) Timmes, F. X., & Swesty, F. D. 1999, Astrophys. J. Suppl., 126, 501
- Woosley (1997) Woosley, S. E. 1997, Astrophys. J., 476, 801
- Woosley & Weaver (1994) Woosley, S. E., & Weaver, T. A. 1994, Astrophys. J., 423, 371
6. Appendix: Effects of DM Admixture on SNIa progenitors
| 4 | 0 | 0.24 | 0.18 | 0.40 | 0.58 | ||||
| 4 | 0.01 | 0.24 | 0.19 | 0.47 | 0.50 | ||||
| 4 | 0.02 | 0.18 | 0.37 | 0.56 | 0.42 | ||||
| 4 | 0.03 | N/A | N/A | N/A | N/A | N/A | |||
| 7 | 0 | 0.32 | 0.13 | 0.44 | 0.54 | ||||
| 7 | 0.01 | 0.31 | 0.13 | 0.44 | 0.54 | ||||
| 7 | 0.02 | 0.31 | 0.13 | 0.47 | 0.50 | ||||
| 7 | 0.03 | N/A | N/A | N/A | N/A | N/A | N/A |
In this article we have studied how the gravity of DM affects the explosion energetics of SNIa. We have shown that with an admixed DM core with a total mass in the order of , the 56Ni production can be significantly suppressed and the corresponding light curves are comparable with those of sub-luminous SNIa. However, it remains unclear whether such a DM admixture can leave observable consequences already during the main-sequence phase, which is well constrained by observational data. Therefore, it is necessary to check if stars with DM admixture have unusual evolution paths that are inconsistent with observational data, and if the chemical compositions of the resultant white dwarfs are different from those of conventional cases.
A star acquires DM mainly by accretion through DM-NM scattering or by its inherent admixture that exists already during its formation stage, where DM acts as a stellar seed. However, following (Kouvaris, 2008) to estimate the DM accretion rate, using conventional DM parameters, the typical DM accretion rate is insignificant compared with the original mass of the star, even when we consider a duration of cosmological timescale. Therefore, it is unlikely that a star can acquire DM with a mass comparable with the host simply by accretion. We thus focus on DM which acts as a stellar seed. In that case, the gravity of DM is important even in the protostellar phase.
We performed main-sequence star simulations by using an open-source stellar evolution code MESA (Modules for Experiments in Stellar Astrophysics) (Paxton et al., 2011, 2013, 2015), which can follow the evolution of a star from the protostellar phase up to the white dwarf stage. We used the MESA code version 3372, which solves the fully coupled one-dimensional structure and composition equations simultaneously, using the Helmholtz EOS to describe the thermodynamics properties of NM. The DM is assumed to be in hydrostatic equilibrium, and to a good approximation, the DM profile remains static during the simulation. We observed that due to the compactness of the DM core, in most of the stellar lifetime, the DM core has a size smaller than the outer radius of the innermost fluid elements. Effectively, we modified the hydrostatic equation in the MESA code by including the DM core which behaves like a point-mass as
| (10) |
All notations have the same meaning as those in the main text. Due to the singular behavior of the DM potential near the core, there are numerical difficulties that the results are resolution dependent. Also, the typical time-step becomes prohibitively small, due to the large potential gradient, which leads to a large density gradient and hence a large chemical composition gradient near the core. Also, the potential from the DM leads to divergence in constructing the initial model. To ameliorate these problems, we smear out the effect of DM by increasing the innermost fluid elements from to . This allows us to capture the effects of DM’s gravity within a reasonable simulation time.
We use the star evolution model 1M_pre_ms_wd in the test suite package to follow the stellar evolution from the protostellar phase. We considered star models with a mass from 4 to 7 , which are believed to be the progenitors of carbon-oxygen white dwarfs.
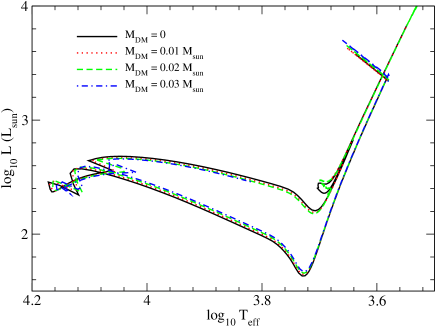
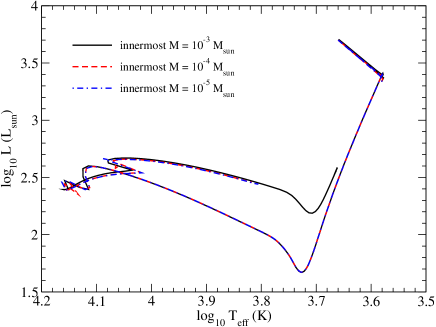
To show that the rise of innermost fluid element mass does not introduce spurious results, we plot in Fig. 12 the HR diagram of a star with 4 NM and 0.03 DM, but with different innermost fluid element masses. We do not follow the whole evolution till the formation of the white dwarf because the timestep has already become prohibitively small when it enters the helium burning phase. We stopped the simulation when the average time step drops below years. In the mass range considered, the qualitative behavior of the stellar evolution remains unchanged. This shows that in this resolution the basic properties of the main-sequence phase are captured. The model with a higher innermost mass shell can run longer due to the stronger smearing of the DM point-mass gravity.
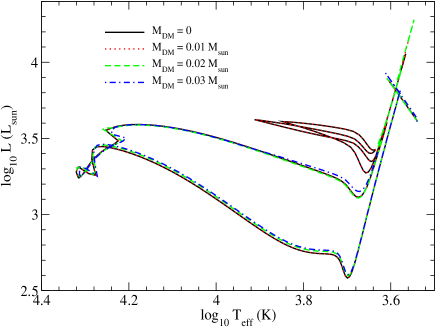
We plot in Figs. 13 and 14 the HR diagrams for star models with a normal matter mass of 4 and 7 solar masses, but for different . In both figures, the evolution paths of the hydrogen burning phase and the helium burning phase are insensitive to . We terminated the simulations for before the exhaustion of core helium because of the small time-steps. One qualitative difference that can be observed is the disappearance of the horizontal branch during helium burning for the model with and .
In Table 4 we tabulate the stellar properties extracted from profiles at the end of simulations, and also the age of the star when hydrogen or helium burning starts or ends. No results are listed for models with because the simulations are terminated before the helium burning phase commences. For models with , when increases, the helium mass decreases while the carbon-oxygen mass increases. Also, hydrogen burning begins and ends sooner, with the whole hydrogen burning lifetime shortened. Similar features are observed for the helium burning. The 12C mass fraction increases while that of 16O decreases. The effects of DM in models with become smaller so that there is almost no change when . But as further increases, similar effects can still be observed, including a lower helium mass, earlier hydrogen and helium burning and a shorter main-sequence lifetime. Also, an increase (a decrease) in 12C (16O) mass fraction is observed.
From the above comparison, we have shown that in the mass range of considered in the main text, the DM core which is assumed to exist as early as the star forms, does not alter the stellar evolution significantly. Specifically, all models predict a path during the main-sequence phase in the HR diagram comparable with the cases without DM. Moreover, the final chemical composition of the carbon-oxygen white dwarf does not deviate significantly from what we have assumed, a 50 % carbon and 50 % oxygen by mass.