Measurements of jet-related observables at the LHC
Abstract
During the first years of the LHC operation a large amount of jet data was recorded by the ATLAS and CMS experiments. In this review several measurements of jet-related observables are presented, such as multi-jet rates and cross sections, ratios of jet cross sections, jet shapes and event shape observables. All results presented here are based on jet data collected at a center-of-mass energy of 7 TeV. Data are compared to various Monte Carlo generators, as well as to theoretical next-to-leading-order calculations allowing a test of perturbative Quantum Chromodynamics in a previously unexplored energy region.
keywords:
Jet and multi-jet rates and cross sections; Ratios of jet cross sections; Jet event shapes; Jet shapes.PACS numbers:
1 Introduction
After three years of very successful operation of the Large Hadron Collider (LHC), a large amount of jet data was recorded both by the ATLAS[1] and CMS[2] experiments. Up to now these collaborations published results on jet cross sections, ratios of jet cross sections, multi-jet rates and other jet related observables using the data collected during the first two years at a center-of-mass energy of 7 TeV. The goals of these studies are to test perturbative Quantum Chromodynamics (pQCD) in a previously unexplored energy region, check the Standard Model (SM) predictions at high energy scales, measure and understand the main background to many new physics searches, determine the strong coupling constant and its running, and provide constraints on parton distribution functions (PDFs).
At leading order (LO) in pQCD, jet production in proton-proton (pp) collisions occurs when two partons interact via the strong force to produce two final-state partons. Each of the final state particles may subsequently lose energy by emitting other quarks and gluons in a process referred to as a parton shower (PS). Finally, the products of the parton shower undergo hadronisation and form hadron jets. Events with three or more jets in the final state originate from hard-gluon radiation and other higher-order QCD processes.
Classical measurements are those of the inclusive jet and dijet mass cross section, which are presented in Refs. \refciteCMS_incl to \refciteATLAS_incl7TeV and also discussed in a separate review in this volume[10] . Here, a review of recent measurements on other jet-related observables at the LHC is presented, based on the data collected during 2010 and 2011 at a center-of-mass energy of 7 TeV. The review is organized as follows: Section 2 presents results on multi-jet rates and cross sections. In section 3 measurements of ratios of jet cross sections are presented. Section 4 presents results on jet shapes observables. In section 5 measurements of event shapes are presented, followed by the conclusions in Section 6.
2 Multi-jet rates and cross sections
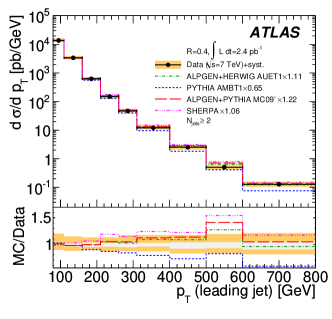
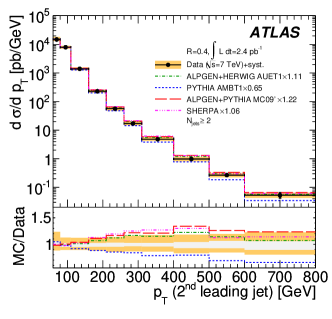
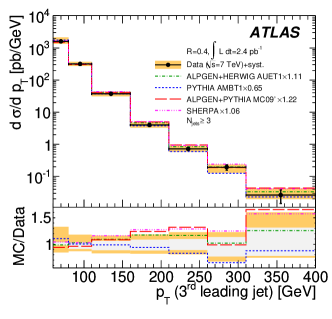
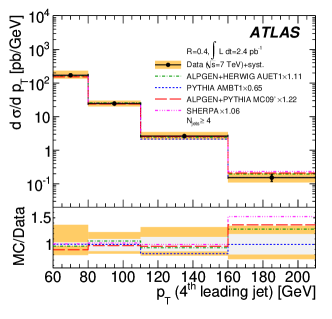
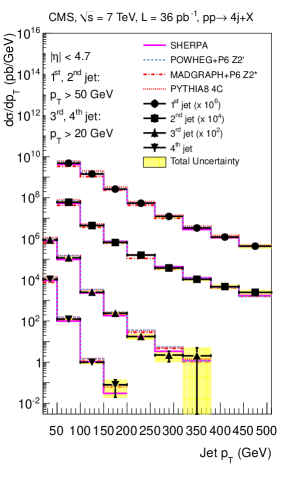
The goal of the studies with the very first LHC jet data was to test the performance of the different LO Monte Carlo (MC) simulations, so that they can be used to estimate multi-jet backgrounds for new particle searches. For example the ATLAS collaboration, in Ref. \refciteATLAS_multijets, presents studies on inclusive multi-jet production, using the very first jet data collected during 2010 which correspond to an integrated luminosity of . Figure 1 shows the -dependent differential cross sections for the first four leading jets in multi-jet events. The results are compared to different LO MC simulations based on the pythia [12] , Alpgen [13] and Sherpa [14] generators using various optimised sets of parameters (so-called tunes). All MC simulations agree reasonably well with the data.
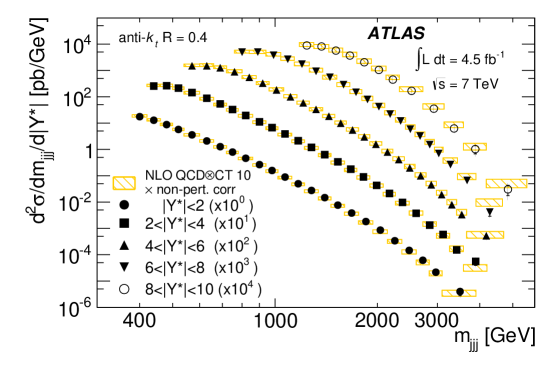
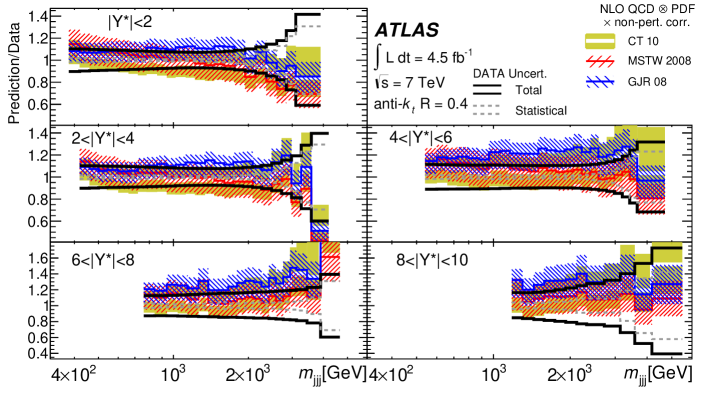
In Ref. \refciteATLAS_3jetCrossSections the ATLAS collaboration presents the measurement of double-differential three-jet production cross sections as a function of the three-jet mass and the sum of absolute rapidity separation between the three leading jets . The measurement is done for two different values of the jet radius parameter, and , using a data sample corresponding to an integrated luminosity of collected with the ATLAS detector during 2011. The goal of this study is to test the description of multi-jet events in next-to-leading-order (NLO) QCD, and provide constraints on the proton PDFs beyond those from inclusive and dijet cross sections. Figure 2, on the top, shows the comparison of the three-jet double-differential cross section as a function of , binned in , to NLO predictions times non-perturbative (NP) corrections using the CT10[16, 17]-NLO PDF set. The same figure on the bottom shows the ratio of data to NLO predictions using different PDF sets, like CT10, MSTW2008[18, 19] , and GJR08[20] . It is found that for a jet radius parameter most PDF sets are able to describe the data well. Theory predictions for underestimate the data across the full plane. The discrepancy is covered by the experimental and theoretical uncertainty bands and it has only a minor dependence on the PDF set used.
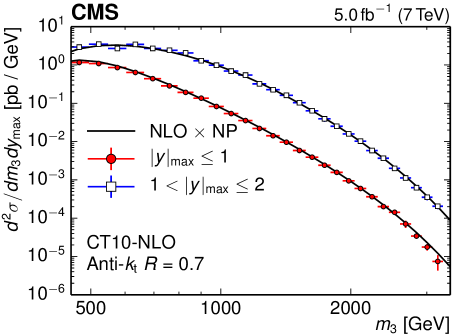
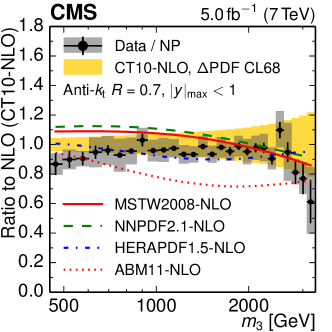
The differential 3-jet production cross section as a function of the invariant mass and the maximum rapidity of the 3-jet system has been published by the CMS collaboration in Ref. \refciteCMS_3jetmass. The measurement is done in two rapidity bins with and using an integrated luminosity of collected with the CMS detector during 2011. Figure 3, on the left, shows the comparison of the 3-jet mass distribution to the NLO prediction employing the CT10 PDF set times non-perturbative corrections. It is observed that pQCD is able to describe the cross section as a function of the 3-jet mass over five orders of magnitude and for 3-jet masses up to 3 TeV. The same figure on the right presents the ratios of the measured cross sections, for the lowest rapidity bin, to theoretical predictions including NP effects, using various PDF sets, such as CT10, NNPDF2.1[22, 23] , MSTW2008, HERAPDF1.5[24] and ABM11[25] . Within uncertainties most PDF sets are able to describe the data. This measurement is used by the CMS collaboration for the determination of the strong coupling constant, , see Ref. \refciteJuan.
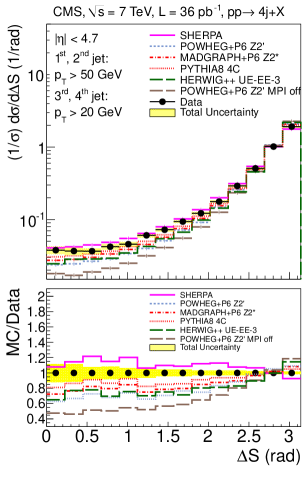
Considering a final state of higher complexity, the differential cross section for the production of exactly four jets is interesting to study. This measurement has been performed by the CMS collaboration as a function of the jet transverse momentum and rapidity , c.f. Ref. \refciteCMS_4_jets. Events with four jets can be produced via a single hard parton scattering (SPS) process, where two or more partons at high are produced, with the initial- and final-state QCD radiation resulting in additional jets at lower . Multiparton interactions (MPI) can lead to the production of events, where more than one partonic interaction has occured in the same pp collision. In this case a pair of hard jets and a pair of softer jets can be produced via double parton scattering (DPS) leading to events with four jets. The SPS and DPS processes result in different distributions of angular correlations in observables such as the azimuthal angle between the two dijet pairs. The analysis is based on a data sample collected in 2010, with an integrated luminosity of . Figure 4 shows the cross sections for the production of exactly four jets as a function of the jet transverse momenta (left), and the azimuthal angle between the two dijet pairs (right), compared to predictions of various MC generators, like powheg [28, 29] , MadGraph [30] , Sherpa , pythia8 [31] and herwig++ [32] . It is found that the models considered are able to describe the differential cross sections only in some regions of the phase space. Especially, the distribution is not described by any of the predictions and this may be taken as an indication for the need of including DPS in the investigated models.
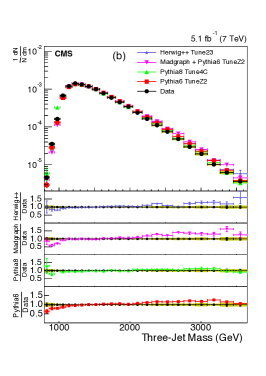
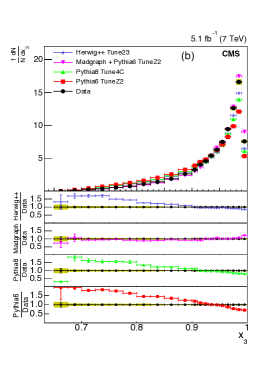
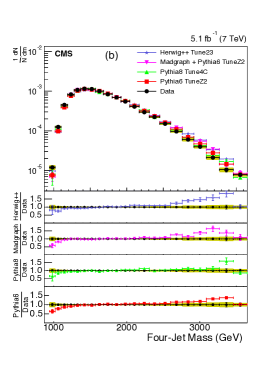
In Ref. \refciteCMS_multijet, the CMS collaboration presents studies of inclusive topological distributions of three- and four-jet events using a data sample corresponding to an integrated luminosity of collected during 2011. These studies of three-jet events include the invariant mass of the system and the scaled energy distributions of the first and second jet. The scaled energy of the jet is defined as twice it’s energy divided by the mass of the three-jet system. In the case of four-jet events, the four-jet mass and two event plane angles, namely the Nachtmann-Reiter[34] and the Bengtsson-Zerwas[35] angle, are presented. For example, in Fig. 5 the three-jet mass, the scaled energy of the leading jet in the three-jet system, and the four-jet mass are presented. Data are compared to predictions of various LO MC models, with those from MadGraph + pythia6 being closest to the data for most of the observables. The multi-jet observables presented in this study are sensitive to higher-order processes and the approximations used in their treatment. Furthermore, they provide a good test of various LO MC models widely used at the LHC.
3 Ratios of jet cross sections
The advantages of measuring ratios of jet cross sections are the reduction of several experimental uncertainties, such as uncertainties in the jet energy scale and in the luminosity determination, as well as of several theoretical systematic uncertainties related to the choice of the renormalisation and factorisation scales, and , and to NP effects. For these reasons ratios of jet cross sections provide a nice tool for testing pQCD, tuning MC models, constraining PDFs or determining the strong coupling constant.
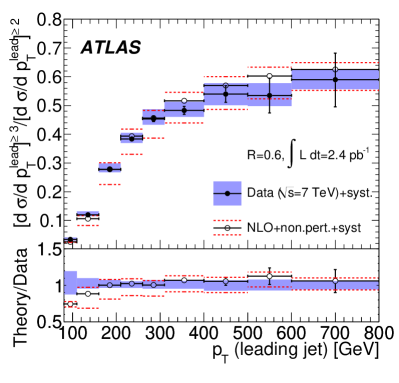
A measurement with particular sensitivity to limitations in the LO MC simulations and NLO pQCD calculations is the ratio of the inclusive 3-jet cross section to the inclusive 2-jet cross section. In Ref. \refciteATLAS_multijets, the ATLAS collaboration presents the measurement of as a function of the leading jet and the total jet transverse momentum of the event, . The results are compared to LO MC simulations, as well as to NLO theoretical predictions corrected for NP effects. For example, Fig. 6 (left) shows the measured distribution together with the NLO prediction. Within uncertainties a nice agreement between data and theory is observed.
The CMS collaboration has presented measurements of in two publications, see Refs. \refciteCMS_R32_Ht and \refciteCMS_R32_as. In the first publication, is measured versus , using an integrated luminosity of collected during 2010. The measurement is used to test the validity of various MC generators such as pythia6 , pythia8 , herwig++ , MadGraph , and Alpgen , at multi-TeV scales. All MC generators describe the data within 20%, with MadGraph giving the best results.
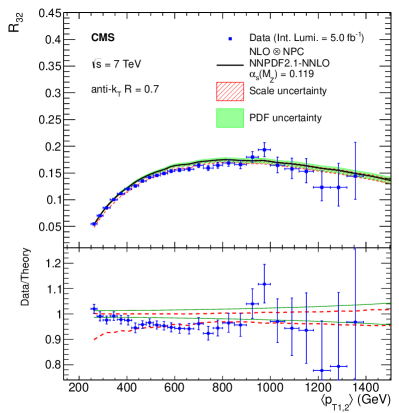
In a second publication, CMS presented a measurement of as a function of the average transverse momentum of the two jets leading in , using an integrated luminosity of collected during 2011. Data are compared to NLO theoretical predictions using various PDF sets. For example, Fig. 6 (right) shows the measured ratio together with the NLO prediction using the NNPDF2.1 PDF set. Within uncertainties most PDF sets are able to describe the data. This measurement, due to its sensitivity to the strong coupling constant, has been used by the CMS collaboration for the first determination of in the TeV region, see Ref. \refciteJuan.
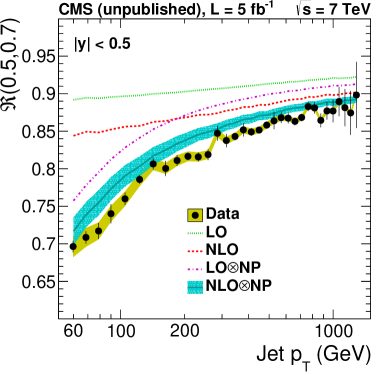
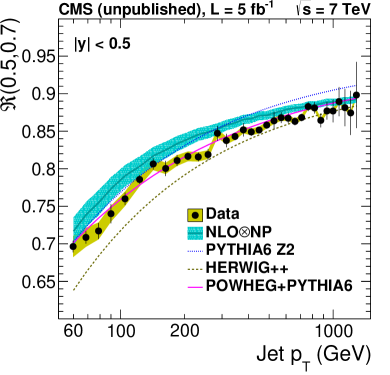
A three-jet observable which is sensitive to the pattern of QCD radiation at NLO (including terms up to ), is the ratio of the inclusive jet cross sections using the clustering algorithm with two radius parameters, and . The CMS collaboration has presented the measurement of in Ref. \refciteCMS_ak7ak5. Figure 7 shows in the central rapidity bin , compared to LO and NLO predictions with and without NP corrections (left), as well as to NLO calculations corrected for NP effects and to MC predictions (right). The study of this observable shows that models using LO (pythia6 , herwig++ ) or NLO matrix element calculations matched to the parton showers (powheg +pythia6 ), give a better description than the fixed order calculations corrected for NP effects. The best description for is obtained by powheg +pythia6 . This demonstrates that jet radius dependent effects, measurable in data, require pQCD predictions with at least one order higher than NLO or a combination of NLO matrix elements and parton showers.
4 Jet Shapes
Jet shapes, the normalised transverse momentum flow as a function of the distance to the jet axis, provide information about the details of the parton-to-jet fragmentation process, see e.g. Ref. \refciteJet_shapes_Ellis. The ATLAS and CMS collaborations have provided the first measurements of jet shapes in proton-proton collisions at the LHC, see Refs. \refciteATLAS_jet_shapes and \refciteCMS_jet_shapes.
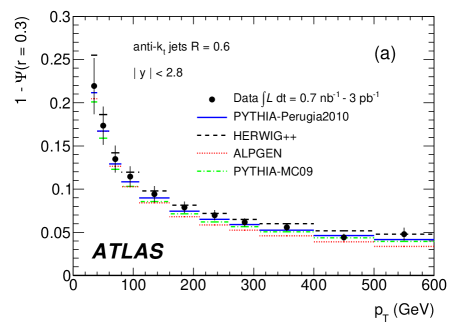
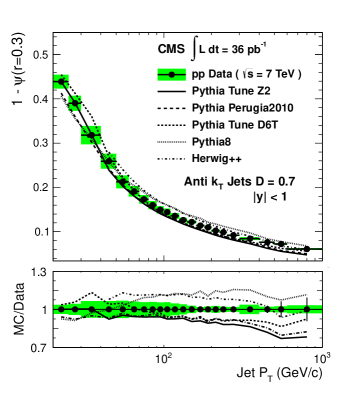
Traditionally, the internal structure of a jet is studied in terms of the differential and integrated jet shapes. The differential jet shape , with being the distance to the jet axis, is defined as the average fraction of the transverse momentum contained inside an annulus of inner and outer radius and around the jet axis. Alternatively, the integrated jet shape is defined as the average fraction of the transverse momentum of particles inside a cone of radius around the jet axis.
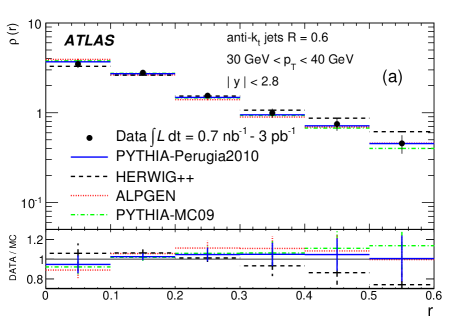
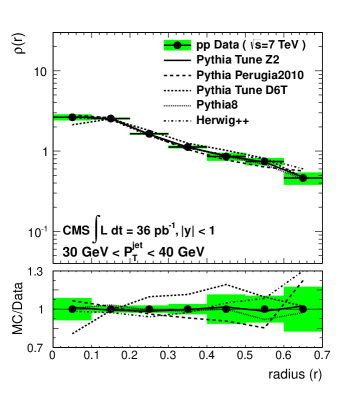
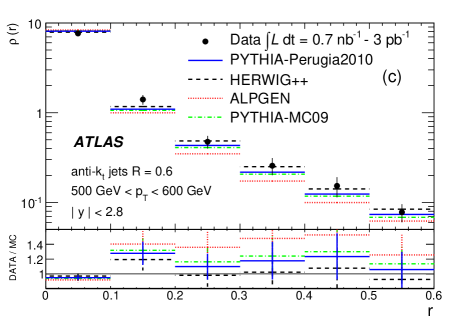
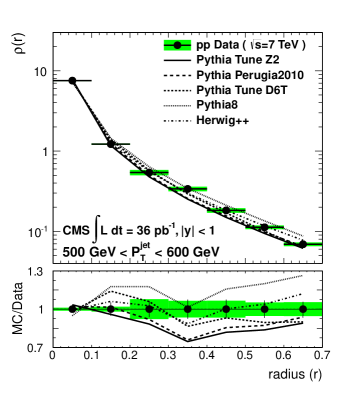
Figure 8 shows the differential jet shape measured by ATLAS, for (left) and by CMS for (right), and for two represenative bins in jet , (top) and (bottom). The peak at small indicates that the majority of the jet momentum is concentrated close to the jet axis. At high jet the peak is higher, indicating that jets are highly collimated with most of their close to the jet axis. About 95% of the transverse momentum is contained within a cone of radius . This fraction decreases down to 80% at low jet , where jets become wider. This is also demonstrated in Fig. 9, where the measured integrated jet shape from ATLAS (left) and CMS (right) is shown as a function of jet . Data from ATLAS and CMS are compared to predictions of various MC generators such as PYTHIA6, PYTHIA8, HERWIG++, and ALPGEN in various tunes, thus giving interesting sensitivity to a variety of perturbative and non-perturbative effects.
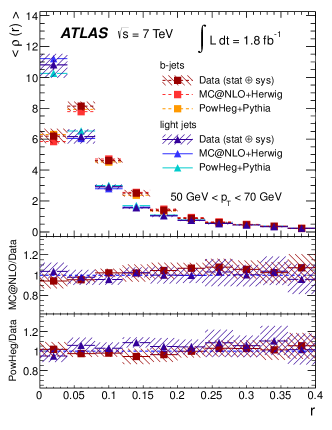
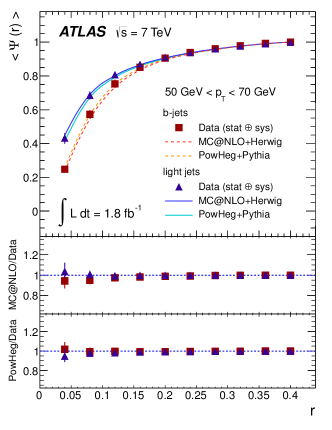
In Ref. \refciteATLAS_jet_shapes_ttbar ATLAS also presented the first measurement of b-jet shapes in top pair events. This measurement allows the study of the differences between the b-quark and light-quark jets, using the differential and integrated jet shapes. Figure 10 shows the differential (, left) and the integrated (, right) jet shapes, as a function of the radius for b-jets (squares) and light jets (triangles) in a representative bin of jet , . The analysis shows that b-jets are broader than light jets, with the cores of light jets having a larger energy density than those of b-jets. The measurement of the integrated jet shape, , shows that for low values of it is possible to distinguish b-jets from light jets. The MC event generators [43]+HERWIG and POWHEG+PYTHIA reproduce well the jet shapes for both light and b-jets.
5 Jet Event Shapes
Event shape variables are geometric properties of the energy flow in hadronic final states. They are sensitive to QCD radiation, as gluon emission changes the shape of the energy flow, providing an indirect probe of multi-jet topologies.
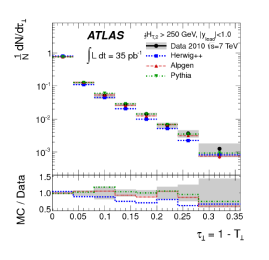
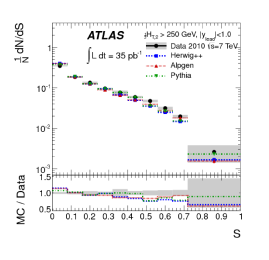
ATLAS (in Ref. \refciteATLAS_event_shapes) and CMS (in Refs. \refciteCMS_event_shapes1 and \refciteCMS_event_shapes2) presented the first event shapes measurements at LHC, for testing the validity of various MC generators. These include: the event thrust and its minor component ; the sphericity and its transverse component ; the aplanarity A; the jet broadening ; the total jet mass and its transverse component ; and the third-jet resolution parameter . Phenomenological discussions and definitions of event shapes at hadron colliders can be found in Refs. \refciteEvent_shapes_phen1 and \refciteEvent_shapes_phen2.
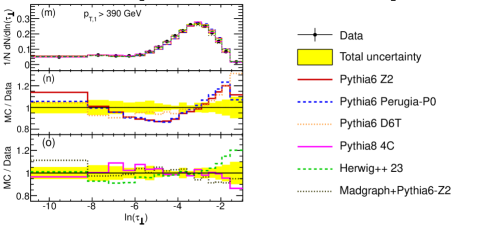
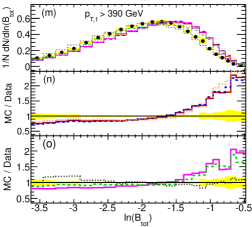
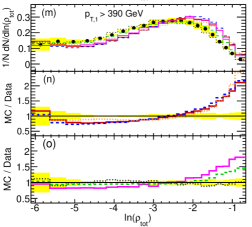
Figure 11 shows the event thrust (left) and the sphericity (right), measured by the ATLAS collaboration, using an integrated luminosity of collected during 2010. Data are compared to predictions of herwig++ , Alpgen and pythia MC simulations, showing reasonable agreement. In Fig. 12, the measurements of the event thrust (top left), the jet broadening (bottom left) and the total jet mass (bottom right) distributions, measured by the CMS collaboration, are presented. This analysis uses an integrated luminosity of collected during 2011. Data are compared to the pythia6 , pythia8 , herwig++ , and MadGraph MC generators. For the event thrust, all generators show an overall agreement with data within 10%, with pythia8 and herwig++ exhibiting a better agreement than the others. For the jet broadening and the total jet mass the agreement of the various MC generators with data is poor, except for MadGraph , which provides a good description of the measurements.
6 Conclusions
A review has been presented on recent measurements of jet-related observables at the LHC, such as multi-jet rates and cross sections, ratios of jet cross sections, jet shapes and event shape observables. The measurements are based on the data collected during the first two years of the LHC operation in proton-proton collisions at the center-of-mass energy of 7 TeV.
These observables are compared to predictions of various widely used LO and some recent higher-order MC generators, providing valuable information regarding their usage at LHC energies. Furthermore, data are compared to predictions of NLO calculations, thus providing a test of pQCD in a previously unexplored energy region and constraining our knowledge of the Standard Model and its phenomenology. QCD is the main background in many searches of new physics and in this sense the overall good agreement between data and theoretical predictions provides a solid foundation for searches beyond the Standard Model.
In the coming years the continuation of the analyses, by ATLAS and CMS, on the 8 TeV data will provide more information on these jet-observables, completing the QCD physics program based on the data of the first three-years operation period of LHC. And of course, even more data are anticipated in the near future, from the 13 TeV LHC run.
References
- [1] ATLAS Collab. (G. Aad et al.), JINST 3, S08003 (2008).
- [2] CMS Collab. (S. Chatrchyan et al.), JINST 3, S08004 (2008).
- [3] CMS Collab. (S. Chatrchyan et al.), Phys Rev. Lett. 107, 132001 (2011).
- [4] CMS Collab. (S. Chatrchyan et al.), Phys. Lett. B 700, 187 (2011).
- [5] ATLAS Collab. (G. Aad et al.), Eur. Phys. J. C 71, 1512 (2011).
- [6] ATLAS Collab. (G. Aad et al.), Phys. Rev. D 86, 014022 (2012).
- [7] CMS Collab. (S. Chatrchyan et al.), Phys. Rev. D 87, 112002 (2013).
- [8] ATLAS Collab. (G. Aad et al.), EPJC 73, 2509 (2013).
- [9] ATLAS Collab. (G. Aad et al.), JHEP 02, 153 (2015).
- [10] P. Francavilla, Measurements of inclusive jet and dijet cross sections at the LHC, article in this volume of reviews.
- [11] ATLAS Collab. (G. Aad et al.), Eur. Phys. J. C 71, 1763 (2011).
- [12] T. Sjostrand, S. Mrenna, and P. Z. Skands, JHEP 05, 026 (2006).
- [13] M.L. Mangano, JHEP 07, 001 (2003).
- [14] T. Gleisberg et al, JHEP 02, 007 (2009).
- [15] ATLAS Collab. (G. Aad et al.), Eur. Phys. J. C 75, 228 (2015)
- [16] H.-L. Lai et al., Phys. Rev. D 82,074024 (2010).
- [17] J. Gao et al., Phys. Rev. D 89, 033009 (2014).
- [18] A.D. Martin, W.J. Stirling, R.S. Thorne and G. Watt, Eur. Phys. J. C 63, 189 (2009).
- [19] A.D. Martin, W.J. Stirling, R.S. Thorne and G. Watt, Eur. Phys. J. C 64, 653 (2009).
- [20] M. Gluck, P. Jimenez-Delgado, E. Reya, and C. Schuck Phys. Lett. B 664, 133 (2008).
- [21] CMS Collab. (S. Chatrchyan et al.), Eur. Phys. J. C 75, 288 (2015)
- [22] R.D. Ball et al., Nucl. Phys. B 838, 136 (2010).
- [23] R.D. Ball et al., Nucl. Phys. B 849, 296 (2011).
- [24] H1 and ZEUS Collab. (F.D. Aaron et al.), JHEP 01, 109 (2010).
- [25] S. Alekhin, J. Bl mlein and S. Moch, Phys. Rev. D 86, 054009 (2012).
- [26] J. Rojo, Constraints on parton distributions and the strong coupling from LHC jet data, article in this volume of reviews.
- [27] CMS Collab. (S. Chatrchyan et al.), Phys. Rev. D 89, 092010 (2014).
- [28] S. Frixione, P. Nason, and C. Oleari, JHEP 11, 070 (2007).
- [29] S. Alioli, P. Nason, C. Oleari, and E. Re, JHEP 06, 043 (2010).
- [30] J. Alwall et al, JHEP 06, 128 (2011).
- [31] T. Sjostrand, S. Mrenna, and P. Z. Skands, Phys. Commun. 178, 852 (2008).
- [32] M. Bahr et al, Eur. Phys. J. C 58, 639 (2008).
- [33] CMS Collab. (S. Chatrchyan et al.), Eur. Phys. J. C 75, 302 (2015)
- [34] O. Nachtmann and A. Reiter, Z. Phys. C 16, 45 (1982).
- [35] M. Bengtsson and P. M. Zerwas, Phys. Lett. B 208, 306 (1988).
- [36] CMS Collab. (S. Chatrchyan et al.), Phys. Lett. B 702, 336 (2011).
- [37] CMS Collab. (S. Chatrchyan et al.), Eur. Phys. J. C 73, 2604 (2013).
- [38] CMS Collab. (S. Chatrchyan et al.), Phys. Rev. D 90, 072006 (2014).
- [39] S. D. Ellis, Z. Kunszt, and D. E. Soper, Phys. Rev. Lett. 69, 3615 (1992).
- [40] ATLAS Collab. (G. Aad et al.), Phys. Rev. D 83, 052003 (2011).
- [41] CMS Collab. (S. Chatrchyan et al.), JHEP 06, 160 (2012).
- [42] ATLAS Collab. (G. Aad et al.), Eur. Phys. J. C 73, 2676 (2013).
- [43] S. Frixione et al, JHEP 01, 053 (2011).
- [44] ATLAS Collab. (G. Aad et al.), Eur. Phys. J. C 72, 2211 (2012).
- [45] CMS Collab. (S. Chatrchyan et al.), Phys. Lett. B 699, 48 (2011).
- [46] CMS Collab. (S. Chatrchyan et al.), JHEP 10, 087 (2014).
- [47] A. Banfi, G. P. Salam, and G. Zanderighi, JHEP 08, 062 (2004).
- [48] A. Banfi, G. P. Salam, and G. Zanderighi, JHEP 06, 038 (2012).