Universality, Correlations, and Rankings in the Brazilian Universities National Admission Examinations
Abstract
The scores obtained by students that have performed the ENEM exam, the Brazilian High School National Examination used to admit students at the Brazilian universities, is analyzed. The average high school’s scores are compared between different disciplines through the Pearson correlation coefficient. The results show a very large correlation between the performance in the different subjects. Even thought the students’ scores in the ENEM due to the standardization form a Gaussian, we show that the high schools’ scores form a bimodal distribution that can not be used to evaluate and compare performance over time. We also show that this high schools distribution reflects the correlation between school performance and economic level of the students. The ENEM’s scores are compared with a Brazilian non standardized exam, the entrance exam at the Universidade Federal do Rio Grande do Sul. The comparison of the performance of the same individuals in both tests is compared showing that the two tests not only select different abilities but chooses a different set of individuals. Our results indicates that standardized exams might be an interesting tool to compare performance over the years but only of individuals and not of institutions.
1 Introduction
The selection of the part of the population that have access to high education is challenge particularly because this has important implication in the future of nation. China was the first country in the world to face this challenge. The imperial examination created in 605 during the Sui Dynasty was a civil service examination system in Imperial China to select candidates for the state bureaucracy. This system persisted until its extinction in 1905 [1].
Recognizing that having a standardized test to select the elite would guarantee the future of the United Kingdom, the idea of the test was introduced into Europe in the early 19th century by the Britain’s consul in Guangzhou, China, Thomas Taylor Meadows [2]. In 1806 the United Kingdom introduced the selection of public servants through an examination.
In the high education system the standardized test was first employed by Napoleon that created le baccalauréat or simply le bac. In the United Kingdom it was created the the General Certificate of Secondary Education. It was from Britain that standardized testing spread, not only throughout the British Commonwealth, but to Europe and then America. In the United States two systems dominate the selection of the universities: the Scholastic Aptitude Test (SAT) and the American College Testing (ACT) created in 1926 and in 1959 respectively. The first focus on evaluation abilities while the second measures deduction skills.
The current standardize tests in the United States, European Countries and Asia have in common that they are organized in such a way that the scores follow a normal distribution [3, 4], , that is characterized by the mean and standard deviation . The result of a particular candidate in one test, , becomes universally comparable by the regular transformation .
Even thought quite appealing due to its simplicity, the use of standardized tests to select the entrance at the universities is not free from criticisms [5, 6]. Because the exams are tested in a biased population, minorities and foreigners show difficulties in understanding the cultural subtleties [7, 8]. In addition it is not clear that the of one year or one test can be compared with the results from other years or other tests simply by performing a good performance in the college is correlated with the scores obtained at the standardized tests but with the performance at the high school [9].
In the particular case of the United States, since the admission is a multidimensional process in which not only the SAT or ACT scores, but also the performance at the high school, recommendation letters and extra curricular activities are taken into account; the criticisms to the standardized test method imply a lower impact in the selection process when compared with countries in which the score is the only evaluated dimension. In addition, other countries have a number of competing standardized tests what also guarantee that the education does not become hostage of one evaluation method.
A proper analysis of the standardized tests that would answer to the criticisms [9] to the method is not possible, since the scores of all these standardized exams are not available for detailed analysis.
In Brazil the procedure to enter at the high education system up to the end of the 20th century were exams organized by each college. Even though this method guarantee diversity in the selection process, it made mobility of the student rather difficult. In addition, differently from the United States and some European Union countries, Brazil does not use an university admission system based on historical or annual tests of high school students but only this entrance exam. Typically, the university entrance examination is composed of several multiple choice exams which encompass all high school subject areas.
Over the last decade, the Brazilian government has introduced a standardized university entrance examination known as ENEM (pt: Exame Nacional do Ensino Médio - en: High School National Examination). This new exam is applied across the country what allows for mobility of the students from one state to the other, uses a methodology that allow for comparison of the scores obtained in one year with the scores of the previous years and is elaborated in a centralized form. The major drawback of using one unique exam to select the students is that the system becomes dependent of type of analysis. Additional problems are the following. The exam is too ample. It covers a very large number of questions, and many students are not able to finish the (long) exam questions in the allowed exam time. This means that questions are not homogeneously solved by the students since they possibly solve the questions in different samples. Thus, candidates with partial knowledge of the high school subjects potentially can have the same opportunity (and perform similarly to) a candidate with a comprehensive background. Extensive, unclear and redundant question statements take too much time to read and grasp and do not explore relevant knowledge of the students; rather, understanding a question statement has affected the students performance.
Moreover, it is also important to mention the unclear methods used to calculate the examination scores and the absence (or lack of) brute scores for external analyses by the independent scientific community. Finally, no changes have been made in the exam methodology since its inception, which could lead to improvements in the test questions.
Despite the many criticisms about the contents of the ENEM’s questions [10, 11], the process has its merits. If it is managed and carried out properly it would lead to an interesting mechanism to tackle biases and distortions towards bringing a larger contingent of state owned high school students to public universities.
However, before it becomes a unique tool to evaluate all the students in Brazil, the ENEM has to be evaluated and tested against another existing local exams. As far as we know this was never done with the other standardized tests, maybe with the exception of the SAT which performance has been checked against high school grades but for a very narrow number of students [9].
In this paper statistical physics tools are employed to understand the universal aspects of this exam. This strategy is not new and has been used to analyze high school performance [12, 13, 14]. The scores that the students obtained in the different disciplines in the ENEM are analyzed. In addition the scores obtained by the different high schools in the same exam are also evaluated. Finally a comparison between the performance of a selected number of students at the ENEM and at a local exam at one specific university, the Universidade Federal do Rio Grande do Sul (UFRGS), during three consecutive years is also shown providing a unique tool to identify what differ in the profile of the students selected by both methods.
2 Data Set Analysis
The first part of our data set supplies the average scores of the high schools from Brazil in 2013 considering: School percentage (participation) rate of their students and the economic (average family income) level of the school.
The exam is composed by tests in five different school subject: Writing, Language, Human Sciences, Natural Sciences, and Mathematics. The economic (income) level of the schools are divided into 7 different levels: very high, high, high average, average, low average, low, and very low. We attributed respectively for these levels.
The second data set supplies ENEM and UFRGS entrance examination scores of the students that have taken both exams. We have analyzed students by three consecutive years 2011, 2012 and 2013. Here we have cleaned the data by extracting students that have score zero in one or more school subjects. For example for 2011 we after cleaning we have students that performed the exam the school subject Writing at UFRGS. From these students only had also non zero score at this same school subject at UFRGS, which is the minimum (worst case) size sample used in our work for all comparison tests (Pearson correlation and ranking tests) used in this work. This means that in all possible cross over between two school subjects considering all combinations: UFRGS with UFRGS or ENEM with ENEM or even UFRGS with ENEM we had always larger samples. This guarantees the good significance in our calculations. For example we find in 2013 more than students that performed the school subject math in both UFRGS and ENEM with non zero score.
The high school subjects of the UFRGS entrance examination that we considered compatible for a suitable comparison with ENEM are: Writing, Geography, History, Physics, Chemistry, Biology, and Mathematics. Writing and Mathematics have a direct association between the UFRGS and ENEM examinations. For our purposes, we associate Humanities (ENEM) with Geography and History (UFRGS), and Natural Sciences (ENEM) with Physics, Chemistry, and Biology (UFRGS).
3 Results
3.1 ENEM Scores in the Brazilian High Schools
First, the correlations between the scores at different subjects obtained by all the high schools were computed. The Fig. 1 illustrates the comparison between these scores . Visually, these diagrams show a strong linear correlation between the scores of different subjects. This indication can be quantified by a single number,the Pearson correlation coefficient given by
| (1) |
where and represent the scores of two different subjects associated to -th institution, with . The values of vary from when the two data sets are negatively correlated, to when they are uncorrelated up to when they are positively correlated. Since is computed averaged over all the schools it gives a robust indication of the correlations between the performance of the schools in the different topics.
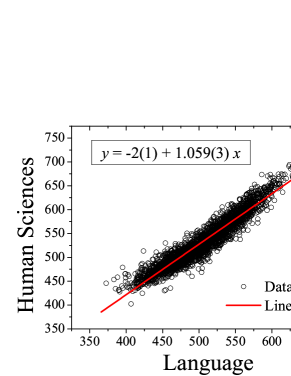
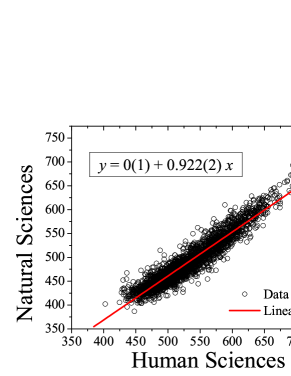
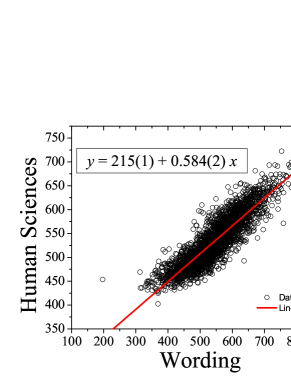
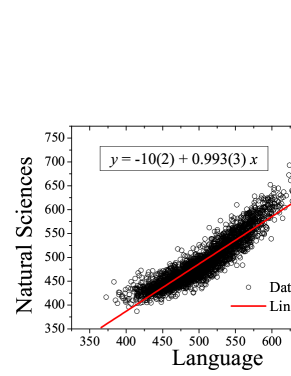
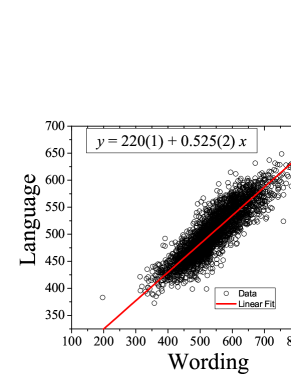
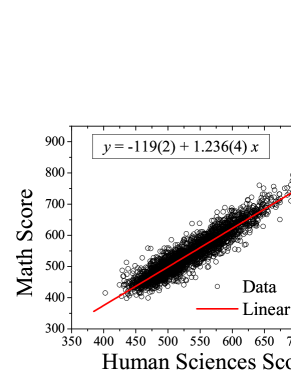
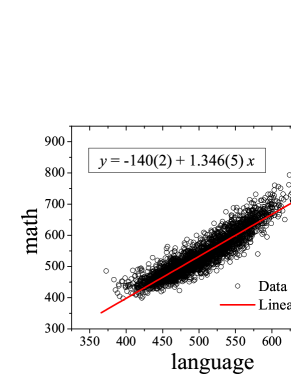
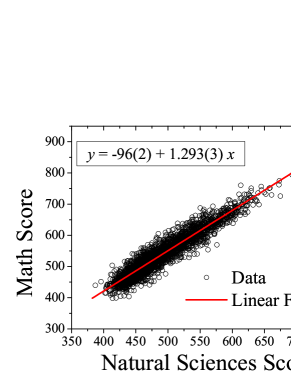
Table 1 illustrates the values of for the different pair of topics. We can observe a high correlation among the different schools which is not a surprise indeed, since the score schools are more representative because represent averages over many students. However some particularities must be mentioned. All subjects are more correlated with Language and Humanities (or Human Sciences) than with Writing. This is quite surprising since in principle one would expect that Natural sciences and Mathematics would show a less evident correlation with Language or Humanities. Language and Human Sciences are slightly more correlated with writing than Natural Sciences and Maths. Although the biggest correlations are found in the somewhat more intuitive cases: between Language and Human Sciences and between Natural Sciences and Maths, and respectively; we also found between Human and Natural Sciences and between Human Sciences and Maths, which are not expected results if the analysis was made with correlation for the different schools. The last row of the table (in bold) corresponds to correlation coefficients between each school subject and the average final score of the schools what is quite strong. This indicates that either the schools in Brazil shown not specific strength in any subject or the exam is unable to capture the difference in the performance of the schools in different areas of knowledge.
| Writing | Language | Human Sciences | Natural Sciences | Math |
|---|---|---|---|---|
| Writing | ||||
| – | Language | |||
| – | – | Human Sciences | ||
| – | – | – | Natural Sciences | |
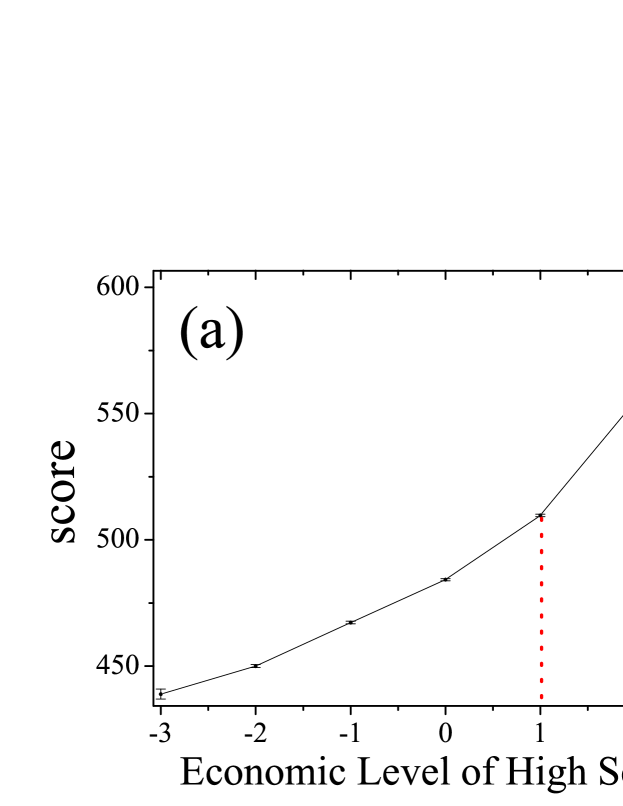
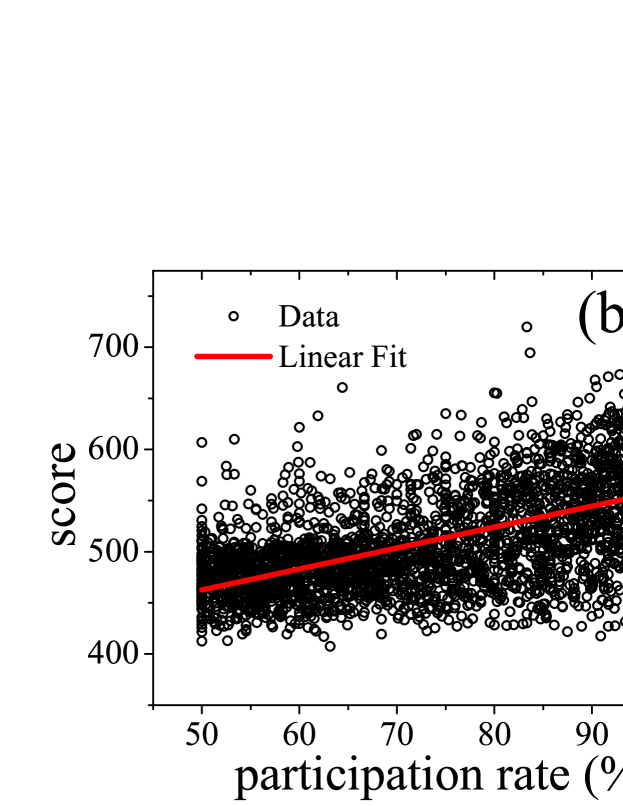
One of the promises of performing a standardized exam is that it would make possible for students coming from disadvantaged areas and schools to enter at the major universities of the country. In order to test this hypothesis, two different parameter were compute: (a) the scores as a function of the social-economic level of the schools and (b) the score as a function of the number of the students’ participation at ENEM, namely the ratio between the number of students that effectively took the examination and the total number of students that were eligible to take the examination.
Figure 2 (a) shows the scores as a function of the social-economic level of the high school. It is clear that the social-economic level is quite relevant for the good performance of the school. In particular, it is important to observe the large slope after the “high average level”. The small error bars shows the reliable results. In the Figure 2 (b) shows that the score increases with the increase of the percent of the participation of the school, showing a linear correlation namely .
Another important test to check if the scores at different disciplines are correlated is to compute the distribution of the scores. Here this calculation is done in terms of the normalized value given by
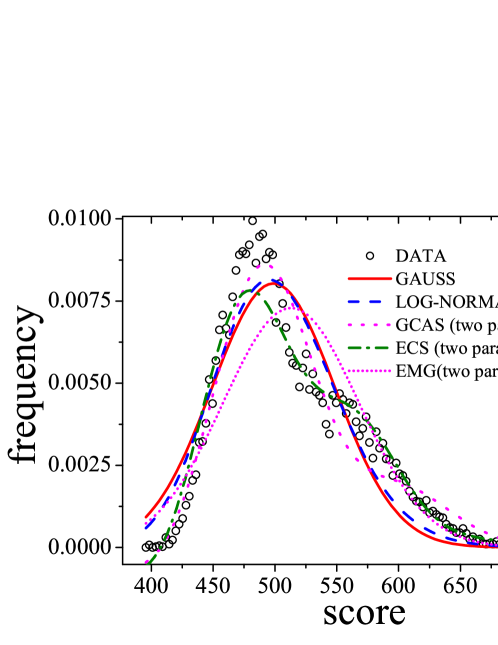
Figure 3 shows the normalized scores distributions for the different school subjects (points) in mono-log scale. The continuous curve represents the average score distribution. The inset plot is depicted to facilitate observation from the traditional linear scale point of view. It is important to highlight that: all the different subjects obey the same distribution of fluctuation of scores and this distribution is not Gaussian since in mono-log we are not observing a second degree polynomial behavior.

What would be the distribution of the scores? In order to answer to this questions, a few distributions shown in the Table 2 have been used to fit the scores of the schools. First, the standard two-parametric statistical distributions (normal and log normal) were checked. In this case and were the free parameter for the fit. Next, other more complicated asymmetrical distribution based on three four parameters were also checked.
The quality of the different fits performed here is checked by the following procedure. Given the original data set with values and the fit of these values by the functions values the quantity of the fit is given by
where , known as residual sum of squares is calculated by
| (2) |
In a general form, can be related to the unexplained variance, since the second term compares the unexplained variance (variance of the model’s errors) with the total variance (of the data). Since , with when original data and fit are identical, it gives a good measurement of how far the fit is from the original data. It is also important to mention that in the linear least squares regression, is equal to the square of the Pearson correlation coefficient given by the Eq. 1.
Even thought the Gaussian distribution seems more promptly in nature, the multiple parameters approach is seen in the movement of particles in random media [16], noise in semiconductor devices [17], stochastic aspects of soccer scores [18] which are described. For all the tested distributions exemplified in the Table 2 the parameter was computed. Here the tested distributions are the normal or Gaussian (N), the log normal (LN), the Exponentially Modified Gaussian (EMG),Gram-Charlier peak function (GC) and Edgeworth-Cramer peak function (EC). Then, the fits using these distributions were performed by the Levenberg-Marquardt method [19] for non-linear fits.
| Dist. | Formula | parameters | ||||
|---|---|---|---|---|---|---|
| N |
|
2: and | ||||
| LN |
|
2: and | ||||
| EMG |
|
3: , , and | ||||
| GC |
|
4: , , , and | ||||
| EC |
|
5: , , , and |
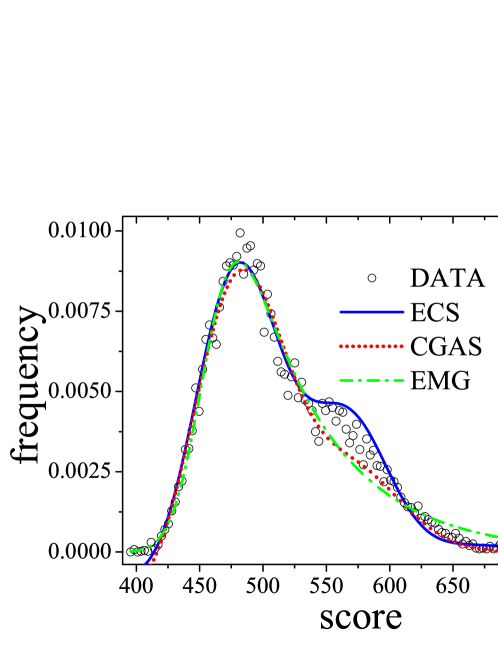
In the case of the distributions EMG, GC, and EC, two approaches have been employed. First, two parameters were estimated with a statistical measure and the others fitted. For example in the case of the EMG, GC, and EC distributions, was fixed with the average of the scores. This procedure yields . Then, is computed in the standard deviation of the original data. This gives . With and fixed, the only free parameters for the EMG, GC, and EC distributions become (,), (,), and () respectively. In addition to the fit with two parameters, a fit in which all the parameters was performed. The comparison between the value of (see Eq. LABEL:Eq:R_square) obtained using these two fitting methods is illustrated in the Table 2.
The Figure 4(a) illustrates the comparison of the original data with the N, LN, EMG,GC and EC, these three last employing a two parameters fit. The visual inspection of the graphs support the results of the determination coefficient [20] shown in the Table 2 that indicates that using two parameters the best fitting distribution is the EC. In the Figure 4 (b) the original data is compared with the results for the distributions EMG, GC and EC but using all the parameters for the fit. In this case the performance of the EC is the more efficient and it is more efficient than when the adjustment is done with only two parameters.
Even though the ENEM is constructed to give a standardized score of individuals, this is not the case for the score of the schools. The distribution shows a region with a peak at the score 500 and another peak at the score 550 what presents two distinct score evolution. This observation is supported by the Figure 2 which shows an abrupt change in the slope of the averaged scores with the increase of economic status of the school. It is important to point out that since the schools’ scores are not Gaussians, the schools’ score evolution over time is not a reliable measure since the score of one year can not be compared with the score of the subsequent year, simply because it is not standardized.
3.2 ENEM and UFRGS Students’ Scores
Next, the performance of the students is analyzed. In order to check how the ENEM’s selection differs from the traditional methods employed by the Brazilian Universities in the past, we select to analyze the performance of the students that have done both the ENEM and the entrance exam at the UFRGS. It is important to emphasize that here we are comparing the performance of the same people in both exams.
The table 3 shows for the years 2011, 2012 and 2013 the correlations, , between the scores obtained by the students in the different subjects at the ENEM tests.
| 2011 | |
|---|---|
| 2012 | |
| 2013 |
It is interesting to observe that the correlation between the students’ scores in all subjects is large with the exception of Writing. It is particularly intriguing the high correlation between the scores on Human and Natural Sciences and Math, usually topics at school in which the performance of the students differs a lot. One possible explanation for this phenomena is related to the fact that at the ENEM the questions are quite long with the addition of a contextualization usually absent in the problem solve texts in exact science. It is important to mention that the behavior is the same for all the years we have analyzes in our work. The low correlation between the Writing and the other topics can be understood because this is the only part of the exam that is not manipulated by the standardized method.
In order to check if the high correlation between scores is a characteristic of the standardized procedure employed at the ENEM or it is due to the students’ profile, the same analysis was performed for the score at the entrance exam at UFRGS.
The Table 4 illustrates the correlation between the students’ scores at different subjects at the entrance at UFRGS during the years of 2011, 2012 and 2013. The division in subject areas in the UFRGS’s exam is a little different from the ENEM’s test. In the case of UFRGS Natural Sciences is divide in Physics, Chemistry and Biology, while Human Sciences is split in History and Geography. It is interesting to notice that the correlation between Human Sciences and Natural Sciences is much lower than the correlation observed in the ENEM and the clear high correlation is present only between the Physics, Chemistry and Math as traditionally is observed at the high schools. As in the case of ENEM, writing haw a very small correlation with other topics. In the case of the entrance at UFRGS, the Writing is not use for elimination but for classification what means that his ability serves to discriminate between people equality apt to enter the university which ones has the better skills for communication.
Due to the difference between the correlations between topics in the two exams becomes obvious the need to directly compare the scores in the same topics. The Table 5 illustrates this comparison. The table shows that writing not only is not correlated with other subjects within the same exam but also is not correlated with the performance in other exams. In addition, the correlation between the scores in other topics when the two exams are compared is not high with the exception of Math.
| 2013 | |
|---|---|
| 2012 | |
| 2011 |
UFRGS-ENEM Word Math Human/Geo Human/Hist Phys/Nat Chem/Nat Bio/Nat 2011 0.313 0.700 0.627 0.628 0.643 0.668 0.653 2012 0.313 0.728 0.654 0.687 0.684 0.676 0.641 2013 0.384 0.759 0.613 0.673 0.679 0.692 0.681
Although the correlation is high, we would expect an ever higher correlation between the two examinations if they intend to admit good candidates to the university (UFRGS). Let us observe that the University has been able to select good students and the institution has achieves high rankings in all evaluations carried out by the Ministry of Education. UFRGS is consistently ranked among the top 5 universities in Brazil for both research and education. It is important to mention and note the small correlations between the Writing test between two exams.
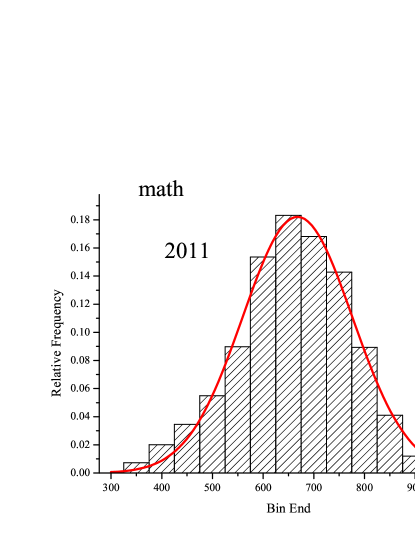
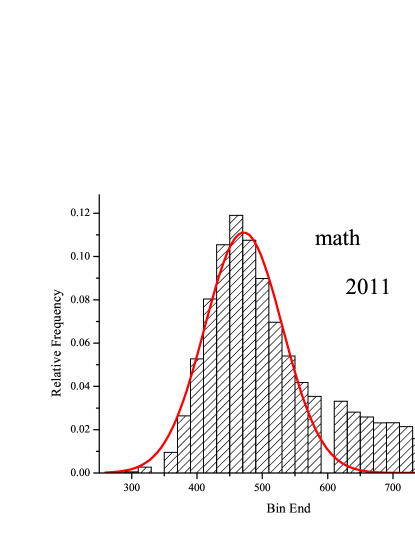
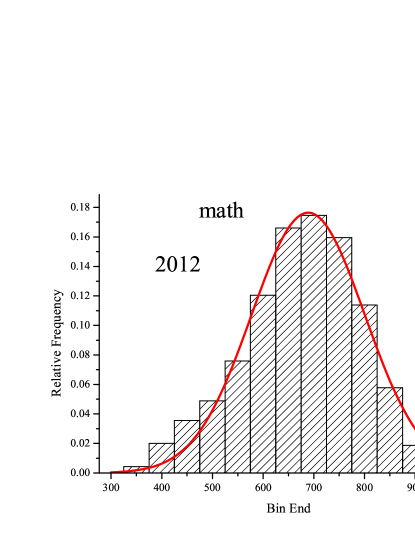
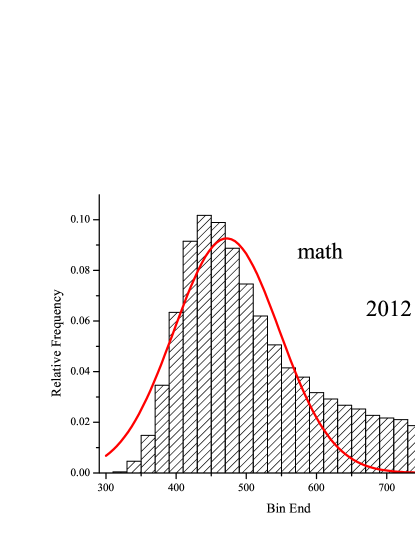
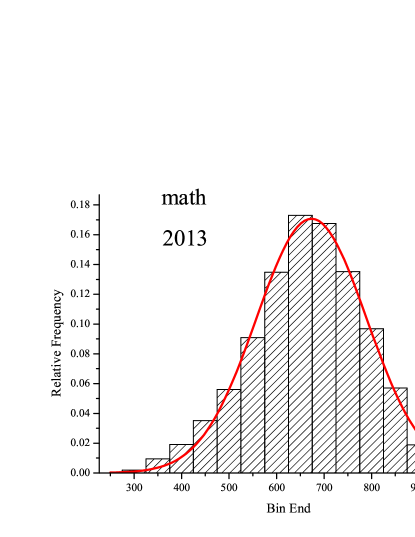
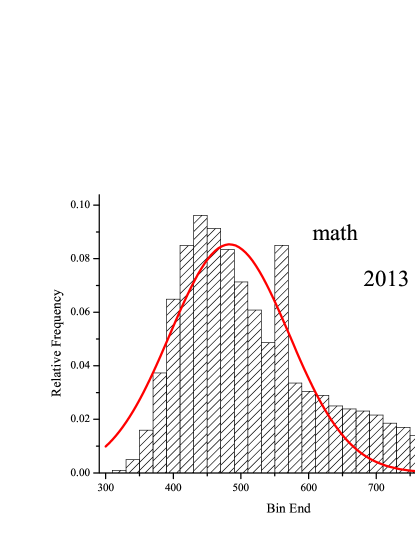
The differences between the two exams was also checked by comparing the distribution of the scores for Math. The Figure 5 illustrates the ENEM’s and the UFRGS’s distributions for Math for the years 2011, 2012 and 2013. The ENEM’s distributions are visually Gaussian forms while the UFRGS’s exams show distinctions when compared with the Gaussian. These similarities and differences can be computed by two quantities: skewness and kurtosis. Skewness is a measure of lack of symmetry. A distribution, or data set, is symmetric if it looks the same to the left and right of the center point. A symmetrical distribution has a skewness of zero, while an asymmetrical distribution with right(left) tail has a positive(negative) skew. Kurtosis is a measure of whether the data are peaked or flat relative to a normal distribution. A Gaussian distribution has a kurtosis of 0, while a flatter distribution has a negative kurtosis and a very peaked distribution has a positive kurtosis. Table 6 shows the kurtosis and the skewness of the ENEM’s score distributions in the years 2011, 2012 and 2013 while the Table 7 shows the kurtosis and the skewness of the UFRGS’s score distributions for the same period.
| Skewness | 2011 | 2012 | 2013 | Kurtosis | 2011 | 2012 | 2013 |
|---|---|---|---|---|---|---|---|
| Writing | Writing | ||||||
| Language | Language | ||||||
| Humanities | Humanities | ||||||
| Natural Sciences | Natural Sciences | ||||||
| Math | Math |
The tables show that there is a negative skewness for ENEM’s Maths scores, but positive in the UFRGS’s scores in the analyzed years. The same occurs, now shown here for simplicity, for Natural Sciences (ENEM) when compared with Physics, Chemistry and Biology (UFRGS) and Humanities (ENEM) when compared with History and Geography (UFRGS). For the kurtosis, for example, we have opposite signals for the writing test in ENEM and UFRGS for Writing and Humanities.
| Skewness | 2011 | 2012 | 2013 | Kurtosis | 2011 | 2012 | 2013 |
|---|---|---|---|---|---|---|---|
| Writing | Writing | ||||||
| Geo | Geo | ||||||
| Hist | Hist | ||||||
| Math | Math | ||||||
| Phys | Phys | ||||||
| Chem | Chem | ||||||
| Bio | Bio |
Such differences can be observed for a particular case, i.e. the Maths test. We can see the deviation from normal of the UFRGS examination which is not observed for the ENEM examinations. This corroborates the results found in Tables 6 and 7.
This result suggests that the exams rank the students in a different order. In order to check this hypothesis, the following strategy was employed. The differences between the rankings of students according to their scores in the two exams was obtained by denoting by the rank of the -th student in the ENEM examinations and denoting by the rank corresponding to the same student at UFRGS. Then, the following quantity
| (3) |
that measures the difference between the ranks established by the two exams for a specific school subject was defined.
Then the average difference in the ranking index becomes
| (4) |
where is the total number of analyzed students in which we choose to represent it in percentages. It measures the average ranking difference between the two exams. In the data, we excluded students with score zero in one of analyzed exams for a fair comparison. In the Table 8 it is possible to observe the differences determined by the two rankings considering two subjects, Maths and Writing.
| Math | ||||||||||||||||||||||||||||||||
|---|---|---|---|---|---|---|---|---|---|---|---|---|---|---|---|---|---|---|---|---|---|---|---|---|---|---|---|---|---|---|---|---|
|
||||||||||||||||||||||||||||||||
| Writing | ||||||||||||||||||||||||||||||||
|
It is important to observe that the ranking of ENEM does not match that of UFRGS. We can observe that a maximum difference (in the Table 8) is near to the maximum possible difference (). The plot of the histogram of the rank differences, i.e., , , can be observed in the Figure 6.
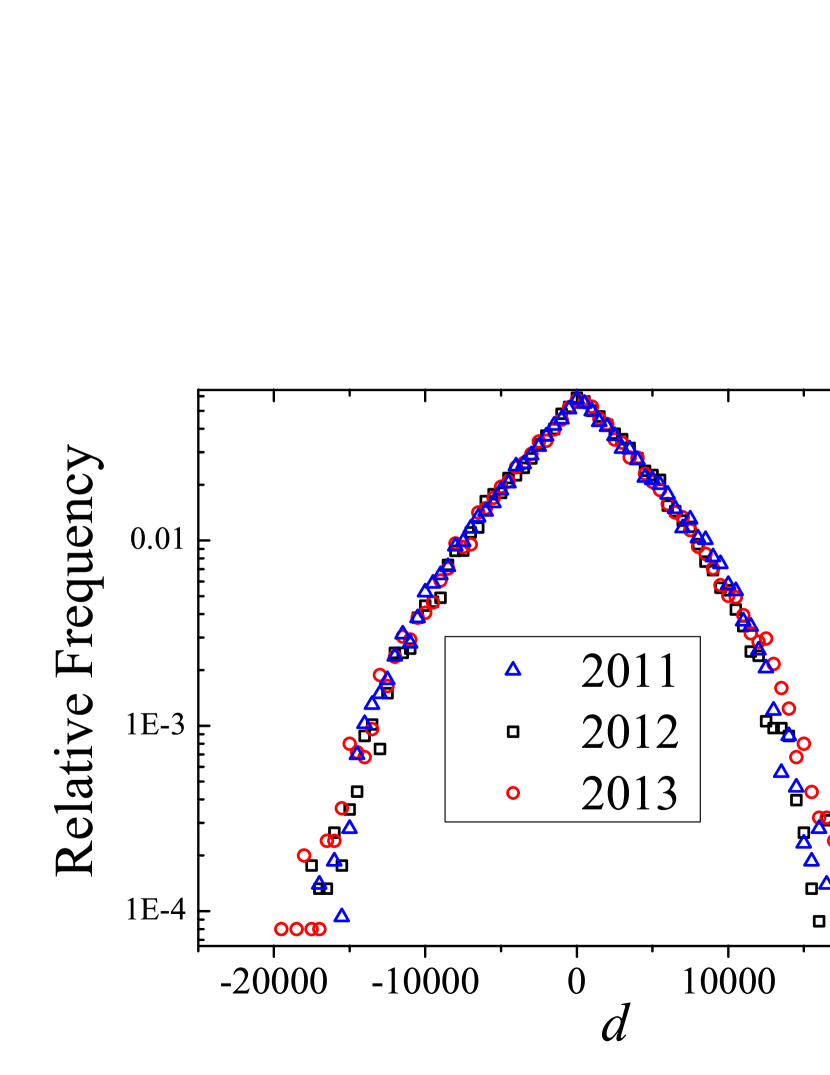
Although the differences are distributed around zero, we can observe that the standard deviation of is very large according to 8. The average difference in Maths, considering the three years for example is around positions which is a very large difference when one considers that ENEM will be used as a national exam. In order to understand the coefficient we performed a simple numerical simulations. Basically we consider numbers in ascending order. We build from this ordered list a partially randomized list by performing swaps between pairs of numbers randomly chosen and independently on their positions. Now with this new list in hands we calculate . The optimization method concerts to find the best such that is nearest the corresponding to the ranking obtained by the experimental data between two exams (second columns in Table 8). A pseudo-code of algorithm used to find the optimal , which we so called Optimal_Beta, can be checked in Table 9. In this algorithm rand is a pseudo-random number and is the respective seed used to generate the sequence of these numbers. The symbol */ denotes the comments of pseudo-code.
| Procedure Optimal_Beta ( ) | |
|---|---|
| input: | |
| output: | |
| Vector: | |
| */ | Initializations: |
| (or other big number of your choice) | |
| For | |
| Endfor | |
| */ | Span from up to with precision : |
| For | |
| For | |
| rand | |
| rand | |
| */ | Perform the swap! |
| EndFor | |
| */ | Compute , i.e, the average distance between the |
| */ | randomized list and ordered numbers; |
| For | |
| Endfor | |
| If () then | |
| Endif | |
| Endfor | |
| Return | |
| Stop | |
| End |
The values are shown in last columns in table 8. There are a notorious correspondence between and which corroborates the definition used to measure the difference between two rankings.
We are convinced that all factors previously raised with respect to ENEM, such as the size of question statements, the duration of the exam provides conditions to less prepared students to obtain similar scores of well prepared students that have more comprehensive knowledge. This is observed by the statistics related to score distribution: such statistics show an apparent homogenization of the evaluation system process when actually it should separate the well-prepared and the other candidates.
4 Conclusions
Standardized university entrance exams have been employed in many countries. They share the characteristics of formatting the distribution of scores to be fitted by a Gaussian. In this paper we study one particular standardized test, the Brazilian’s ENEM examination.
We found that unlike the students’ scores distribution, the schools’ scores do not follow the Gaussian, but forms a two peaked distribution best fitted by an EC distribution. This reflects the fact that the average schools’ score increases linearly with the economic level of the school in two distinct regions with different slopes. This indicates that the exam is designed to identify skills that are more commonly found in the economic elite of the country. One possible explanation is the that since the exam is very long, it requires that the students would be trained to spend hours focusing on one specific topic, which is a kind of training that the more expensive schools are able to provide.
Since the schools’ scores distribution is not a Gaussian, it cannot be used to compare the schools’ performance over time since it is not a standardized measure.
Next, the score of the students in the ENEM and in the UFRGS exams were compared. The correlation between different subject in both cases can be observed. Surprisingly, the correlation between Human Sciences and Natural Sciences and Math is quite high in the case of the ENEM, which suggests that the exam is not measuring the specific abilities in the different themes.
Since the ENEM’s scores and the UFRGS’s scores follow very different distributions the change from one standardized test to a more itemize exam implies selecting a different type of student. In summary, we employed statistical methods to understand the characteristics of the selection in two exams: one standardized test and a non standardized exam. Our results indicate that there are differences in the selection of students is obtained when each one of these exams is performed. It would be interesting in the future to compared through the efficiency of higher education, ENADE, the performance as professionals of the students selected by each one of these methods [21, 22].
Acknowledgment
We thank the Brazilian agencies CNPq, INCT-FCx, and Capes for the financial support. We also thank the fruitful discussions with prof. Fernando Lang da Silveira.
References
- [1] P.B. Ebrey, The Cambridge Illustrated History of China (Cambridge: Cambridge University Press) (2010).
- [2] Mark W. Huddleston, William W. Boyer, The Higher Civil Service in the United States: Quest for Reform, (Pittsburgh: University of Pittsburgh Press) (1996).
- [3] Neil J. Dorans, Recentering and Realigning the SAT Score Distributions: How and Why, Issue Journal of Educational Measurement Journal of Educational Measurement 39, 59 (2006).
- [4] Daniel Koretz,The Impact of Score Differences on the Admission of Minority Students: An Illustration, National Board on Educational Testing and Public Policy Carolyn A. and Peter S. Lynch School of Education Boston College 1, Number 5 (2000).
- [5] G. Corrado, Rethinking the SAT: The future of standardized testing in university admissions, Teachers College Record 106, 1526 (2004).
- [6] K. Yang A Review of Foreign College Entrance Examinations Focusing on Scoring Procedures, The Journal of Curriculum and Evaluation 10, 145 (2007).
- [7] Steven A. Culpepper and Ernest C. Davenport, Assessing Differential Prediction of College Grades by Race/Ethnicity with a Multilevel Model, Jornal of Educational Measurement 46, 220 (2009).
- [8] Kateryna Kokhan, An argument against using standardized test scores for placement of international undergraduate students in English as a Second Language (ESL) courses, Language Testing 30, 467 (2013).
- [9] S. M. R. Ting, Predicting academic success of first-year engineering students from standardized test scores and psychosocial variables, International Journal of Engineering Education 17, 75 (2001).
- [10] Fernando Lang da Silveira, Jurgen Stilck and Marcia C. Barbosa, Manifesto sobre a qualidade das questõess de Física na Prova de Ciêcias da Natureza no Exame Nacional de Ensino Médio, Cadernos Brasileiros de Ensino de Física 31, 471 (2014).
- [11] Fernando Lang da Silveira, Marcia C. Barbosa and Roberto da Silva, Exame Nacional de Ensino Médio (ENEM): Uma análise Crítica, Revista Brasileira de Ensino de Física 37, 1001 (2015).
- [12] M. Gligor and M. Ignat Ignat, Scaling in the distribution of marks in high school, Fractal-Complex Geometry Patterns and Scaling in Nature and Society 11, 363-368 (2003).
- [13] T. Leonard and J. S. J. Hsu, Bayesian-Indference for a Covariance-Matrix, Annals of Statistics 20, 1669-1696 (1992).
- [14] B. Neelon, A. E. Gelfand and and Marie Lynn Miranda, A multivariate spatial mixture model for areal data: examining regional differences in standardized test scores, Royal Statistical Society: Appl. Statistical 63, 737-761 (2014).
- [15] http://veja.abril.com.br/educacao/ranking-escolas-brasil-2013/ranking-escolas-brasil-2013.shtml
- [16] R. da Silva, L. C. Lamb, E. C. Lima, J. Dupont, A simple combinatorial method to describe particle retention time in random media with applications in chromatography, Physica A, 391, 1-7 (2012).
- [17] R. da Silva, L. Brusamarello, G. Wirth, Statistical fluctuations for the noise current from random telegraph signals in semiconductor devices: Monte Carlo computer simulations and best fits, Physica A 389, 2687-2699 (2010).
- [18] R. Silva; S. R. Dahmen, Physica A, Universality in the distance between two teams in a football tournament,398, 56-64 (2013).
- [19] W. H. Press, B. P. Flannery, S. A. Teukolsky, W. T. Vetterling, Numerical Recipes in Fortran 77: The Art of Scientific Computing (1992).
- [20] K. S. Trivedi, Probability and Statistics with Realiability, Queuing, and Computer Science and Applications, (New York: Wiley) (2002).
- [21] Ana Carolina Zoghbi, Fabiana Rocha, Enlinson Mattos,Education production efficiency: Evidence from Brazilian universities, Economic Modelling, 31, 94-103 (2012).
- [22] Power Law Distribution in Education: Effect of Economical, Teaching and Study Conditions in University Entrance Examination, International Journal of Modern Physics C, 14, 449-457 (2002).