Phonon effects on x-ray absorption and nuclear magnetic resonance spectroscopies
Abstract
In material sciences, spectroscopic approaches combining ab initio calculations with experiments are commonly used to accurately analyze the experimental spectral data. Most state-of-the-art first-principle calculations are usually performed assuming an equilibrium static lattice. Yet, nuclear motion affects spectra even when reduced to the zero-point motion at 0 K. We propose a framework based on Density-Functional Theory that includes quantum thermal fluctuations in theoretical X-ray Absorption Near-Edge Structure (XANES) and solid-state Nuclear Magnetic Resonance (NMR) spectroscopies and allows to well describe temperature effects observed experimentally. Within the Born-Oppenheimer and quasi-harmonic approximations, we incorporate the nuclear motion by generating several non-equilibrium configurations from the dynamical matrix. The averaged calculated XANES and NMR spectral data have been compared to experiments in MgO, proof-of-principle compound. The good agreement obtained between experiments and calculations validates the developed approach, which suggests that calculating the XANES spectra at finite temperature by averaging individual non-equilibrium configurations is a suitable approximation. This study highlights the relevance of phonon renormalization and the relative contributions of thermal expansion and nuclear dynamics on NMR and XANES spectra on a wide range of temperatures.
pacs:
78.70.Dm, 76.60.-k, 63.20.kd, 71.15.MbI Introduction
X-ray Absorption Near-Edge Structure (XANES)Henderson et al. (2014) and solid-state Nuclear Magnetic Resonance (NMR)Mackenzie and Smith (2002) spectroscopies are powerful probes of the electronic and local structure of inorganic materials. The combination of these two techniques provides a deep understanding of the electronic and structural properties of materials. For instance, a recent study coupling X-ray absorption spectroscopy and NMR successfully resolved the local structure of Al sites in zeolites.Vjunov et al. (2014) The noticeable improvements in methodology and instrumentation resulted in a spectacular enhancement of the quality and resolution of spectra for both techniques.Ashbrook and Sneddon (2014); Salager et al. (2009); Milne et al. (2014); Koide et al. (2014) Nonetheless, the huge amount of information contained in experimental spectra makes their accurate assignment difficult. To address this difficulty theoretical tools are used beforehand or in conjunction with experimental data.Rehr and Ankudinov (2005); Charpentier (2011); Bonhomme et al. (2012)
Most first-principle calculations in the solid-state consider the nuclei fixed at their equilibrium positions, as obtained by X-ray or neutron diffraction. However, atoms are subjected to quantum thermal fluctuations, which reduce to the zero-point motion at the absolute zero (0 K). Temperature-dependent experiments exhibit significant variations of spectroscopic properties, such as chemical shifts,Fiske et al. (1994); Webber et al. (2010) relaxation times,Chan-Huot et al. (2015) and Electric Field Gradient values Ostafin and Nogaj (2007); Bonhomme et al. (2010); Bräunling et al. (2010); O’Dell et al. (2011) (EFG) measured by NMR or the pre-edge structures observed in XANES spectra of oxide materials.Nozawa et al. (2005); Durmeyer et al. (2010); Manuel et al. (2012) In the case of NMR, it has been observed that the chemical shifts vary of several ppm when temperature increases over thousands of degrees.Fiske et al. (1994); Webber et al. (2010) The EFG tensor is also very sensitive to temperature and nuclear quadrupole resonance experiments have shown a variation of the resonances frequencies up to kHz.K-1.Ostafin and Nogaj (2007); Bonhomme et al. (2010) In the case of XANES spectroscopy, it has been recently shown that the intensity and position of the pre-edge peak highly depend on temperature.Nozawa et al. (2005); Durmeyer et al. (2010); Manuel et al. (2012) It has been demonstrated that the pre-edge structure is due to a violation of symmetry induced by the quantum thermal fluctuations. For instance, at the Al -edge of various oxides, the nuclear motion is responsible for the appearance of a pre-edge peak corresponding to the forbidden electronic transitions.Cabaret and Brouder (2009); Brouder et al. (2010); Manuel et al. (2012)
Multiple attempts to theoretically reproduce the lattice dynamical effects in solid-state spectroscopies have emerged in the literature. Pioneering approaches based on averaging the chemical shielding tensors over different orientations of mobile species were proposed to include nuclear motion in NMR calculations.Gervais et al. (2009); Folliet et al. (2011) In parallel, it was shown that small displacements of either the absorbing atomAnkudinov and Rehr (2005); Cabaret and Brouder (2009); Manuel et al. (2012) or the initial wave function in the crude Born-Oppenheimer approximationBrouder et al. (2010) could reveal forbidden transitions in -edge XANES spectra. Although quite promising, these methods do not account for the collective lattice dynamics. A substantial theoretical work proved that vibrations could be represented as the convolution of the x-ray absorption cross section, calculated for the equilibrium configuration, with the phonon spectral function.Fujikawa (1999); Fujikawa et al. (2015) This theory has been applied to reproduce room-temperature experimental XANES spectra in Ref. Manuel et al., 2012. In the case of non-quantum nuclear motion, the method of choice would be Molecular Dynamics (MD) at finite temperature, either classical or ab initio. In NMR, ab initio MD was used to study the dependence on temperature of the chemical shift Dumez and Pickard (2009); Gortari et al. (2010); Webber et al. (2010); Robinson and Haynes (2010); Dračínský and Hodgkinson (2013) and quadrupolar relaxation ratesCarof et al. (2014); Chan-Huot et al. (2015) but mostly in organic compounds. MD calculations were also used in XANES to calculate Li and S -edges XANES spectra of Li-ion batteries at room temperaturePascal et al. (2014, 2015) or the Al and Fe -edges in warm dense plasmas.Peyrusse (2010); Mazevet et al. (2014); Dorchies et al. (2015) However, MD consider the vibrations as a classical phenomenon and is therefore appropriate only if , with the vibration frequency.Kühne et al. (2007) To account for the quantum behavior of vibrations, Path Integral Molecular Dynamics (PIMD) was used to simulate NMRDračínský and Hodgkinson (2014) and C -edge NEXAFSSchwartz et al. (2009) spectra in organic compounds. In both spectroscopies, the results were improved using PIMD, but at the cost of a larger statistical error. Seeking for computationally less expensive methods, Monte Carlo sampling has been used to account for the vibrational effects on the chemical shifts in MgORossano et al. (2005) and recently a more computationally efficient method arose by assuming a quadratic coupling between vibrations and the shielding tensor.Monserrat et al. (2014) The Monte Carlo sampling method was also used to simulate XANES spectra of molecules in solutions,Canche-Tello et al. (2014) but, to our knowledge, it has not been applied to inorganic solids yet.
The purpose of this work is to describe quantum thermal fluctuations, using methods based on Density-Functional Theory (DFT).Jones (2015) In the Born-Oppenheimer (BO)Born et al. (1954) and Quasi-Harmonic Approximation (QHA),Baroni et al. (2010); Fultz (2010) the thermal effects are modeled by generating atomic position configurations obeying quantum statistics at finite temperatures. The theoretical work is confronted to NMR and recently acquired XANES temperature-dependent experiments for our proof-of-principle compound MgO. This ionic oxide has been chosen for three main reasons: (i) its rock salt structure is ideal to observe thermal effects as its lattice constant is the only free parameter, (ii) it shows no phase transition up to its melting point around 3250 K,Ronchi and Sheindlin (2001) allowing a wide temperature range for experimental measurements, (iii) multiple theoretical studies demonstrated that the harmonic behavior of MgO remains at temperature as high as 1500 K and its Debye temperature has been found, theoretically, to be about 941 K.Fincham et al. (1994); Gavartin (2001); Oganov et al. (2003)
The paper is structured as follows. In Sec. II, the formalism upon which our theoretical model is based is detailed. In Sec. III, experimental and computational details are given. In Sec. IV, experimental and theoretical results obtained on MgO are presented and discussed. Finally, the conclusions of this work are drawn in Sec. V.
II Formalism
II.1 Quasi-harmonic vibrations
A crystal can be seen as a system of nuclei and electrons with respective position vectors () and (). The collective coordinates and are used thereafter. The stationary states of the system are described by the wave function solution of the following general Schrödinger equation,
| (1) |
with the kinetic nuclear operator, the kinetic electronic operator, the Coulomb potential between electrons, the Coulomb potential between nuclei and electrons, and the Coulomb potential between nuclei. The total energy of the crystal is denoted by .
In the BO approximation, which assumes that the electronic cloud reacts instantaneously to the nuclear motion, the wave function solution of Eq. (1) can be approximated as the product
| (2) |
of an electronic part , in which is a parameter, and a nuclear part . The electron orbital index is , and indexes vibrational states.
The Hamiltonian acting onto the electronic variables is labelled ,
| (3) |
where is then a constant energy term determined for a given nuclei configuration . Thus is parametrized by . The electronic wave function is solution of the Schrödinger equation,
| (4) |
which introduces the energy surface . In the BO approximation the lattice dynamics is described by
| (5) |
where the vibrational wave functions are the orthonormal solutions and is the total energy of the whole crystal. Equations (4) and (5) imply that and are complete basis sets of eigenvectors of and of the nuclear Hamiltonian , respectively, leading to the completeness relations
| (6) | |||||
| (7) |
The phonon-induced displacement of nucleus in the Cartesian direction
| (8) |
is small compared to the atomic bond length. Thus a Taylor expansion of the BO energy surface as a function of the nuclear displacements can be carried out and is truncated at the second order in the harmonic approximation. The energy scale is shifted such as the zero-order term is null and the first-order term vanishes because forces acting on individual nuclei are zero at equilibrium. In this approximation, becomes the nuclear harmonic Hamiltonian as
| (9) |
where is explictly written in terms of , the momentum operator of the th nucleus. In Eq. (9) we have introduced the interatomic force constant matrix whose elements are
| (10) |
Rescaling by the nuclei masses define the dynamical matrix, whose diagonalization as
| (11) |
provides phonon polarization vectors and phonon frequencies , where indexes phonon modes. Using in Eq. (9)
| (12) | |||||
| (13) |
which introduce the normal coordinates and , can be written as a sum of independent Hamiltonian operators of harmonic oscillators
| (14) |
Nevertheless, a harmonic model considers the phonon normal modes as independent quasiparticles and does not account for any anharmonic phenomenon, such as thermal expansion. In this work QHA is used to include thermal expansion effects. The model is no longer purely harmonic but does not describe phonon-phonon interaction, as the phonon normal modes are still independent. Within QHA, the probability of finding the system in any set of normal coordinates , is expressed as a product of Gaussian functions following a normal distribution whose widths depend on temperature and phonon frequency.Maradudin et al. (1971) The Gaussian functions are centered on , i.e., at the equilibrium position when (Eq. 12). The probability distribution is written as
| (15) |
with a normalization constant. The normal length of the vibration mode is the standard deviation of collective normal coordinates and depends explicitly on temperature and phonon frequencies
| (16) |
with . Equation (16) describes how the phonon normal modes are thermally populated. The statistical average of any observable is then
| (17) |
For a given crystal, after calculating and diagonalizing the dynamical matrix (Eq. 11) to obtain the phonon frequencies and polarization vectors , a set of nuclear configurations obeying the quantum statistical distribution is generated. For each mode, a set of random Gaussian numbers is created. Then, each is multiplied by the corresponding normal length , as defined in Eq. (16). The set of so-generated normal coordinates { obeys the probability distribution (Eq. 15). The nuclear position collective vectors { are obtained using Eqs. (8) and (12) such as
| (18) |
According to the importance sampling technique, Eq. (17) is equivalent to
| (19) |
In this work, is either the nuclear magnetic shielding tensor, the EFG tensor or the XANES cross section for the th configuration.
II.2 Nuclear Magnetic Resonance spectroscopy
To compare with NMR experiments, for each nucleus, the isotropic value of the magnetic shielding tensor is evaluated as
| (20) |
More precisely, the isotropic chemical shift is considered, where is the isotropic shielding of the standard reference. Unlike the Larmor frequency, contains the response of the electronic system to the magnetic perturbation and is therefore an explicit function of the electronic environment around the probed nucleus. Thus, and is obtained as in Eq. (19).
II.3 XANES spectroscopy
In a single-electron approach, at the -edge, the XANES cross-section, in the electric dipole approximation is usually given byBrouder (1990)
| (21) |
where and are the energy and polarization vector of the incident X-ray photon, respectively, and the fine structure constant. The final and initial electronic states of energy and , respectively, are solution of Eq. (4).
Equation (21) rests upon the assumption that the nuclei are fixed in a generic configuration, hence is parametrized by , i.e., . A more rigorous expression of the cross section accounting for the total system of nuclei and electrons is
| (22) |
where the initial state and final states are defined as in Eq. (2). In Appendix A, it is demonstrated that can be expressed, using the first order of the expansion given in Eq. (27), by
| (23) |
with the quasi-harmonic weighting displacement distribution. The next orders of the expansion in Eq. (27) are not considered in the present work. In Eq. (23), is the average of individual configuration cross sections using a probability distribution that takes into account the temperature and vibrations frequencies in a form consistent with Eq. (19).
III Experimental and calculation details
III.1 Experimental setup
Mg -edge X-ray absorption experiments were performed at the LUCIA beam line (SOLEIL Saint-Aubin, France).Flank et al. (2006) The incident energy range (1280–1400 eV) was selected to include the Mg -edge using a double Beryl monochromator. The pressure in the experimental chamber was 10-7 mbar. The incident X-ray beam was set to a spot size of . Temperature-dependent measurement were conducted at 300 K, 573 K, 773 K, 873 K and 1273 K using a boron nitride furnace. Only the spectra recorded at 300 K, 573 K and 873 K are shown. The 4 cm2 MgO single crystal was held using a perforated lamella of molybdenum. The temperature of the sample was measured using a Chromel-Alumel thermocouple. The spectra were recorded in fluorescence mode with a four element Silicon Drift Diode detector, protected from infrared and visible radiations by a thin beryllium window. To maximize the signal/noise ratio, each point was obtained after a 5 second acquisition time and 5 spectra were measured for each temperature. The self-absorption correction and spectra normalization were applied as in Ref. Manuel et al., 2012.
The temperature-dependent measurements of 25Mg and 17O static isotropic chemical shifts in MgO are taken from Ref. Fiske et al., 1994. The NMR active isotopes 25Mg and 17O have weak natural abundances and gyromagnetic ratios, thus experiments required isotopically enriched samples. Both nuclei are quadrupolar () but, as any atomic site in MgO presents symmetry, the experimental EFG vanishes. Therefore, NMR peaks do not suffer from quadrupolar broadening and shifting.
III.2 Calculation details
| Atom | Valence states (Radius) | Local part |
|---|---|---|
| Mg (NC) | 3(2.00) 3(2.00) 3(2.00) | |
| O (NC) | 2(1.45) 2(1.45) | |
| Mg11footnotemark: 100footnotetext: The pseudopotential of the absorbing Mg atom was generated using the same parameters but with only one core electron and used in the XANES calculation. (US) | 3(2.50) 3(2.60) 3(2.30) | |
| O (US) | 2(1.35) 2(1.35) |
All the calculations were performed using the pseudopotential, plane wave Quantum ESPRESSO suite of codes,Giannozzi et al. (2009) within the DFT-PBE generalized gradient approximation (GGA).Perdew et al. (1996) The details of the pseudopotential used herein are given in Table 1. Most of the calculations were done using ultrasoft Laasonen et al. (1993) GIPAWPickard and Mauri (2001) pseudopotentials except for the NMR calculations for which norm-conserving Troullier-MartinTroullier and Martins (1991) GIPAW pseudopotentials were preferred.
The method detailed in Sec. II has been carried out creating the configurations at the Quasi-Harmonic level with the Stochastic Self-Consistent Harmonic Approximation (SSCHA) codeErrea et al. (2013, 2014) starting from the QHA dynamical matrices of MgO, which crystallizes in space group with a room temperature lattice parameter . The NMR and XANES calculations were performed for temperatures ranging from 0 K to 1273 K with the experimental lattice parameters,Hazen (1976) so that the configurations and spectroscopic results account for the thermal-expansion anharmonic effect. The 0 K calculations were performed using the 12 K lattice parameter.Reeber et al. (1995)
Self-consistent electronic densities were calculated in the unit-cell at the volume of each corresponding temperature. A -point grid sampled the Brillouin zone,Monkhorst and Pack (1976) and a plane-wave energy cutoff (density) for the wave functions of 45 (540) Ry was chosen. Then, the dynamical matrices were calculated using Density-Functional Perturbation TheoryGonze (1995); Baroni et al. (2001) on a -point grid commensurable with the supercell size needed for NMR and XANES calculations thereafter. Long-range electrostatic interactions were taken into account by calculating Born effective charges and electronic dielectric tensor.Gonze and Lee (1997)
NMR calculations were performed using the GIPAW package.Pickard and Mauri (2001); Yates et al. (2007) For each temperature, the calculations were conducted for supercell configurations containing 64 atoms. Each calculation was done on a -point grid, with a plane-wave energy cutoff for the wave functions (resp. density) of 90 (resp. 360) Ry. The convergence was reached for ten configurations at each temperature. For a given temperature, 640 isotropic shielding tensors were calculated and averaged for each nucleus. In this work, is chosen so that experimental and calculated values match at room temperature. The principal components , and of the EFG tensor defined with are obtained by diagonalization of the tensor. The quadrupolar coupling constants defined as were estimated with values from Ref. Pyykkö, 2008 and were found negligible at each temperature. This behavior is consistent with the crystal symmetry and experimental results. Indeed, in a perfect cubic environment we expect the first-order EFG tensor quantities to vanish.
For each temperature, the XANES spectra were calculated using the XSpectra packageTaillefumier et al. (2002); Gougoussis et al. (2009) in supercell configurations containing 216 atoms, each including one 1 full core-hole in a random Mg site. The self-consistent electronic density was obtained at the point of the Brillouin zone with a plane-wave energy (resp. density) cutoff of 45 (resp. 540) Ry. The XANES theoretical spectra were performed on a -point grid with a constant broadening parameter of 0.5 eV. For a given configuration, three polarized XANES spectra were calculated for the X-ray polarization vector parallel to each of the Cartesian axes and the average gave an isotropic XANES spectrum. As a convergence criterium, it has been verified that the averaged polarized spectra along each Cartesian direction matched, as expected in a cubic crystal. The convergence was reached for a number of 30 configurations at each temperature. In the pseudopotential approximation, only valence-electrons are considered, hence the energy scale has no physical meaning and a core-level shift has to be applied before comparing and averaging theoretical spectra (Eq. 19). Similarly to previous works,Mizoguchi et al. (2009); Jiang et al. (2013); Lelong et al. (2014) the core-level shift in the th configuration is taken into account as follows:
| (24) |
In this rescaling, the energy of the lowest unoccupied electronic band was subtracted and the energy difference between the system with one core-hole and one electron in the first available electronic state ( and that of the ground state () was added. Finally, all the spectra were shifted by 1303.8 eV to match the experimental main edge peak energy position at room temperature. To interpret XANES spectra, local and partial density of states (DOS) were calculated in the supercell configurations using Löwdin projections on a -point grid with a Gaussian broadening parameter of 0.3 eV.
IV Results and discussion
IV.1 Solid-state NMR spectroscopy
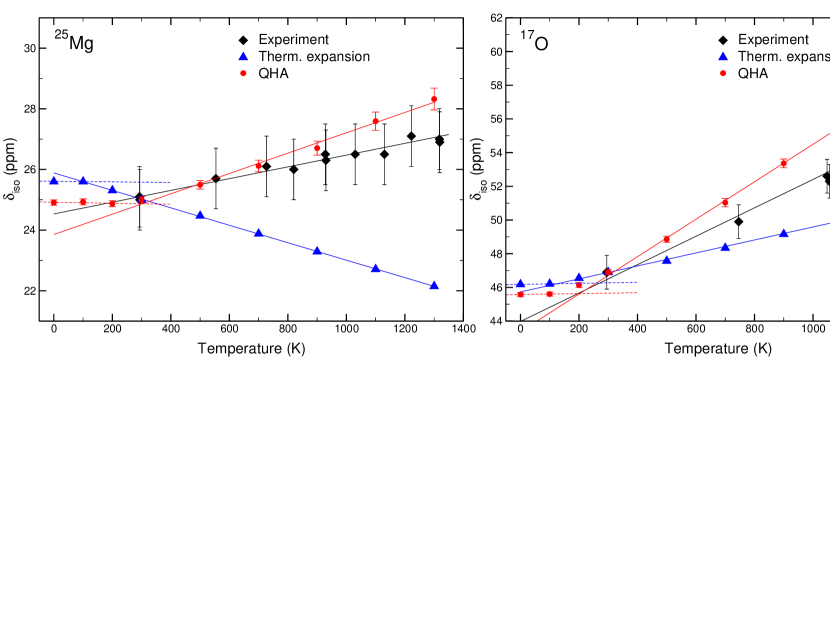
Figure 1 compares the temperature-dependence of the experimental NMR measurements from Ref. Fiske et al., 1994 with the calculated isotropic chemical shifts of 25Mg and 17O in MgO up to 1273 K. For both nuclei, the calculated values closely reproduce the experimental trend: the chemical shift increases with temperature. In addition, the contribution of the thermal expansion is displayed. The incorporation of the quantum motion of nuclei is mandatory, since it improves the agreement with experiment, especially for 25Mg. Without the quantum motion, considering only the thermal expansion leads to a downward trend in 25Mg and an upward one in 17O. These opposite trends come from the fact that unlike 25Mg, the chemical shift of 17O is not a function of the Mg-O bond length. Indeed, the chemical shift of 17O depends on the interaction between the empty states of 25Mg and the states of 17O, which results in a deshielding of 17O.Profeta et al. (2004)
| Nucleus | Expt.11footnotemark: 100footnotetext: Ref. Fiske et al.,1994 | This work | Calc.22footnotemark: 200footnotetext: Ref. Rossano et al.,2005 | Calc.33footnotemark: 300footnotetext: Ref. Monserrat et al.,2014 |
| 25Mg | 0.002 | 0.003 | 0.004 | 0.005 |
| 17O | 0.008 | 0.010 | 0.011 | 0.005 |
The linear trend behavior of the chemical shift observed from 300 K to 1273 K is consistent with experiments and previous theoretical studies.Rossano et al. (2005); Monserrat et al. (2014) Our results show a better agreement with experiments than other theoretical studies, the corresponding slopes obtained for each nucleus are summarized in Table 2. The method used in Ref. Rossano et al., 2005 is similar to ours, but the remaining discrepancies may come from a less accurate description of the phonons dispersion and quasi-harmonic vibrational wave functions. In Ref. Monserrat et al., 2014, the coupling between the phonons and the chemical shift tensor was expanded in terms of vibrational-mode amplitudes and was assumed to be quadratic. However, in this study, the thermal expansion was neglected, thus, the results cannot be compared to experiment and the same slope is reported for the temperature-dependence of both nuclei unlike experiments.
The linear behavior in the room-to-high temperature region arises from a combination of both the thermal expansion and dynamics of nuclei. These two effects are constant in the low-temperature regime, from 0 K to 100 K, where the vanishing thermal expansion gives rise to a flat temperature dependence and the dynamics of the nuclei reduces to a constant term (Fig. 1). The zero-point renormalization of the chemical shift is evaluated to ppm and ppm, respectively. Above 300 K, the amplitude of the dynamical part outweighs the thermal expansion. Finally, in the intermediate temperature region (typically between 100 K and 300 K) there is a competition between the two components of the temperature-dependence that leads to the observed curvature.
The origin of the remaining discrepancies between calculated and experimental slopes has to be investigated. The overestimation of the temperature-dependence of both nuclei chemical shifts could be related to a deficiency of GGA. Indeed, it is well known that GGA overestimates slightly the interatomic distances of solids and underrates phonon frequencies.He et al. (2014) Although experimental lattice parameters are chosen to balance this effect, the use of more accurate GGA functionalsWu and Cohen (2006); Perdew et al. (2008) might enhance the agreement. Furthermore, it has been noticed that, in ionic compounds containing alkaline-earth cations, the calculation-experiment correlation lines of NMR parameters, as calculated within GGA, deviate from the 1 ideal value.Laskowski et al. (2013) In the case of CaO, it has been observed that the shortening of the bond length induces an artificial hybridization between the states of Ca and the of O.Profeta et al. (2004) This problem was addressed by the use of a corrected Ca pseudopotential. To a lesser extent this problem can occur in MgO. Laskowski et al. (2013) proposed to use GGA instead of standard GGA to better describe the states of the cation. Finally, one may argue of a failure of QHA, but the theory has revealed to accurately provide the lattice dynamical properties in MgO up to 1100 K under ambient pressure conditions.Wentzcovitch et al. (2010) To go beyond QHA, anharmonic effects in periodic solids can be investigated in a numerically feasible manner using the vibrational self-consistent field method Monserrat et al. (2013) or the SSCHA.Errea et al. (2014)
IV.2 XANES spectroscopy
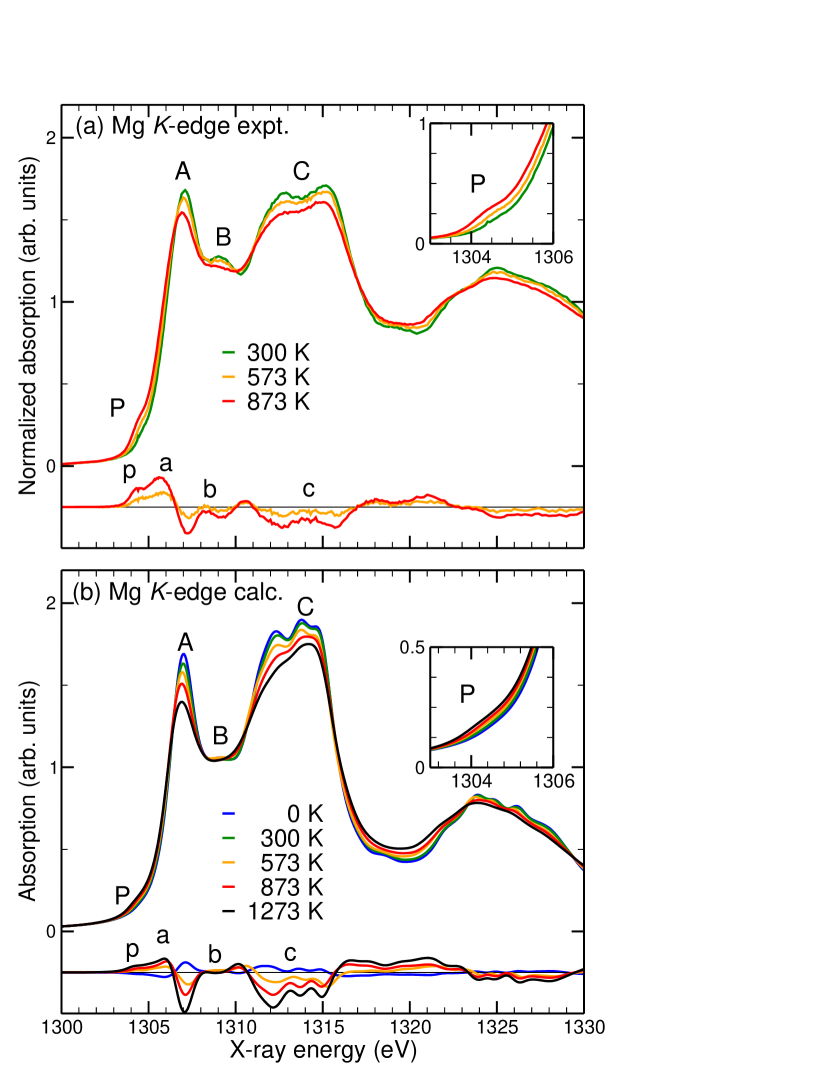
In Fig. 2(a) the experimental Mg -edge XANES spectra are reported. While temperature continuously smoothes the XANES features, the P pre-edge peak increases and shifts towards lower energy. To a lesser extent, this energy shift is also visible for the A main edge peak and the following features. These temperature effects have been also observed at the Al -edge in corundum (-Al2O3) and beryl (Be3Al2Si6O18).Manuel et al. (2012) The corresponding calculated XANES spectra are plotted in Fig. 2(b) along with the 0 K and 1273 K spectra. Calculations reproduce closely experiments over all the explored incident X-ray photon energy range, as highlighted by the similarity of the difference of each spectrum with the room-temperature one. However, the intensity of the calculated pre-edge is underestimated: the experimental and calculated P/A intensity ratios are about 1/5 and 1/7, respectively. This mismatch may come from the first-order expansion of the X-ray absorption cross section (Eq. 23). Going further than the first-order is a possible improvement of the method. In addition, as for NMR, configurations obtained beyond QHA could lead to a better agreement with experiment.Monserrat et al. (2013); Errea et al. (2013)
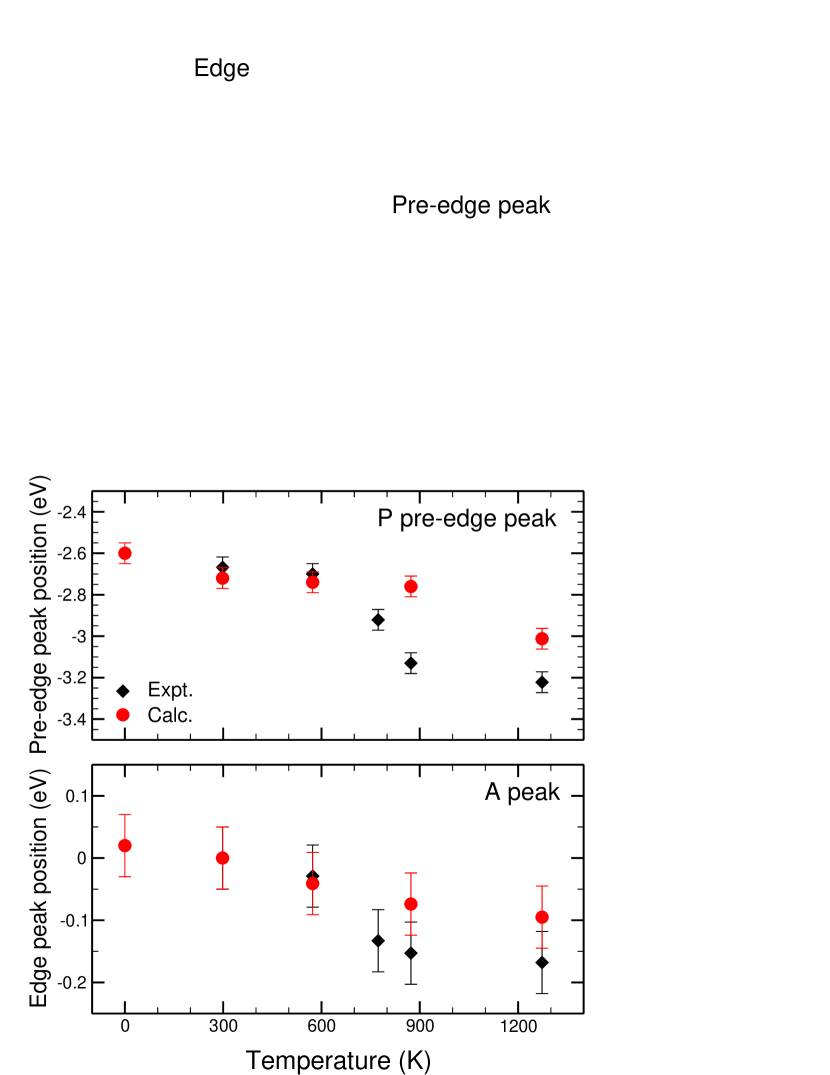
The temperature-dependence of the P and A peaks energy positions is showed in Fig. 3. For temperature ranging from 300 K to 1273 K, the theory-experiment agreement is satisfactory: the experimental and calculated P peak variation is 0.55 eV and 0.41 eV, respectively. For peak A, the experimental (resp. calculated) variation is 0.17 eV (resp. 0.12 eV). The results are comforted by the experimental observations at the Al -edge in corundum where the pre-edge position decreased of about 0.4 eV from 300 K to 930 K.Manuel et al. (2012) The origin of these shifts may be related to the band gap evolution in temperature. In ionic compounds, the lattice expansion affects electronic bands. In MgO, the band gap was shown to decrease by 0.91 eV, from 300 K to 1273 K, using optical reflectivity measurements.Bortz et al. (1990) Moreover, the electron-phonon interaction contributes more than the thermal expansion to the band gap narrowing.French et al. (1990); O’Brien et al. (1992) Over the same range of temperature, our calculations achieved a similar band gap decrease ( eV), while the decrease only due to thermal expansion is eV.
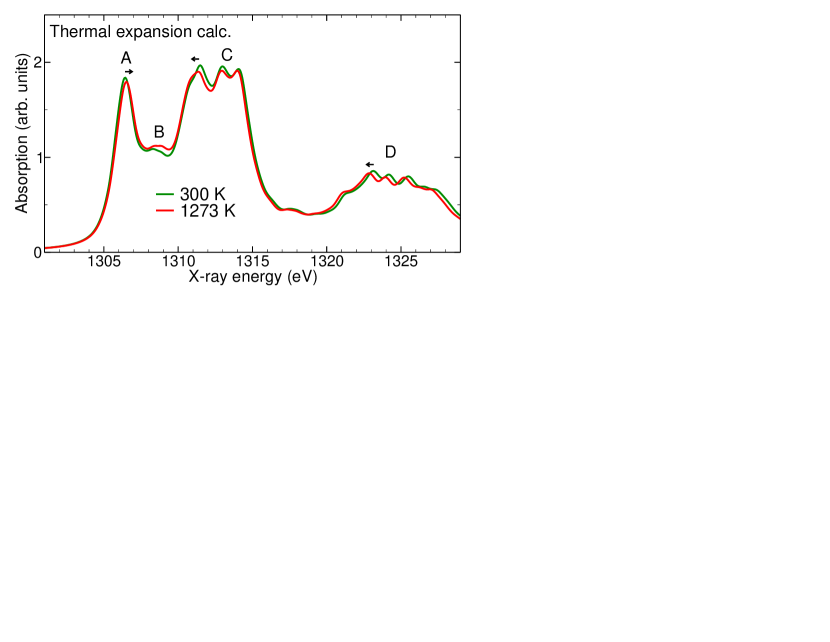
The energy shift to lower energy does not exclusively concern the P and A features since it is visible over all the spectral energy range. For instance, peak D moves of about 0.1 eV to lower energy as temperature increases. The decreasing shift agrees with the empirical Natoli’s rule (),Natoli (1984) which states that the energy position decreases with increasing interatomic distance. Therefore, this signature can be related to the thermal expansion. Figure 4 displays the Mg -edge XANES spectra calculated in the equilibrium configuration at the volumes corresponding to 300 K and 1273 K. The 1273 K spectrum is more contracted than the 300 K spectrum. The C and D features move down toward lower energy with increasing interatomic distance as observed experimentally. On the contrary, in opposite trend with experiment, peak A shifts toward higher energy. Therefore, thermal expansion does not fully explain the shifting trends, especially at lower energy, where vibrations are mandatory to reproduce the correct spectral-feature positions.
Former studies already proposed that the P peak originates from the vibration-induced violation of the dipole forbidden transitions.Cabaret and Brouder (2009); Manuel et al. (2012); Brouder et al. (2010) To further analyze the P peak origin, Fig. 5 compares the theoretical XANES spectra obtained at 0 K, by including or not the zero-point motion. In addition, Fig. 5 displays all the core-level shifted individual configuration spectra in the background. The phonon influence on the XANES spectra is characterized by two main features. First, similarly to a convolution and in agreement with the theoretical framework of Fujikawa,Fujikawa (1999) the inclusion of the 0 K quantum fluctuations globally smoothes the XANES spectrum. Second, the zero-point motion induces a pre-edge peak that is totally absent in the equilibrium spectrum, i.e., when the atoms are fixed at their equilibrium positions. Hence, Fig. 5 highlights the quantum origin of the pre-edge. Moreover, the weak difference in the pre-edge intensities between 0 K and 300 K calculations emphasizes the prominent role of quantum effects up to room temperature [Fig. 2(b)]. A better description of the P and A peaks intensities and variations could be achieved by the phonon-renormalization of the electronic energies directly in the self-consistent calculation, as performed in Refs. Antonius et al., 2014; Poncé et al., 2014; Marini et al., 2015; Poncé et al., 2015.
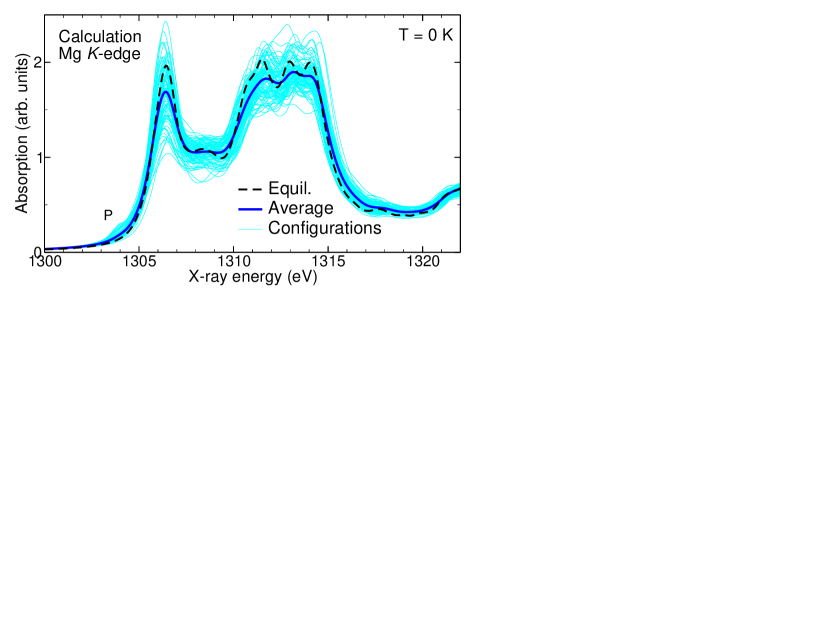
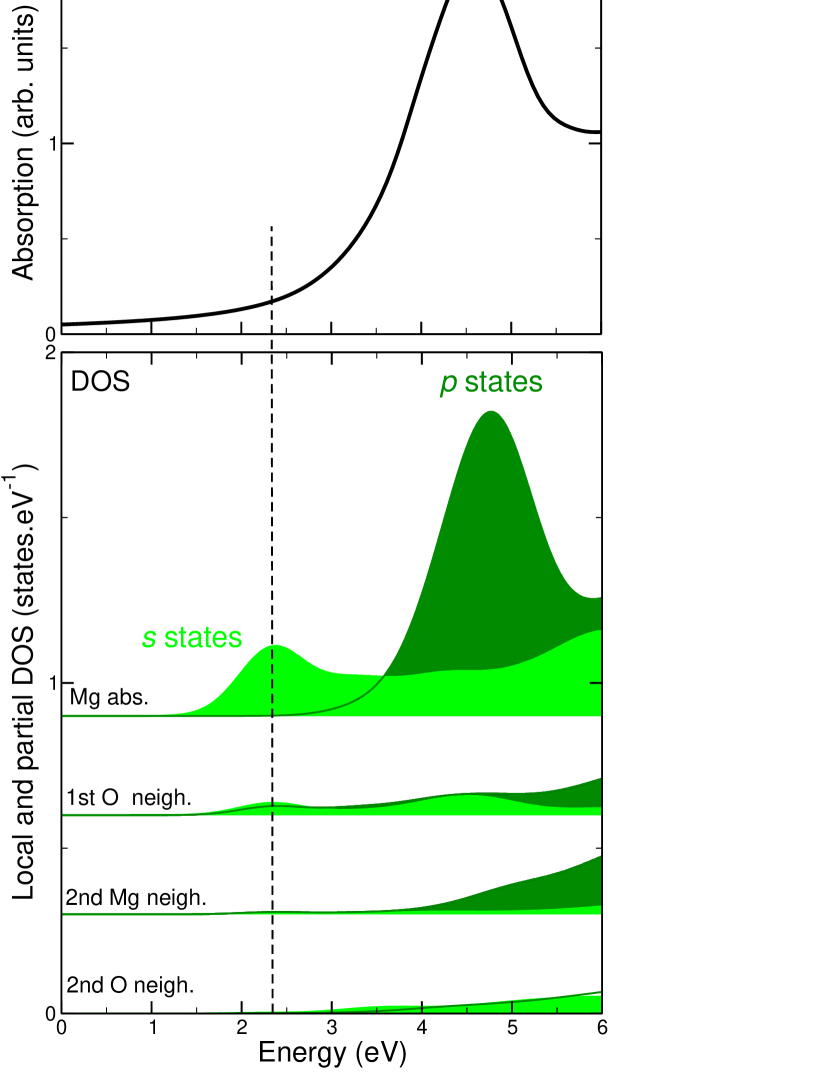
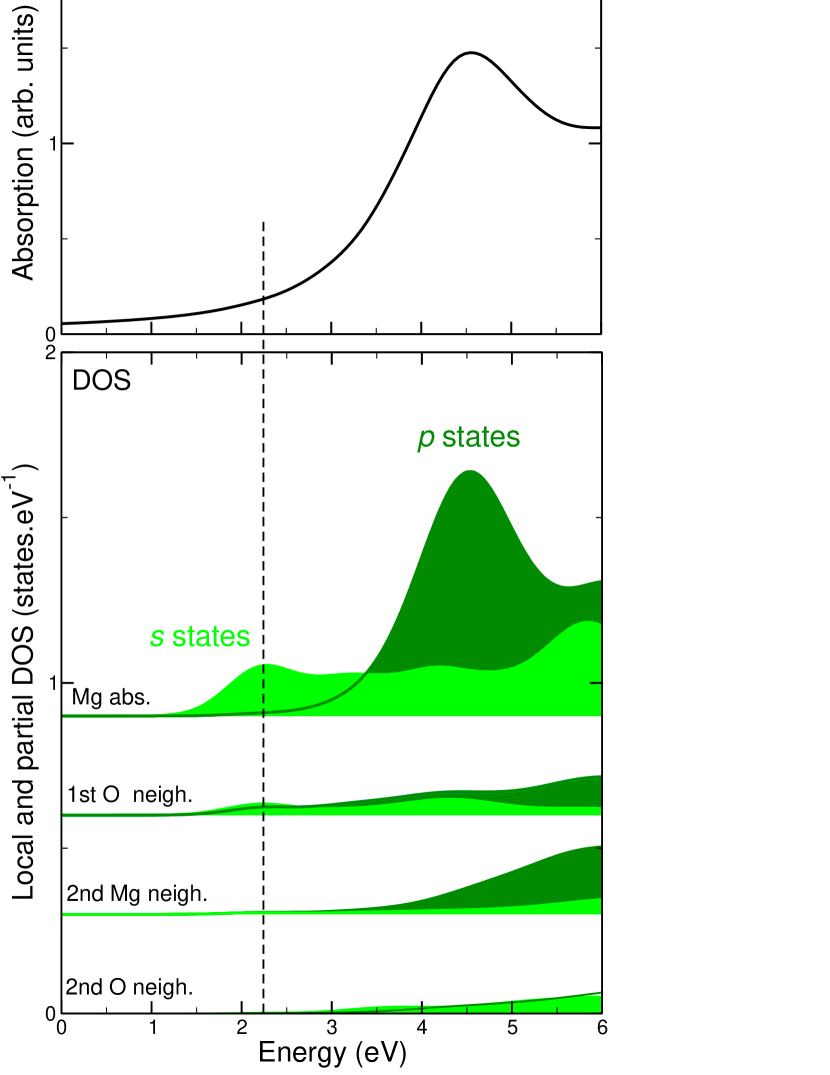
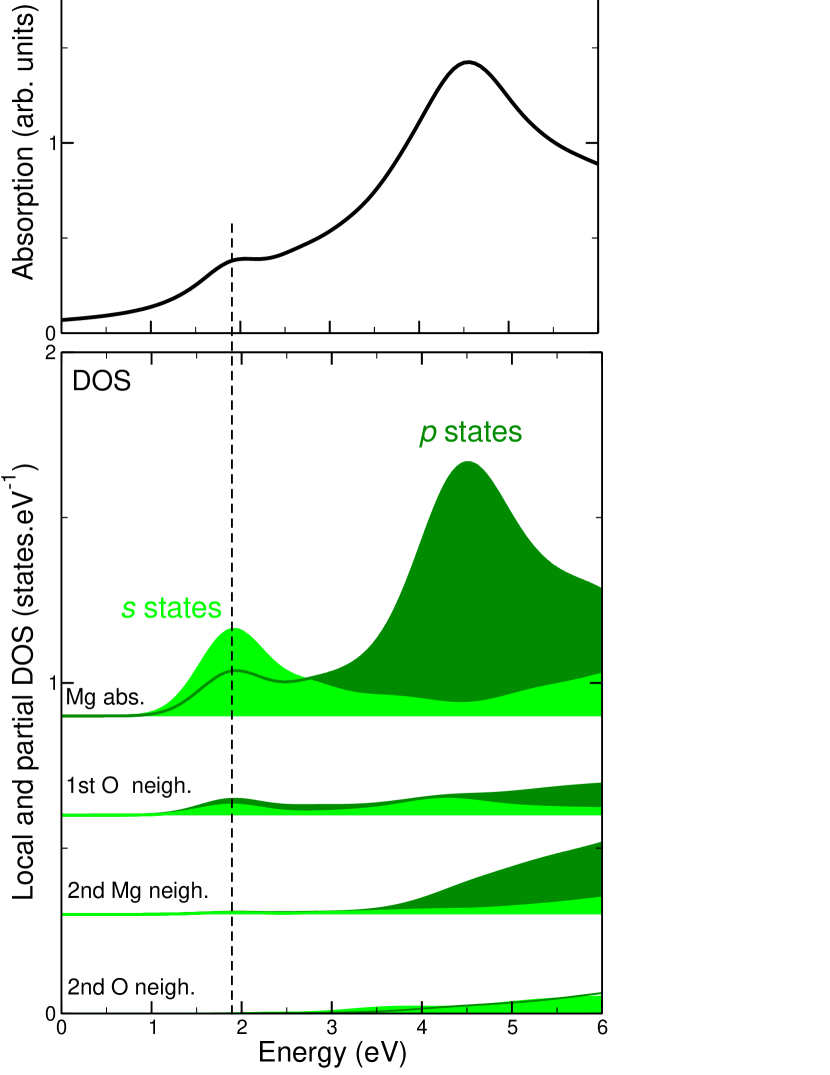
The 0 K individual configuration spectra present a strong dispersion around the averaged spectrum (Fig. 5). This dispersion increases with temperature. Some of the individual configuration spectra exhibit a strong P peak while some other do not, whatever the temperature. Two individual configuration XANES spectra at K, one with a pre-edge and one without, have been selected and analyzed using local and partial DOS [Figs. 6(b,c)]. For comparison, Fig. 6(a) displays the case of the standard calculation with atoms fixed at their equilibrium positions at K. The partial and local DOS plotted in Fig. 6 are the and empty DOS projected on (i) the absorbing Mg, (ii) the first O neighbors, (iii) the next Mg neighbors, and (iv) the next O neighbors. Whatever the configuration, the core-hole strongly modifies the and empty states of Mg, leading to two rather localized peaks, which coincide with P and A, respectively. P is only visible if hybridization of the Mg absorbing states occurs [Figs. 6(c)]. This mixing of the Mg absorbing states also induces a stronger DOS of oxygen. The hybridization due to the dynamical distortion of the MgO6 octahedron does not systematically occur [Fig. 6(b)]. The contribution of the lowest unoccupied band to the electronic charge density () gives a representation of the electronic state probed in the P peak and enlightens the effect of the MgO6 octahedron distortion. In the equilibrium configuration [Fig. 6(a)] the isosurface shows a centrosymmetric cubic shape. The distortion of the lattice strongly impacts [Fig. 6(b)], however, it is not sufficient to create a pre-edge peak. The P peak emerges if the distortion of the MgO6 octahedron induces a -like character on the neighboring O atoms, as already observed in the DOS [Fig. 6(c)]. To conclude, the breakdown of the symmetry is mandatory to induce the hybridization and the forbidden transition but is not sufficient.
V Conclusion
A DFT-based approach enabling to successfully introduce quasi-harmonic quantum thermal fluctuations of nuclei in NMR and XANES spectroscopies has been presented. This method, avoiding the explicit calculation of the electron-phonon coupling parameters, provides an efficient framework to analyze phonon effects occurring in both spectroscopies. The calculated spectral data obtained in the MgO proof-of-principle compound are in good agreement with experimental datasets, which supports the reliability of our approach.
The combination of experiments and first-principle calculations have enabled to investigate the influence of the quantum vibrations in both spectroscopies. A similar behavior is revealed: the zero-point phonon renormalization of NMR and XANES spectra improves the experiment-calculation agreement and therefore could be used on a regular basis to reproduce experimental data even at low temperatures.
In NMR, the experiment-calculation agreement is improved with respect to previous theoretical studies. The temperature-dependence of the chemical shifts results from both contributions of thermal expansion and nuclear dynamics, and reduces to a constant renormalization term at low temperature.
In the case of XANES, the temperature-dependence of XANES features is reproduced over a large range of temperatures. An analytic expression of the phonon-dependent X-ray absorption cross section is derived at the first order of the electronic Green’s function expansion. It appears that keeping only the first term in the expansion of Eq. (27) is a suitable approximation to calculate XANES spectra at finite temperature. It appears that the first-order calculation of XANES spectra at finite temperature is a suitable approximation. Nevertheless, the implementation of the higher-orders correction terms could improve the pre-edge intensity modeling. The presence of the pre-edge feature is a relevant signature of phonon effects. A thorough study of the mechanism from which the pre-edge emerges is conducted. The breakdown of the coordination symmetry is mandatory to induce the pre-edge and a -like character arises on the neighboring O atoms if the pre-edge feature is discernible. The pre-edge energy variation in temperature is related to the band gap temperature-dependence, whereas the variation of the high-energy structures originates from the thermal expansion.
The results obtained for MgO can be extrapolated to other light-element oxides. In the case of XANES spectroscopy, the method is applied to corundum in a forthcoming publication.Nemausat et al. Techniques closely related to XANES, such as Non Resonant Inelastic X-ray Scattering and core-loss Electron Energy Loss Spectroscopy, may also be affected by vibrations and could highly benefit from this theoretical framework.
Acknowledgements.
This work was supported by French state funds managed by the ANR within the Investissements d’Avenir programme under reference ANR-11-IDEX-0004-02, and more specifically within the framework of the Cluster of Excellence MATISSE led by Sorbonne Universités. It was performed using the HPC resources of GENCI-IDRIS (grants: 2015-100172). Experiments were performed on the LUCIA beam line at SOLEIL Synchrotron (proposal: 20141057). The authors acknowledge Guillaume Radtke, Étienne Balan, Delphine Vantelon, Jean-Paul Itié and Yves Joly for very fruitful discussions and Lorenzo Paulatto for his help with the SSCHA code.Appendix A Phonon-renormalized X-ray absorption cross-section
In this section we discuss two questions that are rarely addressed in the literature. To describe the first question recall that, in optical spectroscopy of molecules, the equilibrium nuclear positions of the initial and final states of the absorption process are different. This leads to vibronic effects that are often calculated by using the Franck-Condon principle. In X-ray absorption spectroscopy, the experimental spectrum is well reproduced although the final states are calculated for the same nuclear positions as the initial state. How can this be?
The second question has to do with the effect of temperature on X-ray absorption spectra. This effect is often calculated by averaging spectra calculated over a distribution of atomic positions corresponding to the temperature.Pascal et al. (2014, 2015); Peyrusse (2010); Mazevet et al. (2014) In principle, this procedure is not correct although it gives reasonable results in practice. How can this be?
In the present section, we answer these two questions by showing that the usual calculation methods amount to neglecting the nuclear kinetic energy in the absorption process and we show how it is possible to go beyond this approximation.
To describe the effect of nuclear vibrations on XANES spectra, we write the electric dipole absorption cross-section in terms of the wave functions involving both the electronic and the nuclear variables:
| (25) | |||||
where we used:Newton (1982)
Equation (25) is equivalent to Eq. (22) for the transition operator . The Green function of the full electronic and nuclear Hamiltonian is the solution of the following equation
| (26) |
with the complex energy = + , where an infinitesimal positive number or a finite number representing the broadening due to core-hole lifetime and experimental resolution. A straightforward expansion in Eq. (26) gives
| (27) |
where is the Green function in the Born-Oppenheimer approximation. Equation (27) can be expanded into
| (28) |
The resolution of X-ray absorption spectra is determined by the lifetime of the core hole (0.36 eV for the -edge of Mg Krause and Oliver (1979)). It may be considered that the core hole lifetime will smooth out effects that involve a much smaller energy. Since the nuclear kinetic energy, evaluated using the zero-point energy values,Irikura (2007) is 0.02 eV, it seems reasonable to neglect the kinetic energy and to keep only the first term of the expansion:
| (29) |
The second term is expected to play a role in the presence of forbidden transitions, but this effect will not be considered in the present paper. We reach the approximate absorption cross-section
| (30) |
In this approximation, the calculation of the phonon-renormalized XANES cross section requires only the Born-Oppenheimer Green function , for which we now give the following convenient expression:
| (31) |
The validity of this expression can be established by showing that it solves the equation for :
| (32) |
Equation (30) is now evaluated as follows
| (33) |
This expression can be simplified by noticing that, in the Born-Oppenheimer approximation, is diagonal in the nuclear variables. Indeed, by writing the initial and final states in the Born-Oppenheimer approximation (Eq. 2) we obtain
| (34) |
The completeness relation of Eq. (7) turns Eq. (34) into
| (35) | |||||
where is the electronic Green function for a system where the nuclei are fixed at position . In other words, is the solution of
| (36) |
where is evaluated at the nuclear positions . Introducing Eq. (35) in Eq. (30) the absorption cross-section at the first-order in is obtained:
| (37) |
The result of Eq. (37) implies that the XANES calculation requires only the energy surface – nuclear configuration – of the initial state. Hence, Eq. (37) justifies the use of the ground-state crystallographic structure in the initial (without core-hole) and final (with core-hole) states when calculating the XANES cross-section. The total wave functions can be expressed in the BO approximation (Eq. 2)
| (38) |
Equation (38) proves that the effect of thermal vibrations on XANES spectra can be obtained by averaging individual XANES spectra for nuclear positions weighted by the distribution function computed from the ground vibrational mode in the ground state.
However, Eq. (38) is expressed in a many-body framework, whereas -edge XANES spectra are usually calculated in a single-electron framework. Since this reduction is a classical problem, we just give a sketch of the derivation. If we rewrite Eq. (38) in terms of wave functions, we have to deal with matrix elements such as , where and are -body wave functions. If we assume that these wave functions can be expressed as Slater determinants, the fact that is a single-body transition operator implies:Cowan (1981)
| (39) |
where is the only pair of one-electron orbitals that are different in and , where is occupied in and in . For a -edge the resulting expression is
| (40) |
where . A similar expression can be obtained from more sophisticated many-body perturbation theory.
Considering the cross section in a given nuclear configuration from Eq. (21) gives
| (41) |
and we demonstrate, restricting ourselves to the first order in the expansion of , that to account for the nuclear motion in the XANES cross section one must average the individual configuration spectra using a probability distribution, which is consistent with Eq. (19). We used a ground-state phonon wave function for notational convenience. The generalization to a Boltzmann distribution of phonon states at finite temperature is straightforward and amounts to replacing by in Eq. (41).
References
- Henderson et al. (2014) G. S. Henderson, F. M. F. de Groot, and B. J. A. Moulton, Rev. Mineral. Geochemistry 78, 75 (2014).
- Mackenzie and Smith (2002) K. Mackenzie and M. Smith, Pergamon Mater. Ser., Pergamon Materials Series, Vol. 6 (Elsevier, 2002).
- Vjunov et al. (2014) A. Vjunov, J. L. Fulton, T. Huthwelker, S. Pin, D. Mei, G. K. Schenter, N. Govind, D. M. Camaioni, J. Z. Hu, and J. A. Lercher, J. Am. Chem. Soc. 136, 8296 (2014).
- Ashbrook and Sneddon (2014) S. E. Ashbrook and S. Sneddon, J. Am. Chem. Soc. 136, 15440 (2014).
- Salager et al. (2009) E. Salager, R. S. Stein, S. Steuernagel, A. Lesage, B. Elena, and L. Emsley, Chem. Phys. Lett. 469, 336 (2009).
- Milne et al. (2014) C. J. Milne, T. J. Penfold, and M. Chergui, Coord. Chem. Rev. 277-278, 44 (2014).
- Koide et al. (2014) A. Koide, T. Fujikawa, and N. Ichikuni, J. Electron Spectros. Relat. Phenomena 195, 375 (2014).
- Rehr and Ankudinov (2005) J. J. Rehr and A. L. Ankudinov, Coord. Chem. Rev. 249, 131 (2005).
- Charpentier (2011) T. Charpentier, Solid State Nucl. Magn. Reson. 40, 1 (2011).
- Bonhomme et al. (2012) C. Bonhomme, C. Gervais, F. Babonneau, C. Coelho, F. Pourpoint, T. Azaïs, S. E. Ashbrook, J. M. Griffin, J. R. Yates, F. Mauri, and C. J. Pickard, Chem. Rev. 112, 5733 (2012).
- Fiske et al. (1994) P. S. Fiske, J. F. Stebbins, and I. Farnan, Phys. Chem. Mineral 20, 587 (1994).
- Webber et al. (2010) A. L. Webber, B. Elena, J. M. Griffin, J. R. Yates, T. N. Pham, F. Mauri, C. J. Pickard, A. M. Gil, R. Stein, A. Lesage, L. Emsley, and S. P. Brown, Phys. Chem. Chem. Phys. 12, 6970 (2010).
- Chan-Huot et al. (2015) M. Chan-Huot, S. Wimperis, C. Gervais, G. Bodenhausen, and L. Duma, ChemPhysChem 16, 204 (2015).
- Ostafin and Nogaj (2007) M. Ostafin and B. Nogaj, Measurement 40, 43 (2007).
- Bonhomme et al. (2010) C. Bonhomme, C. Gervais, C. Coelho, F. Pourpoint, T. Azaïs, L. Bonhomme-Coury, F. Babonneau, G. Jacob, M. Ferrari, D. Canet, J. R. Yates, C. J. Pickard, S. A. Joyce, F. Mauri, and D. Massiot, Magn. Reson. Chem. 48, S86 (2010).
- Bräunling et al. (2010) D. Bräunling, O. Pecher, D. M. Trots, A. Senyshyn, D. A. Zherebtsov, F. Haarmann, and R. Niewa, Z. Anorg. Allg. Chem. 636, 936 (2010).
- O’Dell et al. (2011) L. A. O’Dell, R. W. Schurko, K. J. Harris, J. Autschbach, and C. I. Ratcliffe, J. Am. Chem. Soc. 133, 527 (2011).
- Nozawa et al. (2005) S. Nozawa, T. Iwazumi, and H. Osawa, Phys. Rev. B 72, 121101 (2005).
- Durmeyer et al. (2010) O. Durmeyer, E. Beaurepaire, J.-P. Kappler, C. Brouder, and F. Baudelet, J. Phys.: Condens. Matter 22, 125504 (2010).
- Manuel et al. (2012) D. Manuel, D. Cabaret, C. Brouder, P. Sainctavit, A. Bordage, and N. Trcera, Phys. Rev. B 85, 224108 (2012).
- Cabaret and Brouder (2009) D. Cabaret and C. Brouder, J. Phys.: Conf. Ser. 190, 012003 (2009).
- Brouder et al. (2010) C. Brouder, D. Cabaret, A. Juhin, and P. Sainctavit, Phys. Rev. B 81, 115125 (2010).
- Gervais et al. (2009) C. Gervais, L. Bonhomme-Coury, F. Mauri, F. Babonneau, and C. Bonhomme, Phys. Chem. Chem. Phys. 11, 6875 (2009).
- Folliet et al. (2011) N. Folliet, C. Roiland, S. Bégu, A. Aubert, T. Mineva, A. Goursot, K. Selvaraj, L. Duma, F. Tielens, F. Mauri, G. Laurent, C. Bonhomme, C. Gervais, F. Babonneau, and T. Azaïs, J. Am. Chem. Soc. 133, 16815 (2011).
- Ankudinov and Rehr (2005) A. L. Ankudinov and J. J. Rehr, Phys. Scr. T115, 24 (2005).
- Fujikawa (1999) T. Fujikawa, J. Phys. Soc. Japan 68, 2444 (1999).
- Fujikawa et al. (2015) T. Fujikawa, H. Sakuma, K. Niki, and D. Sébilleau, J. Electron Spectros. Relat. Phenomena 198, 57 (2015).
- Dumez and Pickard (2009) J.-N. Dumez and C. J. Pickard, J. Chem. Phys. 130, 104701 (2009).
- Gortari et al. (2010) I. D. Gortari, G. Portella, X. Salvatella, V. S. Bajaj, P. C. A. van der Wel, J. R. Yates, M. D. Segall, C. J. Pickard, M. C. Payne, and M. Vendruscolo, J. Am. Chem. Soc. 132, 5993 (2010).
- Robinson and Haynes (2010) M. Robinson and P. D. Haynes, J. Chem. Phys. 133, 084109 (2010).
- Dračínský and Hodgkinson (2013) M. Dračínský and P. Hodgkinson, CrystEngComm 15, 8705 (2013).
- Carof et al. (2014) A. Carof, M. Salanne, T. Charpentier, and B. Rotenberg, J. Phys. Chem. B 118, 13252 (2014).
- Pascal et al. (2014) T. A. Pascal, U. Boesenberg, R. Kostecki, T. J. Richardson, T.-C. Weng, D. Sokaras, D. Nordlund, E. McDermott, A. Moewes, J. Cabana, and D. Prendergast, J. Chem. Phys. 140, 034107 (2014).
- Pascal et al. (2015) T. A. Pascal, C. D. Pemmaraju, and D. Prendergast, Phys. Chem. Chem. Phys. 17, 7743 (2015).
- Peyrusse (2010) O. Peyrusse, High Energy Density Phys. 6, 357 (2010).
- Mazevet et al. (2014) S. Mazevet, V. Recoules, J. Bouchet, F. Guyot, M. Harmand, A. Ravasio, and A. Benuzzi-Mounaix, Phys. Rev. B 89, 100103(R) (2014).
- Dorchies et al. (2015) F. Dorchies, F. Festa, V. Recoules, O. Peyrusse, A. Benuzzi-Mounaix, E. Brambrink, A. Levy, A. Ravasio, M. Koenig, T. Hall, and S. Mazevet, Phys. Rev. B 92, 085117 (2015).
- Kühne et al. (2007) T. D. Kühne, M. Krack, F. R. Mohamed, and M. Parrinello, Phys. Rev. Lett. 98, 066401 (2007).
- Dračínský and Hodgkinson (2014) M. Dračínský and P. Hodgkinson, Chem. Eur. J. 20, 2201 (2014).
- Schwartz et al. (2009) C. P. Schwartz, J. S. Uejio, R. J. Saykally, and D. Prendergast, J. Chem. Phys. 130, 184109 (2009).
- Rossano et al. (2005) S. Rossano, F. Mauri, C. J. Pickard, and I. Farnan, J. Phys. Chem. B 109, 7245 (2005).
- Monserrat et al. (2014) B. Monserrat, R. J. Needs, and C. J. Pickard, J. Chem. Phys. 141, 134113 (2014).
- Canche-Tello et al. (2014) J. Canche-Tello, M. C. Vargas, J. Hérnandez-Cobos, I. Ortega-Blake, A. Leclercq, P. L. Solari, C. Den Auwer, and J. Mustre de Leon, J. Phys. Chem. A 118, 10967 (2014).
- Jones (2015) R. O. Jones, Rev. Mod. Phys. 87, 897 (2015).
- Born et al. (1954) M. Born, K. Huang, and M. Lax, Am. J. Phys. (Oxford University Press, Oxford, 1954).
- Baroni et al. (2010) S. Baroni, P. Giannozzi, and E. Isaev, Rev. Mineral. Geochemistry 71, 39 (2010).
- Fultz (2010) B. Fultz, Prog. Mater. Sci. 55, 247 (2010).
- Ronchi and Sheindlin (2001) C. Ronchi and M. Sheindlin, J. Appl. Phys. 90, 3325 (2001).
- Fincham et al. (1994) D. Fincham, W. C. Mackrodt, and P. J. Mitchell, J. Phys.: Condens. Matter 6, 393 (1994).
- Gavartin (2001) J. L. Gavartin, J. Phys.: Condens. Matter 13, 10873 (2001).
- Oganov et al. (2003) A. R. Oganov, M. J. Gillan, and G. D. Price, J. Chem. Phys. 118, 10174 (2003).
- Maradudin et al. (1971) A. Maradudin, E. Montroll, G. Weiss, and I. Ipatova, Theory of lattice dynamics in the harmonic approximation (Academic Press, New York, 1971).
- Brouder (1990) C. Brouder, J. Phys.: Condens. Matter 2, 701 (1990).
- Flank et al. (2006) A. M. Flank, G. Cauchon, P. Lagarde, S. Bac, M. Janousch, R. Wetter, J.-M. Dubuisson, M. Idir, F. Langlois, T. Moreno, and D. Vantelon, Nucl. Instruments Methods Phys. Res. B 246, 269 (2006).
- Giannozzi et al. (2009) P. Giannozzi, S. Baroni, N. Bonini, M. Calandra, R. Car, C. Cavazzoni, D. Ceresoli, G. L. Chiarotti, M. Cococcioni, I. Dabo, A. Dal Corso, S. de Gironcoli, S. Fabris, G. Fratesi, R. Gebauer, U. Gerstmann, C. Gougoussis, A. Kokalj, M. Lazzeri, L. Martin-Samos, N. Marzari, F. Mauri, R. Mazzarello, S. Paolini, A. Pasquarello, L. Paulatto, C. Sbraccia, S. Scandolo, G. Sclauzero, A. P. Seitsonen, A. Smogunov, P. Umari, and R. M. Wentzcovitch, J. Phys.: Condens. Matter 21, 395502 (2009).
- Perdew et al. (1996) J. P. Perdew, K. Burke, and M. Ernzerhof, Phys. Rev. Lett. 77, 3865 (1996).
- Laasonen et al. (1993) K. Laasonen, A. Pasquarello, R. Car, C. Lee, and D. Vanderbilt, Phys. Rev. B 47, 10142 (1993).
- Pickard and Mauri (2001) C. J. Pickard and F. Mauri, Phys. Rev. B 63, 245101 (2001).
- Troullier and Martins (1991) N. Troullier and J. L. Martins, Phys. Rev. B 43, 1993 (1991).
- Errea et al. (2013) I. Errea, M. Calandra, and F. Mauri, Phys. Rev. Lett. 111, 177002 (2013).
- Errea et al. (2014) I. Errea, M. Calandra, and F. Mauri, Phys. Rev. B 89, 064302 (2014).
- Hazen (1976) R. Hazen, Am. Mineral. 61, 266 (1976).
- Reeber et al. (1995) R. R. Reeber, K. Goessel, and K. Wang, Eur. J. Mineral. 7, 1039 (1995).
- Monkhorst and Pack (1976) H. J. Monkhorst and J. D. Pack, Phys. Rev. B 13, 5188 (1976).
- Gonze (1995) X. Gonze, Phys. Rev. A 52, 1096 (1995).
- Baroni et al. (2001) S. Baroni, S. de Gironcoli, A. Dal Corso, and P. Giannozzi, Rev. Mod. Phys. 73, 515 (2001).
- Gonze and Lee (1997) X. Gonze and C. Lee, Phys. Rev. B 55, 10355 (1997).
- Yates et al. (2007) J. R. Yates, C. J. Pickard, and F. Mauri, Phys. Rev. B 76, 024401 (2007).
- Pyykkö (2008) P. Pyykkö, Mol. Phys. 106, 1965 (2008).
- Taillefumier et al. (2002) M. Taillefumier, D. Cabaret, A. M. Flank, and F. Mauri, Phys. Rev. B 66, 195107 (2002).
- Gougoussis et al. (2009) C. Gougoussis, M. Calandra, A. P. Seitsonen, and F. Mauri, Phys. Rev. B 80, 075102 (2009).
- Mizoguchi et al. (2009) T. Mizoguchi, I. Tanaka, S.-P. Gao, and C. J. Pickard, J. Phys.: Condens. Matter 21, 104204 (2009).
- Jiang et al. (2013) P. Jiang, D. Prendergast, F. Borondics, S. Porsgaard, L. Giovanetti, E. Pach, J. Newberg, H. Bluhm, F. Besenbacher, and M. Salmeron, J. Chem. Phys. 138, 024704 (2013).
- Lelong et al. (2014) G. Lelong, G. Radtke, L. Cormier, H. Bricha, J.-P. Rueff, J. M. Ablett, D. Cabaret, F. Gélébart, and A. Shukla, Inorg. Chem. 53, 10903 (2014).
- Profeta et al. (2004) M. Profeta, M. Benoit, F. Mauri, and C. J. Pickard, J. Am. Chem. Soc. 126, 12628 (2004).
- He et al. (2014) L. He, F. Liu, G. Hautier, M. J. T. Oliveira, M. A. L. Marques, F. D. Vila, J. J. Rehr, G.-M. Rignanese, and A. Zhou, Phys. Rev. B 89, 064305 (2014).
- Wu and Cohen (2006) Z. Wu and R. E. Cohen, Phys. Rev. B 73, 235116 (2006).
- Perdew et al. (2008) J. P. Perdew, A. Ruzsinszky, G. I. Csonka, O. A. Vydrov, G. E. Scuseria, L. A. Constantin, X. Zhou, and K. Burke, Phys. Rev. Lett. 100, 136406 (2008).
- Laskowski et al. (2013) R. Laskowski, P. Blaha, and F. Tran, Phys. Rev. B 87, 195130 (2013).
- Wentzcovitch et al. (2010) R. M. Wentzcovitch, Z. Wu, and P. Carrier, Rev. Mineral. Geochemistry 71, 99 (2010).
- Monserrat et al. (2013) B. Monserrat, N. D. Drummond, and R. J. Needs, Phys. Rev. B 87, 144302 (2013).
- Bortz et al. (1990) M. L. Bortz, R. H. French, D. J. Jones, R. V. Kasowski, and F. S. Ohuchi, Phys. Scr. 41, 537 (1990).
- French et al. (1990) R. French, R. V. Kasowski, F. Ohuchi, D. J. Jones, H. Song, and R. Coble, J. Am. Ceram. Soc. 73, 3195 (1990).
- O’Brien et al. (1992) W. L. O’Brien, J. Jia, Q.-Y. Dong, T. A. Callcott, D. R. Mueller, and D. L. Ederer, Phys. Rev. B 45, 3882 (1992).
- Natoli (1984) C. R. Natoli, in EXAFS near-edge Struct. III (Springer, Berlin Heidelberg, 1984) pp. 38–42.
- Antonius et al. (2014) G. Antonius, S. Poncé, P. Boulanger, M. Côté, and X. Gonze, Phys. Rev. Lett. 112, 215501 (2014).
- Poncé et al. (2014) S. Poncé, G. Antonius, Y. Gillet, P. Boulanger, J. Laflamme Janssen, A. Marini, M. Côté, and X. Gonze, Phys. Rev. B 90, 214304 (2014).
- Marini et al. (2015) A. Marini, S. Poncé, and X. Gonze, Phys. Rev. B 91, 224310 (2015).
- Poncé et al. (2015) S. Poncé, Y. Gillet, J. Laflamme Janssen, A. Marini, M. J. Verstraete, and X. Gonze, J. Chem. Phys. 143, 102813 (2015).
- (90) R. Nemausat, C. Brouder, C. Gervais, and D. Cabaret, J. Phys.: Conf. Ser. (submitted).
- Newton (1982) R. G. Newton, Scattering theory of waves and particles, 2nd ed. (Springer, New York, 1982) p. 177.
- Krause and Oliver (1979) M. O. Krause and J. H. Oliver, J. Phys. Chem. Ref. Data 8, 329 (1979).
- Irikura (2007) K. K. Irikura, J. Phys. Chem. Ref. Data 36, 389 (2007).
- Cowan (1981) R. D. Cowan, The Theory of Atomic Structure and Spectra (University of California Press, 1981).