The Gaia-ESO Survey:
New constraints on the Galactic disc velocity dispersion
and its chemical dependencies ††thanks: Based on observations collected with the
FLAMES spectrograph at the VLT/UT2 telescope (Paranal Observatory, ESO, Chile),
for the Gaia-ESO Large Public Survey, programme 188.B-3002
Abstract
Context. Understanding the history and the evolution of the Milky Way is one of the main goals of modern astrophysics. In particular, the formation of the Galactic disc is a key problem of Galactic archaeology.
Aims. We study the velocity dispersion behaviour of Galactic disc stars as a function of the ratio, which for small metallicity bins can be used as a proxy of relative age. This key relation is essential to constrain the formation mechanisms of the disc stellar populations as well as the cooling and settling processes.
Methods. We used the recommended parameters and chemical abundances of FGK Milky Way field stars from the second internal data release of the Gaia-ESO spectroscopic Survey. These stars were observed with the GIRAFFE spectrograph (HR10 and HR21 setups), and cover a large spatial volume in the intervals kpc and kpc. Based on a chemical criterion, we separated the thin- from the thick-disc sequence in the plane.
Results. From analysing the Galactocentric velocity of the stars for the thin disc, we find a weak positive correlation between and that is due to a slowly rotating -poor tail. For the thick disc stars, a strong correlation with and is established. In addition, we have detected an inversion of the velocity dispersion trends with for thick-disc stars with dex and dex for the radial component. First, the velocity dispersion increases with at all ratios for the thin-disc stars, and then it decreases for the thick-disc population at the highest abundances. Similar trends are observed for several bins of within the errors for the azimuthal velocity dispersion, while a continuous increase with is observed for the vertical velocity dispersion. The velocity dispersion decrease agrees with previous measurements of the RAVE survey, although it is observed here for a greater metallicity interval and a larger spatial volume.
Conclusions. Thanks to the Gaia-ESO Survey data, we confirm the existence of -rich thick-disc stars with cool kinematics in the generally turbulent context of the primitive Galactic disc. This is discussed in the framework of the different disc formation and evolution scenarios.
Key Words.:
Galaxy: abundances - Galaxy: disc - Galaxy: kinematics and dynamics - Galaxy: stellar content - Stars: abundances1 Introduction
During the past decades, strong observational efforts have been made to understand the formation and evolution of the Milky Way (MW). To identify and characterise the Galactic structures, we need to study two main physical properties: the stellar chemistry and the kinematics. The photospheric elemental composition of low-mass stars reflects the chemical evolution history of the stellar populations, while the 3D velocities are the fossil records of the stellar motions inside the Galaxy. Thus, massive spectroscopic surveys are the best tools for distinguishing stellar populations.
The first massive and low-resolution surveys such as RAVE (Steinmetz et al. 2006) and SEGUE (Yanny et al. 2009) provided pioneer results with excellent statistics, but more detailed chemical information can be obtained from surveys with a higher resolution, such as the Gaia-ESO (GES, Gilmore et al. 2012) or APOGEE (Allende Prieto et al. 2008).
The existence of two separated thin and thick discs is still a matter of debate (see Bovy et al. 2012a) in a context where several scenarios are proposed to explain the formation of the Galactic disc stellar populations. The vertical heating of a pre-existing disc by a minor merger was proposed by several studies (Hernquist & Quinn 1989; Quinn et al. 1993; Walker et al. 1996; Villalobos & Helmi 2008). Abadi et al. (2003) argued that the thick disc is composed mostly of accreted stars from mergers of dwarf galaxies, while the coalescence of a gas-rich satellite forming a thick disc in situ was also suggested by Brook et al. (2004, 2007).
More recently, radial migration (Sellwood & Binney 2002), driven by the co-rotation (churning) or the Lindblad (blurring) resonances with the disc spiral structure, has been evoked to explain the emergence of the thick disc. Nevertheless, several authors (e.g. Minchev et al. 2012; Martig et al. 2014; Vera-Ciro et al. 2014) used numerical models to propose that migration in the sense of churning does not significantly contribute to disc thickening.
On the other hand, Bournaud et al. (2009) showed that stellar scattering by massive clumps could explain the creation of the thick disc through a purely internal mechanism. Finally, Haywood et al. (2013) proposed that the early epoch of the disc was driven by an intense star formation, which was quantified by Lehnert et al. (2014) and Snaith et al. (2015). All these proposed scenarios can be constrained by studying the chemo-dynamical relations followed by the stellar populations of the disc in a large spatial volume and with robust statistics.
To understand the dynamical heating of disc stars, one can investigate the age-Velocity-Dispersion (AVD) relation in the very close Solar neighbourhood, which was first studied by Wielen (1974, 1975), who used one thousand stars within pc from the Sun. These works highlighted the fact that old stars have a higher velocity dispersion. Wielen (1977) showed that this interesting behaviour could be explained by the diffusion of the orbits due to interactions with the local fluctuations of the gravitational field. Carlberg et al. (1985) provided a new AVD relation for F-type stars, showing a flat behaviour with age for stars older than Gyr. Based on the dwarf sample of the Geneva-Copenhagen Survey, Nordström et al. (2004) found that the AVD relation of the young disc (younger than Gyr) follows a power law. This was later revised by Seabroke & Gilmore (2007), however, who showed that no power law is needed to explain the shape of the relation. Finally, Sharma et al. (2014) constrained the thin-disc AVD relation as a power law with RAVE data by fitting a kinematic model to the observations.
All these studies are based on small samples with well-constrained distances (Hipparcos volume) or on larger samples with a low or intermediate spectral resolution. However, determining precise ages for a larger star sample is quite challenging because we lack good distance measurements and precise fundamental parameter determinations. For the youngest and oldest stars, moreover, the isochrones are crowded in these regimes, and it is harder to derive precise ages. For these reasons, the ratio has been suggested as an age proxy by several authors (Matteucci 2001; Bovy et al. 2012c; Minchev et al. 2014b). Indeed, in the early epoch of the Galaxy, the type Ia supernovae (SNIa) ejecta rapidly enriched the interstellar medium and fixed the ratio at a plateau value. Because they evolve on a long timescale, SNIa generate more iron, which leads to a decline of the ratio with increasing and forms a typical break (or knee). Interestingly, Haywood et al. (2013) and Bergemann et al. (2014) found a tight correlation between the stellar ages and the ratio. We note that Lee et al. (2011a) observed a steeper increase of the velocity dispersion as a function of the ratio in the thick disc than in the thin component.
More recently, a relation between the velocity dispersion and the ratio, used as an age proxy, has been presented by Minchev et al. (2014b). They derived a chemo-kinematical relation for the Galactic disc for giant stars of the Solar suburb (kpc and kpc) from the RAVE DR4 survey (Kordopatis et al. 2013). They found a surprising behaviour for the most Fe-poor and Mg-rich stars (dex and dex): a strong decrease of the velocity dispersion is observed while it is expected to increase because these stars should correspond to the oldest population of the Galactic disc. We note that they also observed this decrease in the SEGUE G-dwarf sample () from Lee et al. (2011a) and the ratios, instead of . In our study, we focus on the results obtained with RAVE because they have a higher resolution and were obtained using the ratio. By comparing their results with numerical simulations, Minchev et al. (2014b) concluded that this unexpected behaviour is due to perturbations by massive mergers on the outer part of the disc in the early epoch of our Galaxy, triggering a strong radial migration process that redistributed stars form the inner disc into the Solar suburb on near-circular orbits and lower velocity dispersion.
To extend this last study, we propose here to analyse the behaviour of the velocity dispersion of the Galactic disc as a function of its ratio with GES data. The observations were made with the VLT/UT2 of the European Southern Observatory. Our analysis is based on the data from the second internal data release (iDR2), which is composed of FGK dwarf and giant stars. We here have the opportunity of probing the Galactic disc more deeply because GES observes fainter targets farther away from the Solar neighbourhood. Moreover, we have a higher precision on the atmospheric parameters and chemical abundances thanks to the higher spectral resolution and wavelength coverage than was possible with RAVE.
The paper is organised as follows: we first present our stellar sample and chemically define the Galactic discs (Sect. 2), then we detail our method for the velocity dispersion derivation (Sect. 3). Section 4 is devoted to presenting our results, and we compare our chemo-kinematical relation with the one of the RAVE survey in Sect. 5. Finally, we discuss the constraints provided by this study on the different scenarios of the Galactic disc formation in Sect. 6 and then conclude and summarise our work in Sect. 7.
2 Stellar sample and characterisation of the Galactic disc
Our work is based on the second internal data release (iDR2) of the Gaia-ESO spectroscopic Survey (Gilmore et al. 2012). We chose a sample of FGK Milky Way field stars observed by the GIRAFFE spectrograph in both HR10 () and HR21 () setups. In particular, we selected stars with available radial velocity , effective temperature , surface gravity , global metallicity 111[M/H] corresponds to the proportion of all elements heavier than helium, and and 222 abundance ratios; this resulted in a sample of stars.
We recall that for iDR2, the radial velocity was determined in a first step (complete procedure described in Koposov et al., in preparation), with a median error of km s-1. Then, the fundamental parameters , , and were computed in three different independent procedures (see a short description in Recio-Blanco et al. 2014). The median dispersions among these independent measures for our sample are , dex, and dex for , and , respectively. We selected stars with a minimum signal-to-noise ratio () equal to 10, leading to distributions with a median value of 23 in HR10 and 50 in HR21.
From the atmospheric parameters, and iron-peak elemental abundances were computed by combining the determinations of three distinct methods (see Recio-Blanco et al., in preparation). To chemically characterise the Galactic disc, we focus in the following on the recommended magnesium and iron abundances. We adopted the definition , rejecting the abundances that are measured from a single spectral line. In the adopted sample, the typical median dispersions of the three independent measures are 0.06 and dex for and , respectively.
To determine the stellar kinematics, we followed the procedure described in Kordopatis et al. (2011) and Recio-Blanco et al. (2014). We recall that we derived the absolute magnitudes and then the line-of-sight distances, projecting , and on a set of Yonsei-Yale isochrones (Demarque et al. 2004). The three-dimensional Galactic coordinates of the stars were then calculated. Finally, the Galactocentric radial, azimuthal, and vertical velocities (, , and , respectively) were derived for all the stars with available proper motions from the PPMXL catalogue (Roeser et al. 2010). We adopted the Local Standard of Rest (LSR) km s-1 of Schönrich et al. (2010). The LSR is presumed to be on a circular orbit with an azimuthal velocity km s-1. For the two components of the proper motion and , the typical errors are mas/yr. The resulting median errors on the whole sample are 52, 39 and km s-1 for , , and , respectively. Finally, our main sample is composed of stars with fundamental parameters, abundances, and 3D kinematics.
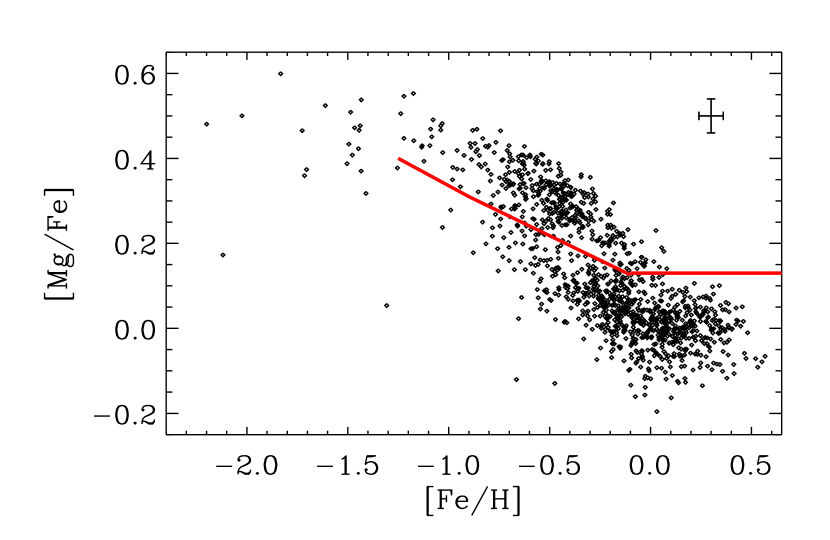
We have explored the existence of a chemical gap between the thin and the thick disc populations in the plane. This gap was first detected in high spectral resolution samples in the close Solar neighbourhood by several authors (e.g. Fuhrmann 1998; Feltzing et al. 2001; Bensby et al. 2003). It has been confirmed more recently by Adibekyan et al. (2011) and Bensby et al. (2014) still in the close Solar neighbourhood and beyond thanks to GES iDR1 (Recio-Blanco et al. 2014; Mikolaitis et al. 2014) and APOGEE (Nidever et al. 2014) data. To define this gap, we followed the same procedure as in Recio-Blanco et al. (2014) and Mikolaitis et al. (2014). We selected every star with , ( stars corresponding to of the selected sample) that we decomposed into nine bins from -1.50 to dex. Then, we searched the minimum count of each bin in the corresponding distribution. We obtained a quasi-linear separation from to dex. For the -rich and -poor end, no gap has been detected, and we thus assumed a plateau (see Figure 1). In the following, we identify stars with below that separation as thin disc stars and those above that separation as thick disc stars; we rejected stars with dex. The possible data contamination by halo stars is discussed at the end of Sect. 4.3. The separation found by Recio-Blanco et al. (2014) and Mikolaitis et al. (2014) with GES iDR1 data is thus again confirmed with the GES iDR2 data. We emphasize the fact that the two iDR1 thin- to thick-disc separations were found in the and plane, respectively, where M is the global metallicity. As a consequence, our division is slightly different from these two previous studies, but totally compatible.
3 Deriving the velocity dispersion of the Galactic disc
This section describes in detail our estimation of the stellar velocity dispersion as a function of the chemical abundance , which was adopted as a stellar clock.
For the main sample, we decomposed the plane into 2D bins. First, the axis was cut from to dex into four bins with a constant dex step. The -poor less populated tail was included in a single bin from to dex, and we adopted the same procedure for the -rich end from to dex. In total, six bins were thus considered. Second, we cut the axis into bins of dex starting from dex up to dex, and we considered a last bin including all the stars with dex. We note that for each bin, the thin- to thick-disc transition presented in Sect. 2 divides one bin into two distinct sub-samples.
For a given 2D bin, the average Galactocentric velocity and the intrinsic velocity dispersion were derived by model fitting with a maximum likelihood approach. We computed the likelihood as follows:
| (1) |
where is the measured Galactocentric velocity for a star in a given velocity component and its measured error. The measured velocity distribution can be seen as the convolution between the intrinsic distribution and the measured errors. In an equivalent manner, we minimised the log-likelihood with respect to both the mean velocity and the intrinsic velocity dispersion . To find the minimum, we investigated where the first-order derivative of goes to zero, which simultaneously solves the equations and , resulting in
| (2) |
and
| (3) |
respectively (see also for instance Godwin & Lynden-Bell 1987; Pryor & Meylan 1993). This was performed using IDL procedures.
The quality of the kinematical data is crucial for the velocity dispersion estimation because the errors in the distances and proper motions propagate in the velocity measurements and sometimes create strong outliers. Therefore, we additionally cleaned our main sample so that it includes only stars with an accuracy in , , and better than km s-1. We rejected of the stars that had extreme values of the velocity distribution, which were too far from the mean velocity. Finally, we estimated , the error on , as the standard deviation of bootstrap realisations. For a given bin containing stars, we created a new bin composed of stars. Then, we randomly selected times stars in this new bin to measure values of .
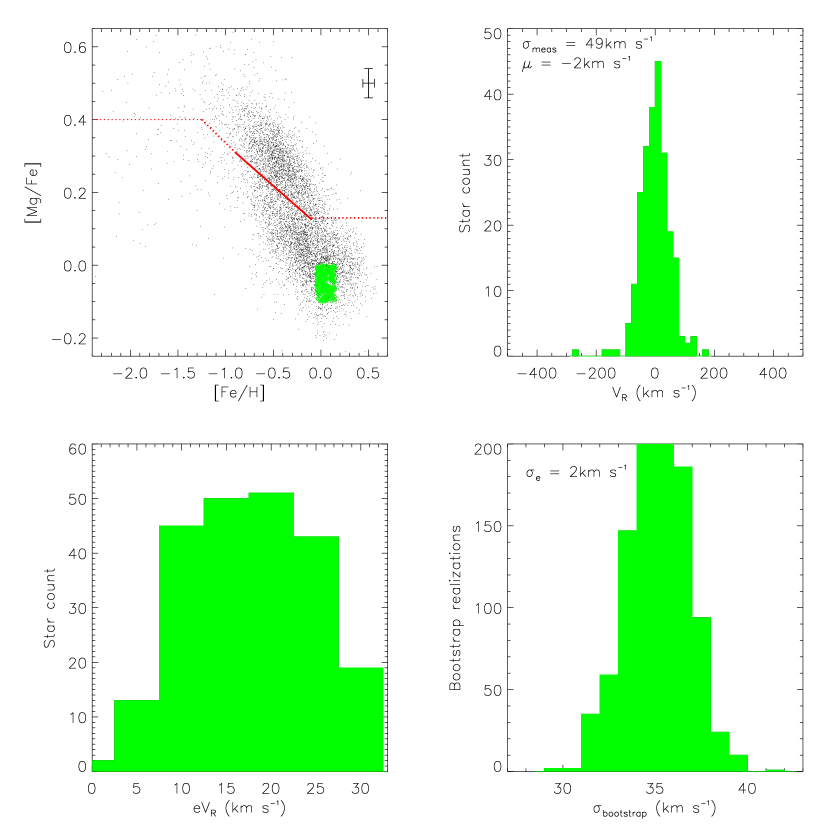
As an illustration, we show in Figure 2 the steps of the procedure we used to retrieve the velocity dispersion in the radial component for a given bin in the plane composed of 232 stars with dex and dex. Its velocity distribution is shown in the top right panel. We find a measured velocity dispersion of km s-1. By model fitting with the maximum likelihood approach, we obtain km s-1. A distribution of 1000 bootstrap realisations is shown in the bottom right panel, characterised by a standard deviation of km s-1.
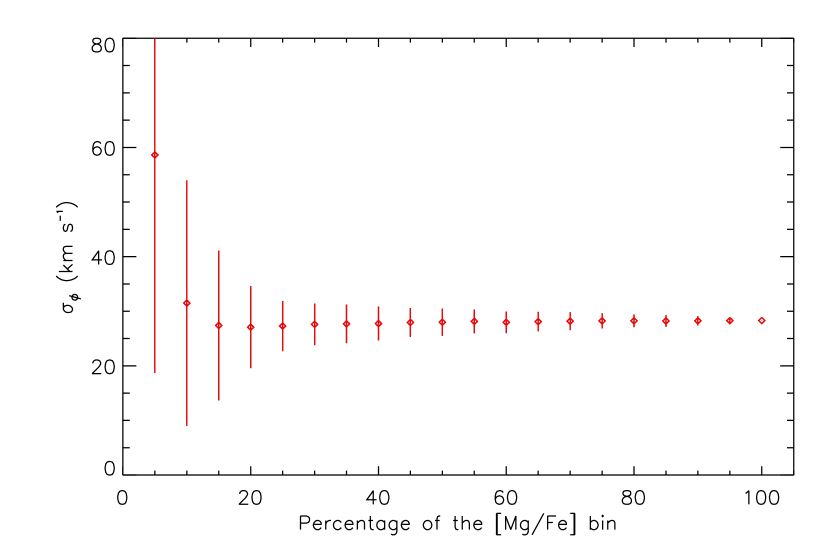
We have tested the possible influence of the low statistics on the measured velocity dispersion. To this purpose, we selected a well-populated interval from the bin dex (azimuthal component) composed of 100 stars (dex, km s-1). We randomly selected 1000 times a percentage of the stars, from to with a step. Then, we performed 1000 derivations of the velocity dispersion, computing an average and standard deviation. The resulting average of is shown in Figure 3 as a function of the percentage of the selected stars. We see that converges to a plateau after around the reference value km s-1, with an increase of km s-1 for the lowest percentage (composed of only five stars). We also tested some other bins at different and ratios and observed the same behaviour. Based on this test, we conclude that bins with more than 15 stars are reasonable for a scientific application and are suitable for a reliable interpretation in terms of kinematical properties of the disc.
Finally, from our selection criteria in terms of Galactocentric velocities, we obtained three samples composed of , and stars for the radial, azimuthal, and vertical Galactic velocity component, respectively, as shown in Figure 4. These three samples quite homogeneously cover a wide Galactic radius range from 6 to , and kpc above and below the Galactic plane. The fraction of stars belonging to the thin and thick discs as defined by the two sequences in elemental abundances is summarized in Table 1. We see that the thin disc represents of the sample. We also verified that the mapping of the plane is the same for the three samples.
| Velocity component | |||
|---|---|---|---|
| Thin disc | |||
| Thick disc |
 |
 |
 |
4 Velocity gradients and velocity dispersions in the Galactic disc
From the derived velocity dispersions, we first searched for correlations between the Galactocentric velocities with respect to and for the thin and the thick discs. We then derived the velocity dispersion relations with respect to .
4.1 Galactocentric velocities vs.
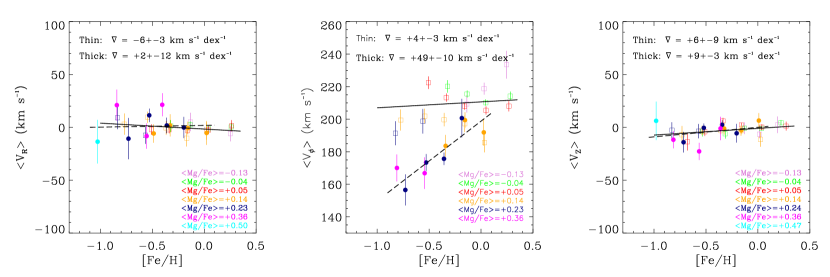
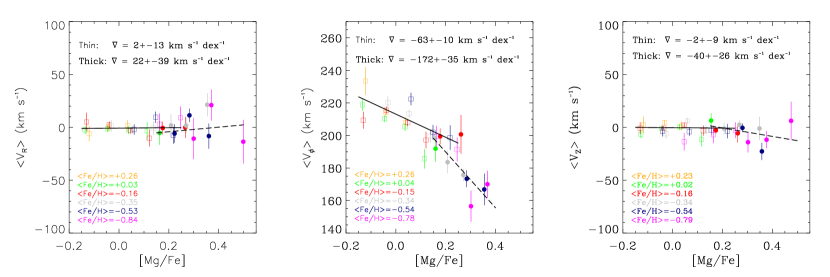
In Figure 5, we show the behaviour of the Galactocentric velocities as a function of the ratio. Each bin is also decomposed into several bins, following the same mapping of the plane as described in the previous section.
For the radial component (left panel), we see that the thick disc shows no trend within the errors with while the thin disc is characterised by a very weak negative gradient. We note that the scatter is larger for the most -poor bins in which the number of stars is lower. The relation between the vertical Galactocentric velocity and the (right panel) is similar in the thin and thick disc. Both thin and thick discs follow a unique sequence with a very weak slope, and in addition, the thin disc is compatible with no slope. Here again, the scatter of the lowest bins is due to the lower statistics. Finally, the behaviour of those two components agrees well with the expected trend for the Milky Way thin and thick discs.
In contrast, the azimuthal velocity (middle panel) shows two clearly distinct sequences. The first one corresponds to the thin disc with a weak positive gradient equal to km s-1 dex-1. The second sequence, belonging to the thick disc, is clearer with a stronger gradient km s-1 dex-1. In both cases, the slopes and their associated errors were estimated through a linear regression procedure, taking into account the statistical errors of each bin. This azimuthal gradient estimated for the thick disc agrees with the one found by Kordopatis et al. (2011) (km s-1 dex-1, even though their thick disc was not based on a chemical separation), and more recently, Recio-Blanco et al. (2014) found km s-1 dex-1 with GES iDR1 data. However, the thin-disc azimuthal gradient differs notably from previous studies. Lee et al. (2011b) and Recio-Blanco et al. (2014) found a negative gradient of km s-1 dex-1 and km s-1 dex-1, respectively. In our study, the thin disc covers dex, while in Recio-Blanco et al. (2014) and Lee et al. (2011b), the range was smaller, and , respectively. We first point out that the trend with masks a stronger one with which is directly caused by the results being Fe-range dependent. Second, we discuss the robustness of the gradient with the Fe-range. Our lowest bin for the thin disc contains 59 stars ( of main sequence (MS) stars), while the highest bin contains 299 stars ( MS). We checked that those stars have a chemical pattern in silicon and calcium that is compatible with the one presented here in . When we restrain our thin disc to a domain similar to that used by Recio-Blanco et al. (2014) and Lee et al. (2011b), i.e. dex, we find a negative gradient equal to km s-1 dex-1. This result is consistent in terms of slope with the anti-correlations found previously. In a last check, we decided to compute a new gradient, for which we removed the stars in the thin-disc sequence with dex. These stars are in the -poor thin- disc tail and show a different behaviour ( values lower than km s-1, grey and blue curves) with respect to the other thin-disc members. We note that Recio-Blanco et al. (2014) did not take this population into account to compute the gradient because they lacked good statistics. In this case, we find a slope equal to km s-1 dex-1, which is again consistent with the literature values. In summary, all these facts indicate that our azimuthal gradient is reliable. Therefore, we conclude that the thin-disc azimuthal gradient reflects the driving effect of because of the dependence on the Fe-range.
4.2 Galactocentric velocities vs.
Figure 6 presents the Galactocentric velocities as a function of . For the radial component (left panel), we found no slope for the thin disc, while the thick-disc slope is null within the error. We note that the highest bins are more scattered as a result of lower statistics. In contrast, the vertical velocity (right panel) shows a first sequence with no trend for the thin disc, while a second sequence, which corresponds to the thick disc, is characterised by a negative gradient equal to km s-1 dex-1. Because we took into account the statistics errors to compute the slopes, this negative gradient is well explained by the presence of the lowest less populated bin. If we derive the slope without taking care of the errors on the mean velocity, we find a slope equal to km s-1 dex-1. Thus, these gradients found for the radial and vertical average velocities with respect to are consistent with those obtained with respect to .
The azimuthal average velocity (middle panel) shows a strong anti-correlation with respect to that is in fact related to the increase of the velocity dispersion with age (see Sect. 6). Moreover, the thin and thick discs show two distinct sequences. The thin disc is characterised by a negative gradient of km s-1 dex-1 (Spearman’s rank correlation coefficient equal to -0.73). Here again, we tried to quantify the impact of the -poor and -rich tail of the thin disc. When we removed this population, we found a gradient equal to km s-1 dex-1, not significantly different from the full thin disc. The thick-disc anti-correlation is twice as steep and reaches km s-1 dex-1 (Spearman’s rank correlation coefficient equal to -0.84). This azimuthal velocity gradient agrees very well with the one found by Recio-Blanco et al. (2014) with GES iDR1 data (km s-1 dex-1).
4.3 Galactic disc velocity dispersion vs.
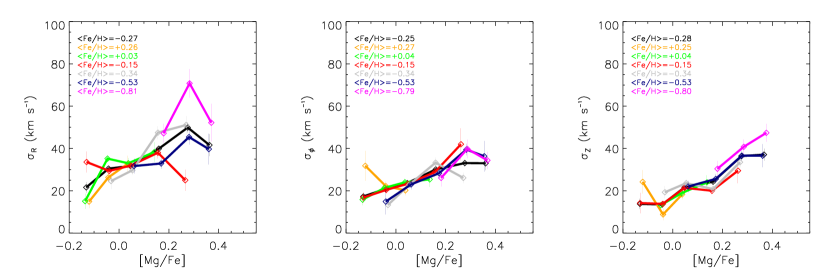
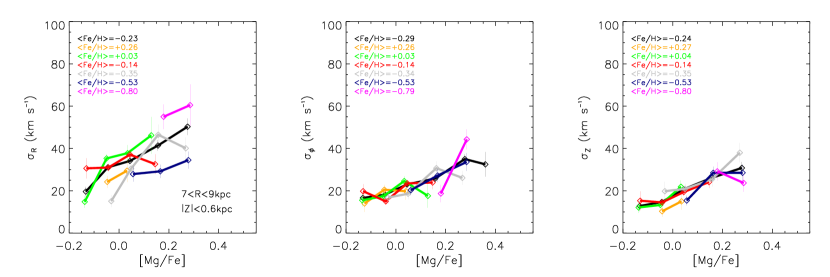
We now first present the relation between the Galactic velocity dispersion and the ratio without considering the separation between the thin and thick discs to explore a possible continuity between the two components in terms of velocity dispersion. The resulting relation is shown in Figure 7. Again, the different curves are colour-coded, while the overall trend obtained considering all the range is represented in black.
For the radial velocity dispersion , two regimes are observed. First, increases for all curves. The overall trend (in black) reaches from to km s-1 between to dex. Second, for the most -rich bins, the velocity dispersion seems to decrease. For the overall trend, a decrease of km s-1 is observed within . For the curve with dex (in red), clearly decreases by km s-1 within . While for the curve with dex (in blue) the decrease is less obvious, shows a strong drop for the most -poor curve, km s-1 within . We note that all the bins showing a decrease are populated by more than 19 stars.
For the azimuthal velocity dispersion , a single behaviour seems to be observed. A smooth increase of the velocity dispersion is seen for the overall trend (in black) from to km s-1 throughout the range. The decreasing velocity dispersion of the highest bins observed for is less evident here. A decrease by km s-1 is detected for the last sub-sample of the curve with dex, within . There are 104 stars. In addition, a drop of is suggested for the two most -rich curves (red and magenta), but it might equally well be interpreted as a plateau.
Finally, we measure a robust increase of throughout the range. The overall trend (in black) reaches from to km s-1. The different curves of follow this main trend without showing any decrease as a function of .
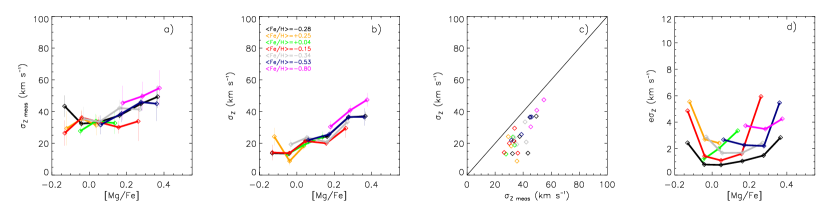
For the vertical velocity component, several quantities are plotted in Figure 8. In panel a), the measured velocity dispersion is shown as a function of the ratio. For each bin, we computed a simple standard deviation of the sample, as presented in panel b). Both measured and intrinsic dispersions are compared in panel c), and as expected, is lower. The behaviour of the error on is also shown in panel d). The errors are much smaller than the dispersion. For a given curve of , the shape of the curve is due to the smaller statistics at each edge.
To check the reliability of all these velocity dispersion trends, we tested the effect of a slight shift by dex on the curves. For , both increasing and decreasing behaviours are recovered as a function of the ratio. For the azimuthal component, we still measure an increase of , and the dispersion seems to reach a plateau for the highest bins in . Finally, the smooth rise of is recovered on average.
In addition, we checked the properties of the stars composing the bins that show a
decrease (dex). On one hand, the median errors in and therefore in distances are higher
than the typical thin-disc errors, but still lower than K and kpc,
respectively. On the other hand, the median internal errors in , ,
and Galactocentric velocities are totally comparable with the rest of the
sample, and no peculiar lines-of-sight were chosen to observe these stars.
We also checked the median internal error for each bin, which is around dex,
while the most Fe-rich/Mg-poor bin reaches dex. Moreover, the standard error
of the mean value for each bin is small, typically dex, reaching
dex for the most Fe-poor curve. As a consequence, the velocity dispersion trends
are not sensitive to the errors on . Finally, as developed in
Sect. 3, the velocity measurements for low-statistics samples
do not reflect any bias leading to an artificial under-estimation
because a minimal number of 15 stars per bin was fixed.
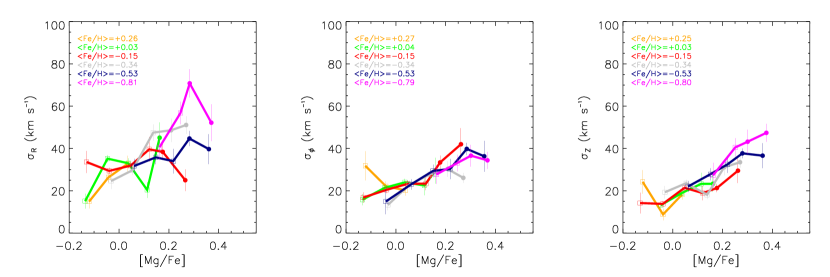
Considering the thin- to thick-disc separation determined in Sect. 2, we computed the new velocity dispersions for each velocity component of each disc to see whether the chemical separation can highlight a possible dynamical distinction. The results are shown in Figure 9. Compared to the previous plots without separation, we clearly see that regardless of the velocity component, the results are very similar. We note that for a given curve, a bin located at the thin- to thick-disc transition is divided into two smaller bins, with two values of the velocity dispersion on average equal to the entire bin (albeit with larger errors). As a result, we can determine that the thin- and thick-disc populations show very different behaviours, at least for . The thin-disc sequence follows the main increasing trend of , while the highest values of and the decreasing bins of belong to the thick-disc stars. For and the thick discs can be seen as an extension of the thin disc. The velocity increases smoothly from the thin- to the thick-disc sequences without a major visible break.
As the volume covered by our data extends to distances quite far from the Galactic plane (kpc), we tested a possible contamination of our sample by halo stars that could have artificially increased the mean velocity dispersion of some metal-poor bins. To do so, we computed the velocity dispersion for three ranges of . First, we selected the stars with kpc ( of the sample). The typical increase of is observed for all the velocity components, while the decreasing behaviour is not seen because of insufficient statistics in the higher bins. Then, we selected the stars with kpc ( of the sample), recovering most of the same trends as shown in Figure 7 thanks to the increasing number of high- stars. Finally, computing the velocity dispersion for the stars with kpc (more than of the sample), we find the trends obtained Figure 7, as expected. Therefore, the contamination from halo stars does not seem to be responsible for the observed patterns that seem to be present close to the plane, although with lower thick-disc star statistics. In addition, to bias the mean velocity dispersion estimations, the contamination would need to be in-homogeneous in for a given curve (more halo stars contaminating the intermediate bins than the high bins presenting lower dispersion values), which seems unlikely. Finally, we emphasize that the selection function is not optimised to target very metal-poor stars in large amounts, as is visible from the coverage of Figure 1 and Figure 2. We therefore conclude that the contamination by halo stars is not significant in our study.
In this section, we thus derived robust trends between the Galactocentric velocities with respect to and and found a good consistency with previous studies (Sects. 4.1 and 4.2). Moreover, we established a robust relation between and the Galactocentric velocity dispersion (Sect. 4.3). This relation is derived here for the first time for a very broad spatial coverage, probing both above and below the Galactic plane and including the Solar neighbourhood. We also showed that the stars with decreasing velocity dispersion belong entirely to the thick-disc sequence.
5 Effect of the spatial coverage
In this section, we first compare the relation established above with the recent results by Minchev et al. (2014b) for the RAVE survey. Then we study in a second part the impact of the coverage on our relation.
5.1 Comparison with the RAVE survey
In a recent paper, Minchev et al. (2014b) studied the velocity dispersion of the Galactic disc based on RAVE DR4 data (Kordopatis et al. 2013). We recall that the resolution of the RAVE survey is lower than that of GES: against . Furthermore, RAVE established the relation between the velocity dispersion and the ratio for giants () with a typical uncertainty of dex in (Boeche et al. 2011), larger than the ones adopted in the present work based on higher resolution spectra. Minchev and collaborators focused on the Solar suburb, selecting stars in the range kpc and kpc. We emphasize that our study covers a larger Galactic volume with half the sample size of the study of Minchev et al. Our results obtained with GES iDR2 data (Figure 7) are quite compatible with the work of Minchev et al. (2014b). On one hand, we recover on average the same smooth increase of as a function of , regardless of the velocity component for dex, followed by a steeper increase of up to dex. We also detect a decreasing behaviour for the most -poor and -rich stars for the radial component. However, we are able to measure a clear decrease of for the curve with dex because of the higher precision in . On the other hand, contrary to Minchev et al. (2014b), we do not detect any decrease of with , finding a smooth continuous increasing trend. We note that the lack of GES stars with dex may be responsible for not resolving the decrease observed by Minchev et al. (2014b) in this range of .
To complete our comparison, we now derive a new relation, but selecting stars with the same coverage as in Minchev et al. (2014b) (see the boxes in Figure 4). We kept exactly the same mapping of the plane, as well as the same conditions on the Galactocentric velocity errors. For each velocity component, the number of stars was then reduced, corresponding to 48, 54, and 44 of the three samples presented at the end of Sect. 3. We show our results in Figure 10. First, we see that the stellar populations with low and high tend to disappear. There is no statistics to derive a robust velocity dispersion value, the bins sometimes contain no more than three to four stars. Second, the overall trend of increases smoothly with for the three velocity components, as expected. Moreover, seems to decrease for the highest bin of the grey curve with dex. Despite the lower number of bins available to analyse with this sub-sample of the data, we see that the properties of the velocity dispersion observed with RAVE are generally compatible with the iDR2 GES data over the same Galactic volume. The GES data allow us to extend these behaviours to a much larger volume.
5.2 Probing the space
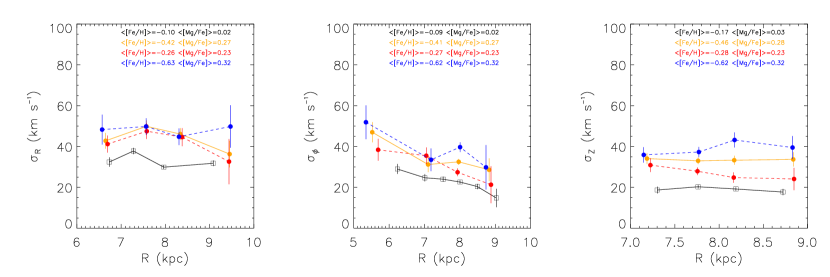
The broad spatial coverage of the GES iDR2 data allows analysing the possible dependencies of the velocity dispersion on the position of the stars in the Galaxy ( and ).
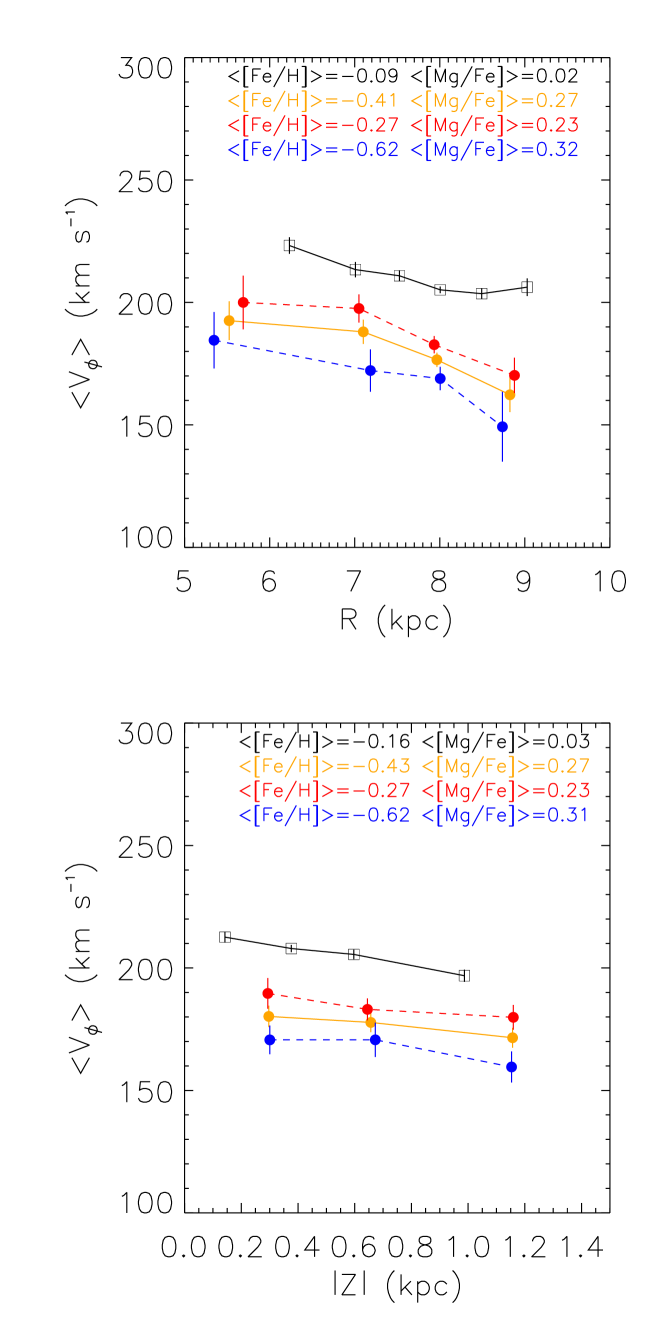
For this purpose, we first computed the velocity dispersion of each Galactic velocity component as a function of the Galactic radius , taking into account the chemical thin- to thick-disc separation (see Sect. 2). In addition, following the results of Sect. 4.3, we divided the thick disc into two sub-samples for dex and dex. We show our results in Figure 11. First, the behaviour of with for the thin and thick discs shows no clear trend; it is nearly constant around 35 and km s-1, respectively. For the thick disc, we observe that the velocity dispersion of the -poor population is higher than the -rich population. Second, shows a clear decrease with R for both discs. Within , the thin disc is characterised by a decline of km s-1 over the whole range of , while the thick disc seems to decrease by km s-1 in the same range. For , no particular trend seems to emerge for either the thin or the thick disc. We conclude that the most significant trends belong to the thin and the thick disc in the azimuthal component with a decrease of with increasing Galactocentric radius. We also note that the trend in and may be partially hidden because the samples in and do not extend as far in as the one in ( extends more towards the centre and lacks the anti-centre, while is restricted to kpc). However, a clear decrease is seen for the thick-disc azimuthal velocity with increasing radius (see Figure 13.). We also find a rough estimate of kpc for the radial scale length of the azimuthal velocity dispersion in the whole thick disc. This estimate agrees with Lewis & Freeman (1989) (kpc). We note that is expected to decrease with (see for example the study of Bovy et al. (2012b) with the SEGUE data); we do not observe this behaviour here. We checked the case where we considered the disc as a whole (no thin- to thick-disc separation) and measured a constant trend of with R. From the trends Figure 11, we measured the ratio for both the thin and the thick disc at kpc, finding for both discs. Our sample being composed of cool dwarfs and giants, this value agrees well with of Binney et al. (2014) with the RAVE survey, considering no thin- to thick-disc separation.
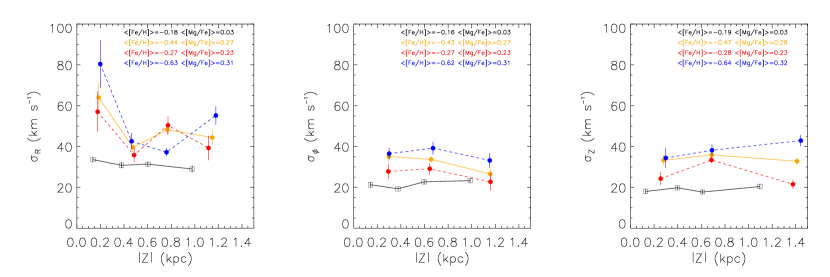
We then determined the behaviour of the velocity dispersion with the distance to the Galactic plane. To avoid possible observational biases, for example the radial trend of presented in the previous paragraph, we selected the stars in the range kpc. The results are shown in Figure 12. The thick-disc stars are divided into the same two sub-samples as in Figure 11. First, from a global point of view, we did not detect any significant trend with for the thin disc (black curve). While seems to decrease with , and tend to show a higher velocity dispersion at larger . Second, we found that the velocity dispersion of the thick disc is higher than that of the thin disc, regardless of the distance to the Galactic plane. The complete thick-disc sample (orange curve) does not show any trend for . In addition, is quite constant (isothermal) for the thin disc, which could be the signature of stars with nearly circular orbits. A decrease of km s-1 within is observed for in the range of covered. On the other hand, the trends followed by the two thick-disc sub-samples are more scattered in the radial component. We note the high-velocity dispersion of the thick-disc bins at kpc. For and , the two thick-disc populations are very well separated with no particular trends. We thus conclude that the most significant trend is the possible decrease of with for the thick disc, while the thin disc does not seem to follow any trend, apart from the higher values of the velocity dispersion at large . We checked the corresponding values of the thick-disc azimuthal velocity for the studied bins and found a weak gradient km s-1 kpc-1 within the error (see Figure 13). Kordopatis et al. (2011) found a negative gradient km s-1 kpc-1, but the range in was four times broader. A significant decrease of with was also observed by Recio-Blanco et al. (2014) with GES iDR1 data for a different and less restricted selection of stars, only for kpc. Binney et al. (2014) observed a strong increase of and with in the RAVE data, and we do not observe such a strong increase in our data, probably because we separated the disc into two thin- and thick-disc components. As a test, we checked the behaviour of with without separating it into thin- and thick-disc parts. On one hand, we observe a constant behaviour of with around km s-1. On the other hand, and increase over the whole range of of and km s-1, respectively. The increasing trend of with Z therefore agrees with the observations of Binney et al. (2014) with the RAVE data and also with the chemo-dynamical model of Minchev et al. (2013).
6 Implications on the Galactic disc formation
In this section, our results are discussed in the context of the different Galactic disc formation scenarios. First of all, our analysis can be summarized in the following points:
-
-
We chemically identified two distinct populations in the plane and defined them as the thin and thick disc (see Sect. 2).
-
-
As detailed in Sects. 4.1 and 4.2, we confirm that there is no correlation between and with respect to or to for either the thin or thick disc. However, we found a weak positive gradient of with for the thin disc, while the thick disc shows a strong positive trend. Moreover, is strongly anti-correlated with for both populations.
-
-
The thin-disc velocity dispersion increases with and seems to display a single regime (see Sect. 4.3).
-
-
The thick-disc velocity dispersion seems to show a single decreasing trend with increasing at least for the radial component (see Sect. 4.3). The decline is observed for three curves in for (between 10 and km s-1), while it is only suggested for . No decline is observed in .
-
-
For the thick disc, decreases as a function of by km s-1, while seems to decline (km s-1) with (see Sect. 5.2).
The thin- and thick-disc dichotomy is still a matter of debate (Bovy et al. 2012a). On one hand, the similarity in the physical properties between the -rich thick disc and the thin disc around dex suggests a common evolution scenario at a certain epoch in the history of the two components. This behaviour was also observed by Recio-Blanco et al. (2014) and Adibekyan et al. (2011) from the behaviour of the abundances. Moreover, a recent study by Nidever et al. (2014) with the APOGEE survey separated the Galactic disc into an -rich and an -poor population and highlighted an overlap between these populations at dex. In our study, this common behaviour is reinforced by the similar azimuthal and vertical velocity dispersions in the metal-rich regime between the two sequences. On the other hand, the chemical distinction of the two populations in the plane for dex suggests two different evolutionary paths in the formation of the Galactic disc. Moreover, we clearly detected two regimes in our chemo-kinematical analysis, both in the study of the Galactocentric velocity trends with and . The anti-correlation of the -low part of the thin disc with may be considered as a consequence of an outward migration of these stars due to epicyclic motions with their birth radii (Loebman et al. 2011). The -rich tail azimuthal velocity of the thin disc shows no trend with , suggesting a different evolutionary path than for the rest of the thin disc. In addition, both the thin and the thick discs show an anti-correlation of with , with a break at dex. As the velocity dispersion is expected to increase with age, older stars are expected to show lower (see for example Fig. 16 from Haywood et al. (2013)). Here, the plays the role of the age, and both gradient are due to the driven effect of the age-velocity dispersion relation. The knee is due to the break in the age relation (as shown by Haywood et al. (2013)).
In terms of velocity dispersion, while the thin disc seems to have slightly increasing trend with , the thick disc shows a higher dispersion with a clear decrease for the higher values at different values. Minchev et al. (2014b) first detected this unexpected decrease of the velocity dispersion with RAVE data. They proposed that several mergers of decreasing intensity heated the outer disc (which would correspond to the highest values of velocity dispersion). These mergers led to subsequent radial migration of stars from the inner disc, resulting from the induced spiral structure. Stars from the inner disc migrating outwards would show the detected cooler kinematics (see Fig. 2 in Minchev et al. 2014a). We note that this scenario is valid only if the migration did not have accompanying kinematic heating and that stars on more circular orbits preferentially migrate. In agreement with this scenario, the stars from our study that show this decline do not seem to be preferentially located in the inner (kpc) or in the outer (kpc) parts of the Galactic disc, but are homogeneously distributed as the rest of the sample in terms of line of sight. Moreover, the low observed for the sub-sample with dex and dex is significant in our data, corresponding to the metal-rich thick disc. According to Fig. 4 from Minchev et al. (2014b), the age of these stars with dex would be around Gyr with a birth radius smaller than their actual positions (according to their simulation). The larger metallicity coverage of the decrease presented in our data was nevertheless already predicted by the simulations of Minchev et al. (2014b) (see their Fig. 3). We point out that the decrease of at dex in their study is not observed in our GES data.
We note that the method of mapping the 2D abundance plane developed in both our study and in that of Minchev et al. is similar to the approach of ”mono-abundance populations” by Bovy et al. (2012b). They found that increases for SEGUE dwarf stars with high and low , but no decrease for these stars is observed. Moreover, Liu & van de Ven (2012) measured an increase of with and but the relation is less clear for rich stars.
On the other hand, the fact that the older stars (dex and dex) show a low velocity dispersion, comparable to that of the youngest thin-disc stars (Figure 9, left panel), indicates that these objects were born in a cool environment, that is to say, were shielded from strong merger perturbations in the inner disc, where the density is high, and were not heated over the subsequent Gyr. Moreover, we observe the velocity dispersion decline for different bins, reflecting different ages and stellar generations. This fact traces the chemical enrichment in iron of the disc.
We can also compare our study with the recent work of Haywood et al. (2013), who investigated the age structure of the stellar populations in the close Solar neighbourhood. Their scenario is based on a thick-disc formation through a turbulent phase marked by an intense star formation. No decrease of the velocity dispersion was observed by these authors for the more -poor stars (the oldest) of the thick disc, although we stress that their statistics is much smaller than that of our study. One of their main conclusions was that the radial migration, in the sense of churning (e.g. Schönrich & Binney 2009) did not play a fundamental role in the thick-disc formation. Haywood et al. (2013) also argued that the thick disc remained confined to the inner disc. The peak velocity dispersion that we observe for dex is compatible with an initial turbulent disc with higher random velocities. Nevertheless, this picture has to somehow leave room for the existence of a small proportion of thick disc stars with cool kinematics (those in the high- bins with the observed dispersion decrease).
On the other hand, the cool kinematics of the Mg-rich tail of the thick-disc stars does not support the idea of accreted satellites, as proposed by Abadi et al. (2003). The velocity dispersion of the older stars in our study is too low compared to the expected behaviour of the thick-disc stars in their simulation (km s-1). The presence of a cool thick-disc tail could not be interpreted by the formation mechanism proposed by Bournaud et al. (2009) either, who evoked a clumpy star formation. The proposed perturbations in the disc lead to a scatter of both the stars and the gas, increasing the velocity dispersions without room for the existence of stars with cool kinematics in the higher bins at each ratio. The scenario suggested by Brook et al. (2004), who argued that a gas-rich merger was responsible of the thick-disc formation, cannot explain the presence of such dynamically cool stars either. In their numerical simulation, the thick-disc phase is characterised by a strong increase of the stellar velocity dispersion with age, again in contradiction with the trends observed here.
Finally, we can discuss our results in the context of the scenario proposed by Villalobos & Helmi (2008), who argued that the thick disc was built by a pre-existing disc that was heated by a minor merger. Their model predicts a remnant-disc with cool kinematics, composed of old stars, with a typical location below kpc. These old stars would roughly correspond in our study to the bins with dex and dex. For a given bin, these stars are characterised by cooler kinematics, and of the stars are located below kpc. These stars might be good candidates to represent this remnant-primary old disc, because it is not affected by the merger event. However, the fact that the stars with cooler kinematics show a particular chemical pattern (higher values at each bin) than the stars with hot kinematics presents a difficulty for this scenario. On the other hand, the possibility of a chemical segregation between the heated and the non-heated stars could be considered. In particular, the old confined disc might have been more efficient in forming stars and recycling metals than the heated disc.
7 Conclusion
From the internal data release 2 of the Gaia-ESO Survey, we selected a sample of FGK stars to study the chemo-kinematical structure of the Galactic disc. We derived the kinematics of these stars based on the fundamental parameters and proper motions. Based on the and abundances, we found a chemical gap between a first population with dex and dex and a second group with dex and dex that we associated with the thin- and thick-disc sequences, respectively.
We derived the trends between the three-dimensional Galactic velocities and the and ratios. We found a weak correlation between and for the thin disc due to the presence of a -poor tail, while a strong correlation was established for the thick disc, in agreement with previous studies.
Located within kpc and kpc, the GES iDR2 data allowed us to derive a relation between the Galactic velocity dispersion and the ratio, covering therefore a large Galactic disc volume. In terms of velocity dispersion, on one hand, the thin disc shows a smooth increase of with increasing . On the other hand, the thick disc can be seen as a continuity of the thin disc and reflects a decrease of its radial velocity dispersion for the stars with the highest values of . This is the second time that this behaviour is observed; it was first discovered by Minchev et al. (2014b) with RAVE and SEGUE data. The low dispersion observed for the most -rich bins suggests that these stars were formed in a relatively quiet environment. Moreover, our observations could be explained by the scenario of Minchev et al. (2014b): a series of merger events perturbing and heating the outer disc, inducing spiral arms that propel stars outwards in the disc. On the other hand, other proposed scenarios of thick-disc formation, including external or internal mechanisms, need to be refined to take into account this new observational constraint: the existence of a sub-sample of old disc stars with cool kinematics that show a particular and distinct chemical pattern, but are embedded in a generally turbulent context.
Finally, we conclude that combining individual chemical abundances and kinematics is a powerful tool for studying the stellar populations of the Milky Way, provided that both the chemical and kinematical estimates are derived with high enough precision. On the other hand, we worked in the context of the used as an age proxy, and we note that we cannot exclude that if the -age correlation fails, the stars presenting cool kinematics and high- values could be formed at recent epochs, which would completely change the picture of the interpretation scenarios. Further investigations are necessary to probe an always larger volume with an increasing number of stars, for example with the next data releases of the Gaia-ESO Survey and the spatial mission Gaia from the European Space Agency. The possibility of deriving precise stellar ages to directly study the age-velocity dispersion will be a huge qualitative improvement in our comprehension of the Galactic disc evolution.
Acknowledgements.
We are grateful to the referee for the constructive comments that have helped us to improve our paper. G. Guiglion and A. Recio-Blanco thank Paola di Matteo and Misha Haywood for their careful reading of the paper and constructive comments. Based on data products from observations made with ESO Telescopes at the La Silla Paranal Observatory under programme ID 188.B-3002. These data products have been processed by the Cambridge Astronomy Survey Unit (CASU) at the Institute of Astronomy, University of Cambridge, and by the FLAMES/UVES reduction team at INAF/Osservatorio Astrofisico di Arcetri. These data have been obtained from the Gaia-ESO Survey Data Archive, prepared and hosted by the Wide Field Astronomy Unit, Institute for Astronomy, University of Edinburgh, which is funded by the UK Science and Technology Facilities Council. This work was partly supported by the European Union FP7 programme through ERC grant number 320360 and by the Leverhulme Trust through grant RPG-2012-541. We acknowledge the support from INAF and Ministero dell’ Istruzione, dell’ Università’ e della Ricerca (MIUR) in the form of the grant ”Premiale VLT 2012”. The results presented here benefit from discussions held during the Gaia-ESO workshops and conferences supported by the ESF (European Science Foundation) through the GREAT Research Network Programme. A. Recio-Blanco, P. de Laverny and V. Hill acknowledge the ”Programme National de Cosmologie et Galaxies” (PNCG) of CNRS/INSU, France, for financial support.References
- Abadi et al. (2003) Abadi, M. G., Navarro, J. F., Steinmetz, M., & Eke, V. R. 2003, ApJ, 597, 21
- Adibekyan et al. (2011) Adibekyan, V. Z., Santos, N. C., Sousa, S. G., & Israelian, G. 2011, A&A, 535, L11
- Allende Prieto et al. (2008) Allende Prieto, C., Majewski, S. R., Schiavon, R., et al. 2008, Astronomische Nachrichten, 329, 1018
- Bensby et al. (2003) Bensby, T., Feltzing, S., & Lundström, I. 2003, A&A, 410, 527
- Bensby et al. (2014) Bensby, T., Feltzing, S., & Oey, M. S. 2014, A&A, 562, A71
- Bergemann et al. (2014) Bergemann, M., Ruchti, G. R., Serenelli, A., et al. 2014, A&A, 565, A89
- Binney et al. (2014) Binney, J., Burnett, B., Kordopatis, G., et al. 2014, MNRAS, 439, 1231
- Boeche et al. (2011) Boeche, C., Siebert, A., Williams, M., et al. 2011, AJ, 142, 193
- Bournaud et al. (2009) Bournaud, F., Elmegreen, B. G., & Martig, M. 2009, ApJ, 707, L1
- Bovy et al. (2012a) Bovy, J., Rix, H.-W., & Hogg, D. W. 2012a, ApJ, 751, 131
- Bovy et al. (2012b) Bovy, J., Rix, H.-W., Hogg, D. W., et al. 2012b, ApJ, 755, 115
- Bovy et al. (2012c) Bovy, J., Rix, H.-W., Liu, C., et al. 2012c, ApJ, 753, 148
- Brook et al. (2007) Brook, C., Richard, S., Kawata, D., Martel, H., & Gibson, B. K. 2007, ApJ, 658, 60
- Brook et al. (2004) Brook, C. B., Kawata, D., Gibson, B. K., & Freeman, K. C. 2004, ApJ, 612, 894
- Carlberg et al. (1985) Carlberg, R. G., Dawson, P. C., Hsu, T., & Vandenberg, D. A. 1985, ApJ, 294, 674
- Demarque et al. (2004) Demarque, P., Woo, J.-H., Kim, Y.-C., & Yi, S. K. 2004, ApJS, 155, 667
- Feltzing et al. (2001) Feltzing, S., Holmberg, J., & Hurley, J. R. 2001, A&A, 377, 911
- Fuhrmann (1998) Fuhrmann, K. 1998, A&A, 338, 161
- Gilmore et al. (2012) Gilmore, G., Randich, S., Asplund, M., et al. 2012, The Messenger, 147, 25
- Godwin & Lynden-Bell (1987) Godwin, P. J. & Lynden-Bell, D. 1987, MNRAS, 229, 7P
- Haywood et al. (2013) Haywood, M., Di Matteo, P., Lehnert, M. D., Katz, D., & Gómez, A. 2013, A&A, 560, A109
- Hernquist & Quinn (1989) Hernquist, L. & Quinn, P. J. 1989, in NATO Advanced Science Institutes (ASI) Series C, Vol. 264, NATO Advanced Science Institutes (ASI) Series C, ed. C. S. Frenk, R. S. sEllis, T. Shanks, A. R. Heavens, & J. A. Peacock, 427
- Kordopatis et al. (2013) Kordopatis, G., Gilmore, G., Steinmetz, M., et al. 2013, AJ, 146, 134
- Kordopatis et al. (2011) Kordopatis, G., Recio-Blanco, A., de Laverny, P., et al. 2011, A&A, 535, A107
- Lee et al. (2011a) Lee, Y. S., Beers, T. C., Allende Prieto, C., et al. 2011a, AJ, 141, 90
- Lee et al. (2011b) Lee, Y. S., Beers, T. C., An, D., et al. 2011b, ApJ, 738, 187
- Lehnert et al. (2014) Lehnert, M. D., Di Matteo, P., Haywood, M., & Snaith, O. N. 2014, ApJ, 789, L30
- Lewis & Freeman (1989) Lewis, J. R. & Freeman, K. C. 1989, AJ, 97, 139
- Liu & van de Ven (2012) Liu, C. & van de Ven, G. 2012, MNRAS, 425, 2144
- Loebman et al. (2011) Loebman, S. R., Roškar, R., Debattista, V. P., et al. 2011, ApJ, 737, 8
- Martig et al. (2014) Martig, M., Minchev, I., & Flynn, C. 2014, MNRAS, 443, 2452
- Matteucci (2001) Matteucci, F., ed. 2001, Astrophysics and Space Science Library, Vol. 253, The chemical evolution of the Galaxy
- Mikolaitis et al. (2014) Mikolaitis, Š., Hill, V., Recio-Blanco, A., et al. 2014, A&A, 572, A33
- Minchev et al. (2013) Minchev, I., Chiappini, C., & Martig, M. 2013, A&A, 558, A9
- Minchev et al. (2014a) Minchev, I., Chiappini, C., & Martig, M. 2014a, ArXiv e-prints
- Minchev et al. (2014b) Minchev, I., Chiappini, C., Martig, M., et al. 2014b, ApJ, 781, L20
- Minchev et al. (2012) Minchev, I., Famaey, B., Quillen, A. C., et al. 2012, A&A, 548, A127
- Nidever et al. (2014) Nidever, D. L., Bovy, J., Bird, J. C., et al. 2014, ArXiv e-prints
- Nordström et al. (2004) Nordström, B., Mayor, M., Andersen, J., et al. 2004, A&A, 418, 989
- Pryor & Meylan (1993) Pryor, C. & Meylan, G. 1993, in Astronomical Society of the Pacific Conference Series, Vol. 50, Structure and Dynamics of Globular Clusters, ed. S. G. Djorgovski & G. Meylan, 357
- Quinn et al. (1993) Quinn, P. J., Hernquist, L., & Fullagar, D. P. 1993, ApJ, 403, 74
- Recio-Blanco et al. (2014) Recio-Blanco, A., de Laverny, P., Kordopatis, G., et al. 2014, A&A, 567, A5
- Roeser et al. (2010) Roeser, S., Demleitner, M., & Schilbach, E. 2010, AJ, 139, 2440
- Schönrich & Binney (2009) Schönrich, R. & Binney, J. 2009, MNRAS, 399, 1145
- Schönrich et al. (2010) Schönrich, R., Binney, J., & Dehnen, W. 2010, MNRAS, 403, 1829
- Seabroke & Gilmore (2007) Seabroke, G. M. & Gilmore, G. 2007, MNRAS, 380, 1348
- Sellwood & Binney (2002) Sellwood, J. A. & Binney, J. J. 2002, MNRAS, 336, 785
- Sharma et al. (2014) Sharma, S., Bland-Hawthorn, J., Binney, J., et al. 2014, ApJ, 793, 51
- Snaith et al. (2015) Snaith, O., Haywood, M., Di Matteo, P., et al. 2015, A&A, 578, A87
- Steinmetz et al. (2006) Steinmetz, M., Zwitter, T., Siebert, A., et al. 2006, AJ, 132, 1645
- Vera-Ciro et al. (2014) Vera-Ciro, C., D’Onghia, E., Navarro, J., & Abadi, M. 2014, ApJ, 794, 173
- Villalobos & Helmi (2008) Villalobos, Á. & Helmi, A. 2008, MNRAS, 391, 1806
- Walker et al. (1996) Walker, I. R., Mihos, J. C., & Hernquist, L. 1996, ApJ, 460, 121
- Wielen (1974) Wielen, R. 1974, Highlights of Astronomy, 3, 395
- Wielen (1975) Wielen, R. 1975, in La Dynamique des galaxies spirales, ed. L. Weliachew, 357
- Wielen (1977) Wielen, R. 1977, A&A, 60, 263
- Yanny et al. (2009) Yanny, B., Rockosi, C., Newberg, H. J., et al. 2009, AJ, 137, 4377