Electrochemical setup — a unique chance to simultaneously control orbital energies and vibrational properties of single-molecule junctions with unprecedented efficiency†
Ioan Bâldea ∗ a‡
Published: Phys. Chem. Chem. Phys. 2014, 16, 25942-25949, DOI: 10.1039/C4CP04316B
Abstract:
Impressive advances in nanoscience permit nowadays to manipulate single molecules and broadly control many of their properties. Still, tuning the molecular charge and vibrational properties of single molecules embedded in nanojunctions in broad ranges escaped so far to an efficient control. By combining theoretical results with recent experimental data, we show that, under electrochemical control, it is possible to continuously drive a redox molecule (viologen) between almost perfect oxidized and reduced states. This yields an unprecedentedly efficient control on both vibrational frequencies and the surface-enhanced Raman scattering (SERS) intensities. The broad tuning achieved under electrochemical control by varying the overpotential (“gate potential”) within experimentally accessible ranges contrasts to the case of two-terminal setups that require high biases, which real nanojunctions cannot withstand. The present study aim at stimulating concurrent transport and SERS measurements in electrochemical setup. This may open a new avenue of research that is not accessible via two-terminal approaches for better understanding the transport at nanoscale.
Keywords: nanotransport; single-molecule junctions; electrochemical scanning tunneling microscopy; surface-enhanced Raman spectroscopy; electrolyte gating; redox molecules; viologen
1 Introduction
Despite important advances in the last decades, molecular electronics remains confronted with a series of difficulties. Many of them result from unsatisfactory characterization of a molecule under in situ conditions. Properties of a molecule embedded in a nanojunction in a current-carrying state may differ from its equilibrium properties in a manner reminding differences between biological cells in in vivo and in vitro situations. Fundamental processes at nanoscale and tailoring molecular devices for practical applications can be better understood if transport data can be correlated with other molecular properties obtained from independent measurements of a different kind. Vibrational properties deduced via surface-enhanced Raman spectroscopy (SERS) belong to this category, since they can provide valuable complementary information needed for a better in situ characterization.
Recent concurrent SERS 1 and ohmic conductance studies on single-molecule junctions represent significant attempts in this direction. Since the first demonstration that SERS can be employed to study molecular junctions, 2 there is a continuing interest to utilize this technique in molecular electronics.3, 4, 5, 6, 7, 8, 9 The electrodes of molecular junctions can act as highly efficient plasmonic antennas.10 The enormous local electric field (especially close to the sharp tip of a scanning tunneling microscope 7 or a nanoparticle 11) can have a dramatic effect on the surface-enhanced Raman scattering from molecules in junctions. Correlating SERS data with simultaneously acquired conductance data provides important evidence on the chemical identity of the active molecule, on how it bonds to electrodes, and on experimental conditions (e.g., solvent, sample treatment, etc). At low biases corresponding to a linear transport regime, these refer to properties of the molecule (linked to electrodes but) at equilibrium (fluctuation-dissipation theorem). In particular, they refer to a molecule in a given charge (often neutral) state.
Applying higher biases on a molecular junction may change molecular properties, also including the charge of the molecule, and this change can reflect itself in a change of its vibrational properties. A recent SERS study on fullerene-based electromigrated junctions 12 found that vibrational frequencies are significantly shifted under applied bias. Companion density functional theory (DFT) calculations indicated that the observed frequency shifts are inconsistent with a simple vibrational Stark effect, but they can result from a bias-driven change of the electronic charge of the molecule.12 By applying realistic source-drain voltages in a two-terminal setup, it is only a very partial reduction (in contradistinction to a complete reduction of the molecular species, corresponding to changing the molecular charge by an entire electron) that can be achieved (cf. Ref. 12 and Fig. 4).
The theoretical results reported in this paper, obtained by combining a model study backed by companion quantum chemical calculations and existing experimental data, 13 demonstrate that an SERS study in electrochemical scanning tunneling microscopy (EC-STM) setup can provide valuable information complementary to that obtained via a single-molecule transport study. The EC-STM approach exploits the flexibility of a three-terminal setup: both the bias between the STM-tip () and substrate () and the overpotential 14, 13 can be independently controlled. For viologen-based junctions,13 the equilibrium potential V. Charge transport through several redox systems in EC-STM setup has been experimental studied 15, 16, 17, 13, 18, 19 but corresponding SERS experiments are missing. The advantages of this setup introduced in Tao’s seminal work,14 which enables a practically complete reduction/oxidation of the molecular species, for concurrent SERS and transport studies will be emphasized.
2 Methods
To demonstrate the usefulness of a concurrent SERS and transport study through a redox unit embedded in a single-molecule junction in a three-terminal electrochemical setup, we will consider viologen-based molecular junctions, which were investigated in a comprehensive experimental study.13
The core of this molecule consists of a redox-active 4,4′-bipyridinum dication (44BPY++). The parent (neutral bipyridine 44BPY0) molecule embodied in nanojunctions formed the object of numerous transport,20, 21, 22 transport-related 23, 24, 25, 26 and SERS 27, 7, 9 studies. This redox-active molecule was used, e.g., as backbone in self-assembled monolayers 28, 29, 30 and in various functional materials.31, 32 It is a showcase redox molecule; the first oxidation-reduction process 44BPY 44BPY+∙, which will be examined below, is completely reversible in bulk solutions.13
High-level quantum chemical calculations at the density functional theory (DFT) level using the Becke’s three-parameter hybrid functional B3LYP and basis sets of triple-zeta quality augmented with diffuse functions (aug-cc-pVTZ) as implemented in the GAUSSIAN 09 package 33 have been performed for geometry optimizations and for obtaining the Raman spectra of the oxidized and reduced viologen core (dication 44BPY++ and radical cation 44BPY+∙, respectively), which are the charge species that contribute to the measured current 13 in the specific case considered in this paper.
In addition to the validation against the experimental transport data, we have also microscopically validate the Newns-Anderson model employed below by calculating the lowest electron affinities at the EOM-CCSD (equation-of-motion coupled cluster singles and doubles) level,34 which represents the quantum chemistry state-of-the-art for molecules of this size; see the ESI†.
To compute the vibrational frequencies and Raman scattering intensities of a molecular junction under bias (), we have resorted to an interpolation weighting method described in the ESI†, wherein the weight is expressed in terms of the - and -dependent LUMO occupancy.
3 Results
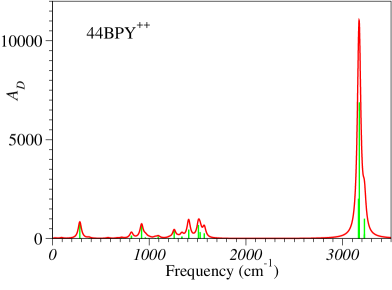
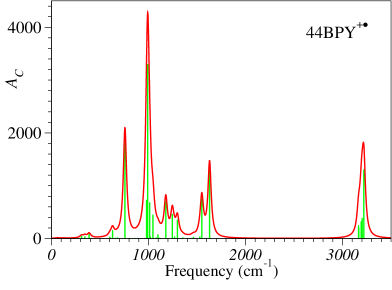
The Raman spectra of the dication (44BPY++) and cation (44BPY+∙) species in acetonitrile computed as described in ESI† are presented in Table S1 and Fig. 1, Fig. 2, Fig. S1, Fig. S2, Fig. S3, and Fig. S4. (Throughout, label S refers to ESI†). These results reveal notable differences between vibrational properties of the two different redox charge species. Both vibrational frequencies and Raman scattering intensities significantly depend on the charging state.
For SERS observability, the important issue is whether a transport setup permits to broadly control the molecular charge, enabling a continuously switching between the dicationic (44BPY++) and cationic (44BPY+∙) species. They correspond to an oxidized () and a reduced () LUMO, respectively. As a central point of the present analysis, we have used the transport data of Ref. 13 to show that the EC-STM transport setup does enable this switching.
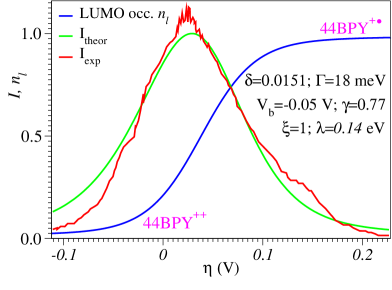
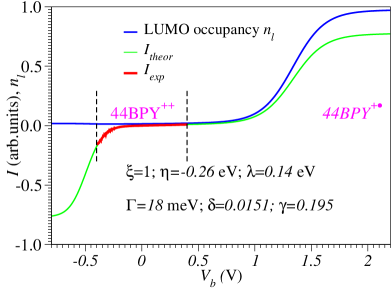
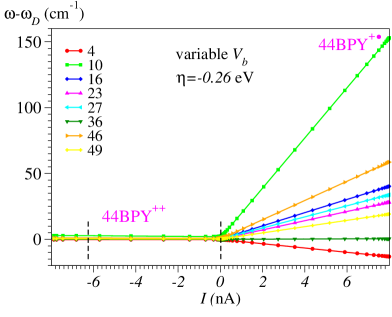
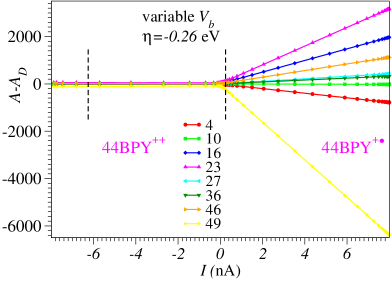
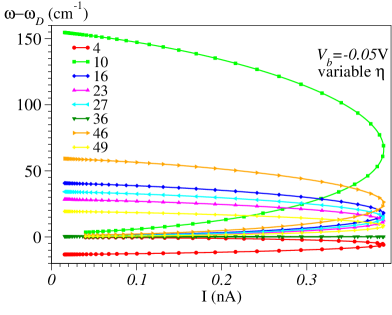
In an EC-STM setup, transport data can be acquired in two basic modes: constant bias and variable bias modes. In constant bias mode, the STM-tip () and substrate () potentials are varied such that is kept constant. In variable mode, is varied at constant substrate potential (). As visible in Fig. 3 and Fig. 4, the theoretical curves successfully reproduce the experimental currents 13 measured in both aforementioned modes. Because the Newns-Anderson model utilized to obtain these theoretical curves has been discussed in detail elsewhere, only a few relevant details are given below and in the ESI†.
An aspect worth to mention is the LUMO position. The LUMO energy utilized in the transport calculations lies at eV above electrodes’ equilibrium Fermi energy, in agreement with the experimental data.13 Noteworthy, this value, which implicitly enters the definition of the overpotential (see Sec. 1 and, for example, the Supporting Information of ref. 35), corresponds to a LUMO energy of the embedded molecule, is different from that of the isolated molecule. Schemes to disentangle this energy difference in contributions with clear physical origin have been discussed recently.22, 36
As another particularly relevant detail, we mention the substantial asymmetry of the molecule-electrode couplings , where , of the viologen-based EC-STM junctions.13 The value (see legends of Fig. 4 and Fig. 3), or alternatively , realistically accounts for the experimental setup of ref. 13; the viologen molecule is chemically bound to the substrate () but not to the STM tip (). Albeit substantial, this asymmetry is not so pronounced as recently found for azurin-based EC-STM junctions.35
Once validating the transport model, we have employed it to compute the bias dependent LUMO occupancy , which is also shown in Fig. 3 and Fig. 4.
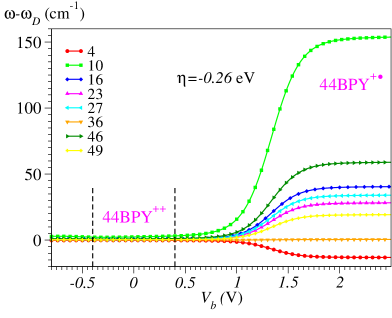
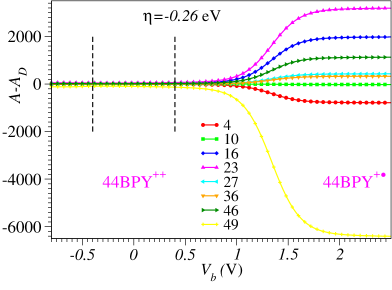
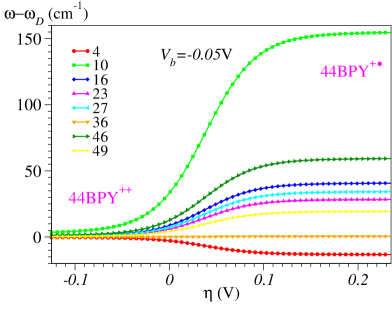
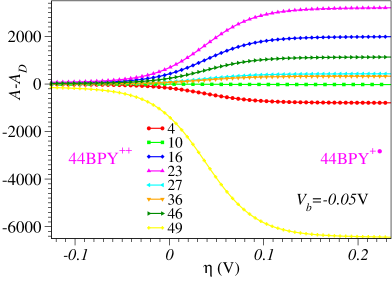
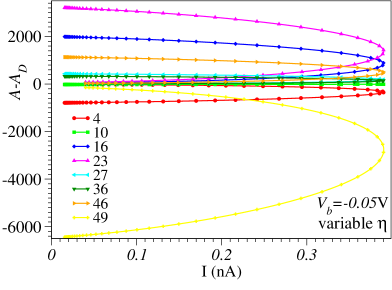
As alternative to other approaches to SERS in biased molecular junctions,39 to estimate the vibrational frequencies and the Raman scattering intensities of the various modes we adopt here an interpolation method described in ESI†. The - and -dependencies of and follow from those of . They are depicted in Fig. 5 and Fig. 6. The dependence shown in Fig. 3 represents a key point of the present analysis.
4 Discussion
Fig. 3 and Fig. 4 show that, in principle, the charge of a molecule embedded in a biased EC-STM junction can be controlled both in constant bias mode and variable bias mode. However, as far as the bias ranges (that can be) accessed in experiment 13 are concerned, there is an important quantitative difference between the two operating modes.
Within the whole -range that has been sampled in experiment ( V 13) the LUMO occupancy is negligible (, cf. Fig. 4). This corresponds to an almost perfect oxidized 44BPY++ state. As shown in Fig. 5, this yields a negligible -dependence of the vibrational frequencies and Raman scattering intensities. A significant change in LUMO occupancy, also accompanied by significant variations of the vibrational properties (cf. Fig. 5), can only be achieved at substantially larger ’s, which molecular junctions could hardly withstand. This is a general feature of the off-resonant tunneling in two-terminal setup.
Fig. 3 depicts a totally different situation. By varying the overpotential within the range accessed in experiment,13 the LUMO occupancy can be continuously tuned between an almost perfect oxidized state (, 44BPY++) and an almost perfect reduced state (, 44BPY+∙). Because constant bias experiments can practically sample the whole range , the values and can continuously cover the values of the various () vibrational modes corresponding to the dicationic and cationic species. The complete list of ’s and ’s for 44BPY++ and 44BPY+∙ is presented in Table S1 - and -dependencies of several representative vibrational modes are shown in Fig. 5 and Fig. 6. In contrast to the insignificant impact of (Fig. 5), -driven variations and like those depicted there are substantial (Fig. 6). Frequencies and intensities of the various Raman active modes are affected in different ways. For some modes, the state of charge only has a weak impact on the frequency while the intensity is strongly affected and vice versa. The frequency of mode 10 (ring out-of-plane deformation) exhibits the highest frequency change: cm-1. Although the Raman activity decreases by one order of magnitude upon reduction (cf. Table S1), the small intensity of this mode would probably be challenging for experimentalists. At the other extreme, the LUMO reduction only yields a decrease in frequency of mode 49 (CH stretch) amounting to cm-1. However, the Raman intensity of this mode (which is the highest for the dication, cf. Table S1) is diminished by a factor . This makes it a good candidate to be monitored in experiments. The other modes shown in Fig. 5 and Fig. 6 are those identified in experimental Raman spectra of the radical anion 44BPY-∙;40 see ESI† for further details. Here we only note that mode 64 is related to the so-called quinoidal distortion, corresponding to a shortening of the inter-ring C-C bond and of the C-C bond parallel to it, and a lengthening of the C-C bond between them as well as of the C-N bond. 40, 23
In an EC-STM setup similar to that of Ref. 13, the electromagnetic (EM) enhancement occurs in a tiny region near the STM tip, and the charge transport mainly proceeds through the single (physisorbed) molecule which is closest to it. Still, other molecules nearby may also feel a significant electromagnetic enhancement and may also experience LUMO energy shifts driven by more or less similar local and values [cf. Eq. (S1)]; the spatial potential profile is hard to control/determine. So, the recorded SERS dependence on (and ) may not be (entirely) due to the (single) molecule mediating the charge transport. Therefore, correlating the measured SERS with the currents measured by varying (or ) rather than with (or ) is preferable; it would be the most clear indication that the Raman signals come from the particular molecules inside the nanogap that are responsible for the current between the electrodes. Results in this form are depicted in Fig. 7 and Fig. 8. They may be more useful to experimentalists than Fig. 5 and Fig. 6.
5 Remarks on experimental challenges
Let us briefly motivate why, in the above presentation, we have (i) considered transport data for molecular junctions placed in solvent and (ii) referred to SERS as the technique to reveal the substantial dependence on the molecular charge of the vibrational properties predicted by our calculations.
(i) Given the impossibility of achieving a substantial reduction of the molecular species (significant change in the molecular charge) by varying the source-drain bias , an efficient molecular orbital gating appears to be irreplaceable. The molecular junctions studied in ref. 41 exhibit the most substantial orbital gating effect known to date in “dry” molecular electronics. We checked by calculations similar to those presented above that, for those junctions, changes in molecular charges do not exceed a few percent. This fact can actually be understood intuitively by examining, e.g., Fig. S7 of the supplementary information of ref. 41, which shows curves that do not exhibit any peak; a substantial reduction (oxidation) can only be obtained if the gate potential utilized in experiments 41 sample sufficiently extended portions of the transfer characteristics comprising a maximum (which is the counterpart of the maximum of the -curve shown in Fig. 3).
In principle, with a molecular orbital gating in “dry” environment substantially improved well beyond the present achievements, 41 changes in molecular vibrational properties comparable to those presented above could also occur in nanojunctions placed in vacuum, as demonstrated by the data in Table S3. But, according to the state-of-the-art in the field, a(n almost) complete reduction of the molecular species (changing the molecular charge by an entire electron) can only be reached via the efficient electrolyte gating discussed in the present paper.
(ii) It is hard to conceive that IETS (inelastic electron tunneling spectroscopy) 42, 43, 44 can be utilized for the present purpose. Rather than SERS, IETS is the choice of experimentalists for revealing vibrational effects in the charge transport through molecular junctions, 45, 46, 47, 48, 49, 50, 41, 51 However, it requires cryogenic temperatures. Obviously, such conditions are totally inappropriate for molecular junctions immersed in solvents. The fact that SERS can be applied at room temperature 2, 3, 4, 6, 7, 52, 9 is an important reason for advocating this method.
The experimental demonstration of the SERS-related effects under full electrochemical control discussed above is still pending, which may be related to certain experimental challenges, which we briefly mention below.
An obvious challenge is the strength of the SERS signal. Valuable insight on the SERS enhancement factor can be gained from 3D-FDTD (three-dimensional finite-difference time-domain) theoretical simulations, as shown in earlier work.2, 8, 52, 9 In the absence of any experimental SERS information on the EC-STM junctions envisaged, a FTDT simulation would be too speculative and will not be attempted below. In view of its well-known critical dependence on the incident light polarization, surface morphology, nanogap configuration and size, an estimate of the SERS intensities can be realistic only if a sufficiently detailed experimental characterization is available. Still, we think that the following pieces of experimental work on related nanosystems can be taken as positive signals that a combined transport-SERS study in EC-STM junctions like those considered in this paper is feasible: the extraordinary enhancement of the Raman scattering from pyridine by shell-isolated gold nanoparticles, 8 the application of in situ shell-isolated nanoparticle SERS (SHINERS)11 under electrochemical condition for an interfacial redox reaction using the same (viologen) molecule as presently considered,52 and the combined SERS and conductance measurements under the same experimental conditions for scanning tunneling microscope break junctions of 44BPY placed in aqueous solution.9 In the last case,9 a Raman enhancement factor of has been obtained. In view of the similarity between the presently considered system and that of ref. 9, we do not expect a dramatic reduction of the SERS intensity preventing observability.
Implementing SERS on single-molecule junctions 4 represented an important advance in molecular electronics. The so-called “fishing mode” STM is the key for Raman signal accumulation. A shift of the Raman signal was observed and related to the stress applied to the molecule. Likewise, IETS (inelastic electron tunneling spectroscopy) studies on single-molecule junctions also indicated some shifts in vibrational modes under stress. So, stress-driven shifts could be a significant noise factor for the - and -dependent Raman signals. However, while this may be an issue in general, and further joint experimental and theoretical studies are needed to clarify it, we believe that stress-driven shifts are less important for the specific case considered in this paper. As noted in the ESI†, the viologen core (44BPY) is not directly contacted to (gold) electrodes in the molecular junctions used in experiment, but rather via alkyl linkers. These linkers mitigate the electrodes’ impact on the 44BPY core. Therefore, we do not expect a substantial impact on the intra-core vibrational modes similar to that caused by the change in the molecular charge considered above. Related to this issue, it is noteworthy that even for the smaller 44BPY molecule (i.e., the molecule without alkyl(+thiol) linkers) vibration frequencies computed with gold atoms attached at the two ends of the molecule and only at one end are almost equal; see Table S1 of ref. 9.
Obviously, neat curves like those presented in Fig. 6 and 8 represent a highly idealized description. In real measurements, one should rather expect blurry curves, similar to those of previous reports. 4, 5, 6, 7, 9 In addition to the (albeit perhaps less pronounced) stress-driven shifts mentioned above, other deleterious effects such as heating 53, 54, 55, 6, 5, 56 and photocurrents 57, 58, 59, 60, 61 are possible sources of noise. But just because such effects were also present in earlier successful SERS-transport studies, there is no special reason to assume that they are so strong to prevent observability in the presently considered case.
6 Conclusion
To conclude, in this paper we have theoretically demonstrated that vibrational frequencies and Raman scattering intensities of a redox molecule embedded in an EC-STM single-molecule junction, like those already fabricated,13 can be efficiently controlled especially by varying the overpotential (“gate” potential). As widely accepted, for SERS observability, the electromagnetic enhancement is decisive although the chemical (charge transfer) enhancement 62 may also play a role.63 The present results indicate that, in addition to these, the charge state may also be significant. The information that can be gathered by SERS goes beyond the chemical identity and valuable structural information of the wired molecule and contacts; the charge state of a molecule can also be probed via SERS. Table S1 shows that differences in Raman intensities of the dicationic and cationic species can be of several orders of magnitude. E.g., reduction yields the Raman activity of mode 23 is enhanced by a factor of 125 while for mode 4 it is diminished by a factor 640. Using other solvents, the Raman activity enhancement can even be much larger (almost ), as illustrated by the results of Table S2 for modes 10 and 14 in benzene. This is an effect much stronger than previously reported in two-terminal setups without solvents.64
Therefore, in spite of nontrivial experimental challenges mentioned above, we are confident that correlating transport data and vibrational information acquired by SERS from current carrying single-molecule junctions under electrochemical control will open new avenues of research that are not accessible for nanotransport in two-terminal setup. Practical molecular electronics and fundamental science can be main beneficiaries.
Acknowledgments
Financial support provided by the Deutsche Forschungsgemeinschaft
(grant BA 1799/2-1) is gratefully acknowledged.
Notes and references
- Le Ru and Etchegoin 2012 E. C. Le Ru and P. G. Etchegoin, Ann. Rev. Phys. Chem., 2012, 63, 65–87.
- Tian et al. 2006 J.-H. Tian, B. Liu, X. Li, Z.-L. Yang, B. Ren, S.-T. Wu, N. Tao and Z.-Q. Tian, J. Am. Chem. Soc., 2006, 128, 14748–14749.
- Tian et al. 2007 J.-H. Tian, B. Liu, S. Jin, K. Dai, Z.-B. Chen, X. Li, H. Ke, S.-T. Wu, Y. Yang, B. Ren, B.-W. Mao, N. Tao and Z.-Q. Tian, IEEE-NANO 2007. 7th IEEE Conference on Nanotechnology, 2007, pp. 1302–1305.
- Ward et al. 2008 D. R. Ward, N. J. Halas, J. W. Ciszek, J. M. Tour, Y. Wu, P. Nordlander and D. Natelson, Nano Lett., 2008, 8, 919–924.
- Ward et al. 2010 D. R. Ward, D. A. Corley, J. M. Tour and D. Natelson, Nat. Nano, 2010, 6, 33–38.
- Ioffe et al. 2008 Z. Ioffe, T. Shamai, A. Ophir, G. Noy, I. Yutsis, K. Kfir, O. Cheshnovsky and Y. Selzer, Nat. Nano, 2008, 3, 727–732.
- Liu et al. 2011 Z. Liu, S.-Y. Ding, Z.-B. Chen, X. Wang, J.-H. Tian, J. R. Anema, X.-S. Zhou, D.-Y. Wu, B.-W. Mao, X. Xu, B. Ren and Z.-Q. Tian, Nat. Commun., 2011, 2, 305.
- Li et al. 2011 J.-F. Li, S.-Y. Ding, Z.-L. Yang, M.-L. Bai, J. R. Anema, X. Wang, A. Wang, D.-Y. Wu, B. Ren, S.-M. Hou, T. Wandlowski and Z.-Q. Tian, J. Am. Chem. Soc., 2011, 133, 15922–15925.
- Konishi et al. 2013 T. Konishi, M. Kiguchi, M. Takase, F. Nagasawa, H. Nabika, K. Ikeda, K. Uosaki, K. Ueno, H. Misawa and K. Murakoshi, J. Am. Chem. Soc., 2013, 135, 1009–1014.
- Mühlschlegel et al. 2005 P. Mühlschlegel, H.-J. Eisler, O. J. F. Martin, B. Hecht and D. W. Pohl, Science, 2005, 308, 1607–1609.
- Li et al. 2010 J. F. Li, Y. F. Huang, Y. Ding, Z. L. Yang, S. B. Li, X. S. Zhou, F. R. Fan, W. Zhang, Z. Y. Zhou, W. Yin, B. Ren, Z. L. Wang and Z. Q. Tian, Nature, 2010, 464, 392–395.
- Li et al. 2014 Y. Li, P. Doak, L. Kronik, J. B. Neaton and D. Natelson, Proc. Nat. Acad. Sci., 2014, 111, 1282–1287.
- Pobelov et al. 2008 I. V. Pobelov, Z. Li and T. Wandlowski, J. Am. Chem. Soc., 2008, 130, 16045– 16054.
- Tao 1996 N. J. Tao, Phys. Rev. Lett., 1996, 76, 4066–4069.
- Alessandrini et al. 2005 A. Alessandrini, M. Salerno, S. Frabboni and P. Facci, Appl. Phys. Lett., 2005, 86, 133902.
- Alessandrini et al. 2006 A. Alessandrini, S. Corni and P. Facci, Phys. Chem. Chem. Phys., 2006, 8, 4383–4397.
- Visoly-Fisher et al. 2006 I. Visoly-Fisher, K. Daie, Y. Terazono, C. Herrero, F. Fungo, L. Otero, E. Durantini, J. J. Silber, L. Sereno, D. Gust, T. A. Moore, A. L. Moore and S. M. Lindsay, Proc. Nat. Acad. Sci., 2006, 103, 8686–8690.
- Zhang et al. 2008 J. Zhang, A. M. Kuznetsov, I. G. Medvedev, Q. Chi, T. Albrecht, P. S. Jensen and J. Ulstrup, Chem. Rev., 2008, 108, 2737–2791.
- Artés et al. 2012 J. M. Artés, M. López-Martínez, A. Giraudet, I. Díez-Pérez, F. Sanz and P. Gorostiza, J. Am. Chem. Soc., 2012, 134, 20218–20221.
- Xu and Tao 2003 B. Xu and N. J. Tao, Science, 2003, 301, 1221–1223.
- Quek et al. 2009 S. Y. Quek, M. Kamenetska, M. L. Steigerwald, H. J. Choi, S. G. Louie, M. S. Hybertsen, J. B. Neaton and L. Venkataraman, Nat. Nano., 2009, 4, 230 – 234.
- Bâldea 2013 I. Bâldea, Nanoscale, 2013, 5, 9222–9230.
- Bâldea 2012 I. Bâldea, Europhys. Lett., 2012, 99, 47002.
- Bâldea et al. 2013 I. Bâldea, H. Köppel and W. Wenzel, Phys. Chem. Chem. Phys., 2013, 15, 1918–1928.
- Bâldea 2013 I. Bâldea, Electrochem. Commun., 2013, 36, 19–21.
- Bâldea 2014 I. Bâldea, J. Phys. Chem. C, 2014, 118, 8676–8684.
- Joo 2004 S.-W. Joo, Vib. Spectrosc, 2004, 34, 269 – 272.
- De Long and Buttry 1992 H. C. De Long and D. A. Buttry, Langmuir, 1992, 8, 2491–2496.
- Sagara et al. 1998 T. Sagara, N. Kaba, M. Komatsu, M. Uchida and N. Nakashima, Electrochimica Acta, 1998, 43, 2183 – 2193.
- Alvarado et al. 2005 R. J. Alvarado, J. Mukherjee, E. J. Pacsial, D. Alexander and F. M. Raymo, J. Phys. Chem. B, 2005, 109, 6164–6173.
- Lahav et al. 2000 M. Lahav, V. Heleg-Shabtai, J. Wasserman, E. Katz, I. Willner, H. Dürr, Y.-Z. Hu and S. H. Bossmann, J. Am. Chem. Soc., 2000, 122, 11480–11487.
- Akiyama et al. 2005 T. Akiyama, K. Inoue, Y. Kuwahara, Y. Niidome, N. Terasaki, S. Nitahara and S. Yamada, Langmuir, 2005, 21, 793–796.
- g 09 M. J. Frisch, G. W. Trucks, H. B. Schlegel, G. E. Scuseria, M. A. Robb, J. R. Cheeseman, G. Scalmani, V. Barone, B. Mennucci, G. A. Petersson, H. Nakatsuji, M. Caricato, X. Li, H. P. Hratchian, A. F. Izmaylov, J. Bloino, G. Zheng, J. L. Sonnenberg, M. Hada, M. Ehara, K. Toyota, R. Fukuda, J. Hasegawa, M. Ishida, T. Nakajima, Y. Honda, O. Kitao, H. Nakai, T. Vreven, J. A. Montgomery, Jr., J. E. Peralta, F. Ogliaro, M. Bearpark, J. J. Heyd, E. Brothers, K. N. Kudin, V. N. Staroverov, T. Keith, R. Kobayashi, J. Normand, K. Raghavachari, A. Rendell, J. C. Burant, S. S. Iyengar, J. Tomasi, M. Cossi, N. Rega, J. M. Millam, M. Klene, J. E. Knox, J. B. Cross, V. Bakken, C. Adamo, J. Jaramillo, R. Gomperts, R. E. Stratmann, O. Yazyev, A. J. Austin, R. Cammi, C. Pomelli, J. W. Ochterski, R. L. Martin, K. Morokuma, V. G. Zakrzewski, G. A. Voth, P. Salvador, J. J. Dannenberg, S. Dapprich, A. D. Daniels, O. Farkas, J. B. Foresman, J. V. Ortiz, J. Cioslowski, and D. J. Fox, Gaussian, Inc., Wallingford CT, 2010 Gaussian 09, Revision B.01.
- Bâldea 2014 I. Bâldea, Faraday Discuss., 2014, ASAP, DOI 10.1039/C4FD00101J.
- Bâldea 2013 I. Bâldea, J. Phys. Chem. C, 2013, 117, 25798–25804.
- Bâldea 2014 I. Bâldea, Nanotechnology, 2014, 25, 455202.
- 37 The Newns-Anderson model, presently employed in this study, is different from the model based on a two-step electron transfer scenario proposed in Ref. 13. As demonstrated recently,35 the value employed in Ref. 13 for the prefactor factor entering the expression of the current needed to quantitatively reproduce the measured currents is much too large; it can by no means be substantiated by parameters specific for the (gold) electodes utilized. In addition, we also note that Fig. 9 of Ref. 13 depicts an unphysical maximum of the current related to the inappropriate analytical formula utlized. This behavior contrasts with the saturation visible in Fig. 4, which agrees with that found is other cases.65, 66, 67.
- 38 Ref. 13 distinguish between redox-mediated enhanced and off-resonance tuneling currents ( and , respectively). Throughout, the presently considered current (denoted by ) represents the current denoted by in ref. 13.
- White et al. 2014 A. J. White, S. Tretiak and M. Galperin, Nano Lett., 2014, 14, 699–703.
- Ould-Moussa et al. 1996 L. Ould-Moussa, O. Poizat, M. Castellà-Ventura, G. Buntinx and E. Kassab, J. Phys. Chem., 1996, 100, 2072–2082.
- Song et al. 2009 H. Song, Y. Kim, Y. H. Jang, H. Jeong, M. A. Reed and T. Lee, Nature, 2009, 462, 1039–1043.
- Stipe et al. 1998 B. C. Stipe, M. A. Rezaei and W. Ho, Science, 1998, 280, 1732–1735.
- Hahn et al. 2000 J. R. Hahn, H. J. Lee and W. Ho, Phys. Rev. Lett., 2000, 85, 1914–1917.
- Ho 2002 W. Ho, J. Chem. Phys., 2002, 117, 11033–11061.
- Smit et al. 2002 R. Smit, Y. Noat, C. Untiedt, N. Land, M. van Hermert and J. van Ruitenbeck, Nature, 2002, 419, 906.
- Kushmerick et al. 2004 J. G. Kushmerick, J. Lazorcik, C. H. Patterson, R. Shashidhar, D. S. Seferos and G. C. Bazan, Nano Lett., 2004, 4, 639–642.
- Wang et al. 2004 W. Wang, T. Lee, I. Kretzschmar and M. A. Reed, Nano Lett., 2004, 4, 643–646.
- Kiguchi et al. 2007 M. Kiguchi, R. Stadler, I. S. Kristensen, D. Djukic and J. M. van Ruitenbeek, Phys. Rev. Lett., 2007, 98, 146802.
- Hihath et al. 2008 J. Hihath, C. R. Arroyo, G. Rubio-Bollinger, N. Tao and N. Agrait, Nano Lett., 2008, 8, 1673–1678.
- Kiguchi et al. 2008 M. Kiguchi, O. Tal, S. Wohlthat, F. Pauly, M. Krieger, D. Djukic, J. C. Cuevas and J. M. van Ruitenbeek, Phys. Rev. Lett., 2008, 101, 046801.
- Kim et al. 2011 Y. Kim, H. Song, F. Strigl, H.-F. Pernau, T. Lee and E. Scheer, Phys. Rev. Lett., 2011, 106, 196804.
- Liu et al. 2011 B. Liu, A. Blaszczyk, M. Mayor and T. Wandlowski, ACS Nano, 2011, 5, 5662–5672.
- Huang et al. 2006 Huang, Xu, Chen, M. D. Ventra and N. Tao, Nano Letters, 2006, 6, 1240–1244.
- Huang et al. 2007 Z. Huang, F. Chen, R. D’agosta, P. A. Bennett, M. Di Ventra and N. Tao, Nat. Nano, 2007, 2, 698–703.
- Galperin et al. 2007 M. Galperin, M. A. Ratner and A. Nitzan, J. Phys.: Condens. Matt., 2007, 19, 103201.
- Härtle et al. 2009 R. Härtle, C. Benesch and M. Thoss, Phys. Rev. Lett., 2009, 102, 146801.
- Guhr et al. 2007 D. C. Guhr, D. Rettinger, J. Boneberg, A. Erbe, P. Leiderer and E. Scheer, Phys. Rev. Lett., 2007, 99, 086801.
- Ward et al. 2008 D. R. Ward, G. D. Scott, Z. K. Keane, N. J. Halas and D. Natelson, J. Phys.: Condens. Matt., 2008, 20, 374118.
- Viljas et al. 2008 J. K. Viljas, F. Pauly and J. C. Cuevas, Phys. Rev. B, 2008, 77, 155119.
- Ittah et al. 2009 N. Ittah, G. Noy, I. Yutsis and Y. Selzer, Nano Lett., 2009, 9, 1615–1620.
- Galperin and Nitzan 2012 M. Galperin and A. Nitzan, Phys. Chem. Chem. Phys., 2012, 14, 9421–9438.
- Lombardi and Birke 2008 J. R. Lombardi and R. L. Birke, J. Phys. Chem. C, 2008, 112, 5605–5617.
- Zhao et al. 2006 L. L. Zhao, L. Jensen and G. C. Schatz, Nano Lett., 2006, 6, 1229–1234.
- Mirjani et al. 2012 F. Mirjani, J. M. Thijssen and M. A. Ratner, J. Phys. Chem. C, 2012, 116, 23120–23129.
- Bâldea and Köppel 2010 I. Bâldea and H. Köppel, Phys. Rev. B, 2010, 81, 193401.
- Bâldea 2010 I. Bâldea, Chem. Phys., 2010, 377, 15 – 20.
- Migliore and Nitzan 2013 A. Migliore and A. Nitzan, J. Am. Chem. Soc., 2013, 135, 9420–9432.