Tunneling chemical exchange reaction in solid HD and D2 at temperatures below 1 K
Abstract
We report on a study of the exchange tunneling reaction D+HDD2+H in a pure solid HD matrix and in a D2 matrix with 0.23 HD admixture at temperatures between 130 mK and 1.5 K. We found that the exchange reaction rates, cm3s-1 in the pure HD matrix, and cm-3 in the D2 matrix are nearly independent of temperature within this range. This confirms quantum tunnelling nature of these reactions, and their ability to proceed at temperatures down to absolute zero. Based on these observations we concluded that exchange tunneling reaction H+HH2+H should also proceed in a H2 matrix at the lowest temperatures. On contrary, the recombination of H atoms in solid H2 and D atoms in solid D2 is substantially suppressed at the lowest temperatures as a result of increasing of violation for resonance tunneling of atoms when they approach each other.
I Introduction
Solid hydrogen and deuterium form a special class of quantum solids, where due to a small mass and weak intermolecular interactions, the effects of quantum tunneling play an important role. Light atomic impurities like H and D stabilized in matrices of the solid hydrogens are able to migrate from one lattice site to another by a repetition of tunneling reactionsKumada (2003):
| (1) |
| (2) |
A clear consequence of this is that a recombination of H and D occurs when two atoms encounter each other in neighboring lattice sites. Tunneling reactions also take place in mixtures and involve both hydrogen isotopes:
| (3) |
| (4) |
A spectacular production of H atoms occurs as D atoms combine with H2 in reaction (3) and HD in reaction (4). Reactions (4) and (3) are well-known in the gas phase at higher temperatures and were intensively studied in H2-D2 solids Gordon et al. (1983); Ivliev et al. (1983); Tsuruta et al. (1983) at temperatures down to 1 K. The difference in the zero-point energies between the products and reactants (about 400 K) results in a preferential creation of H atoms while the reverse reactions are endothermic and do not proceed at low enough temperatures. The rates for the tunneling reactions (3) and (4) were theoretically calculated by Takayanagi et al. Takayanagi and Sato (1990) and Hancock et al. Hancock et al. (1989). The rate of the reaction (4) was measured experimentally in the temperature range 1.9-6.5 K in a series of works by Miyazaki and Kumada Lee et al. (1987); Kumada et al. (1996). Reaction (3) proceeds two orders of magnitude faster andits rate was measured only recently by Kumada Kumada (2006).
The main signatures of a tunneling reaction are weak dependence of
its rate on temperature and a large isotopic effect. For a single
atomic impurity in a perfect crystal tunnelling motion due to the
reactions (1) and 2 may be very
fast because of resonance in the energies of the initial and final
states, since all locations for the atoms in the lattice are equivalent
to each other. Kagan et al. Kagan and Prokof’ev (1992) pointed out
that crystal defects and irregularities violate the condition of resonant
tunneling of H atoms in H2 matrix which affects the rate of
a tunneling reaction. Kumada et al. Kumada et al. (2002) showed that the
ortho-molecules as 2nd and 3rd nearest neighbors significantly decrease
the rate of the atomic hydrogen tunneling reaction in a para-H2
matrix. According to Kagan, tunneling in irregular solids may be stimulated
by phonons, which force tunneling rates to be proportional to
for a single-phonon direct process or to for a two-phonon
Raman process Kagan and Prokof’ev (1992). It was found experimentally
that the recombination rate of H atoms in solid H2 follows a
linear dependence on temperature in the temperature range 1.2-4K Ivliev et al. (1982),
while the rate of the exchange reaction eq. (4)
remained nearly temperature independent within experimental errors
Kumada et al. (1996). Significant divergence from the linear law was observed
for the H recombination rates in solid H2 upon reducing temperature
below 1 K where the H atom recombination decreased by more than two
orders of magnitude for samples cooled down to 150 mK Ahokas et al. (2006, 2010).
Since in solid D2 with a small H2 or HD admixture atomic
impurities need to approach a H2 or HD molecule before taking
part in reactions (3) and (4),
these reactions as well as the recombination of atoms are two stage
processes: 1) diffusion due to tunnelling exchange followed by 2)
the reaction itself. The matrix of pure HD represents a different
case, since the atomic impurities in the lattice are always surrounded
by 12 HD neighbours. The diffusion process is not needed for the reaction
(4) in a solid HD matrix.
In the present work we report on an experimental study of the isotopic
exchange reaction corresponding to eq. (4) in a
HD matrix in a temperature range 0.13-1.5 K. An opposite limit where
D atoms need to diffuse in order to encounter a HD molecule to react
with was studied in a solid mixture of D2:0.23% HD. Our cryogenic
system is based on a dilution refrigerator, which allows continuous
measurements of the reaction kinetics for experiment durations of
the order of weeks and months, substantially longer than in any previous
work. This makes possible measurements of very slow chemical processes
with very small concentrations of reagents, not accessible before.
Our data for the rate of the reaction (4) at T=0.13-1.5 K
in a pure HD matrix agree well with previous works Lee et al. (1987); Kumada et al. (1996)
and confirm a very weak temperature dependence in this range. We found
that the reaction (4) in the D2 matrix is
also temperature independent, which indicates that the non-resonant
diffusion due to the exchange reaction (2) is not
a limiting stage. The rate of the reaction (4)
in the D2 matrix proceeds about 3 times slower than in a pure
HD matrix. At temperature of 150 mK we have not observed any recombination
of D atoms in the D2 matrix, while the exchange reaction (4)
was well visible. Since the recombination also involves the diffusive
process, we anticipate that the atomic motion due to the reaction
(2) is slowed down substantially when the D atoms
approach each other. Based on that hypothesis we concluded that in
the previous work the exchange tunneling chemical reaction H+HH2+H
also takes place in solid molecular hydrogen at 150 mK while the
atomic recombination is suppressed by non-resonant tunnelling when
two H atoms apporoach each otherAhokas et al. (2006).
II Experimental setup
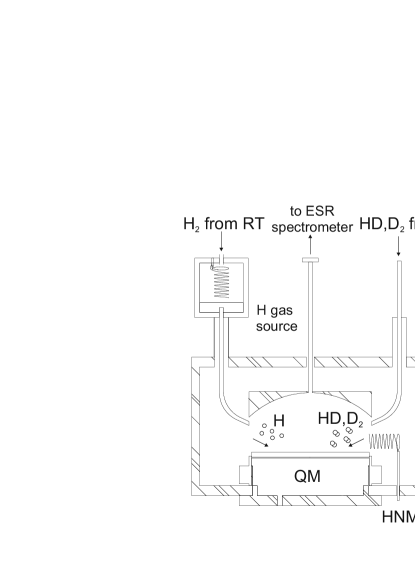
Experiments were carried out in the sample cell (SC) shown in Fig. 1 Sheludiakov et al. (2014a). The SC is located in the center of a 4.6 T superconducting magnet and is cooled by a dilution refrigerator down to about 100 mK. The main diagnostic tools in our experiments are an electron spin resonance (ESR) spectrometer employing a Fabry-Perot resonator operating at 128 GHz frequency Vasilyev et al. (2004) and a quartz microbalance (QM) to measure the sample thickness. ESR enables measurements of H and D concentrations and hyperfine state populations. Absolute atomic concentration calibration is obtained from the dipolar broadening of the ESR spectra Ahokas et al. (2010) or calorimetrically by recording gas phase hydrogen recombination via measuring heat released due to reactions Ahokas et al. (2010); Sheludiakov et al. (2014a). Solid films of hydrogen isotopes were deposited on the flat ESR resonator mirror which also serves as the QM electrode.
The samples were condensed directly from a room temperature reservoir through an electrically heated capillary (Fig.1). The capillary end is directed at the QM which is kept at temperature of 0.5-1 K. The QM makes it possible to measure the thickness of the growing films starting from 0.2 monolayer and to use small deposition rates to decrease overall heating due to the sample preparation. After finishing preparation of a solid film on the surface of the QM, H and D atoms were created by dissociation of HD or D2 molecules in situ in the solid by electrons created by an rf discharge Ahokas et al. (2010). The discharge is obtained by applying pulsed rf power to a helical resonator (HNMR) located close to the QM and operating at . An extra chamber with another RF coil attached to the sample cell from the top was used as atomic hydrogen gas source. Atoms in the gas phase can be stabilized if the sample cell walls are covered by superfluid helium film. Having a possibility of filling the sample cell with the gas of H or D provides good magnetic field markers for the accurate measurement of the shifts of the ESR lines originating from the atoms in solid hydrogen films. Measuring heat released in recombination of gas phase atoms allows independent calibration of the absolute number of spins in a sample. For preparation of our samples we used hydrogen isotopes purchased from Linde AG, D2 gas with 0.23% residual concentration of HD, and HD gas with 3% of H2. In order to obtain the matrix molecules in their ground rotational state, prior to the condensation of the D2 gas into the sample cell we kept it overnight in the para-ortho converter (Silvera, 1980). This ensures high concentration,90%, of ortho-deuterium in our samples.
III Experimental results
The experimental study of the exchange reaction (4) was carried out in two different matrices: a pure HD matrix and a D2 matrix with a 0.23% HD admixture. These two systems allowed us to study two different approaches: the first case, where the D atoms are surrounded by 12 HD molecules, no D-atom diffusion is needed for the reaction to proceed. In the latter case, D atoms need to diffuse a distance of several lattice constants before they will encounter a HD molecule and accomplish the exchange reaction.
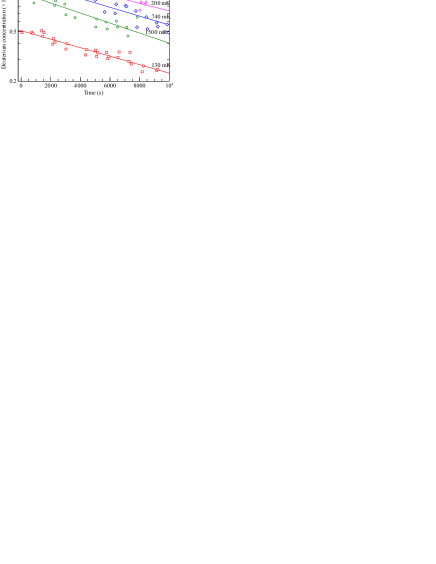
At the beginning of the measurements with the pure HD sample, a 200 nm HD film was deposited onto the quartz microbalance. Then the rf discharge was started in order to begin accumulating H and D atoms in the HD solid. The sample cell temperature was increased to 0.7 K due to the discharge. During accumulation, H and D atom populations were monitored by ESR (Fig. (2)) and when the D concentration saturated, the discharge was turned off. Typically the discharge was run for 5-12 h. The maximum H and D concentrations we achieved were and , respectively. Then the system was set to a desired temperature and the measurements of the D atom decay began. ESR spectrum of atomic D contains three lines separated by 78 G due to hyperfine interactionSheludiakov et al. (2014b). In thermal equilibrium the lines have equal area, and therefore for monitoring the D concentration evolution is sufficient to record only one line. This has been done every ten minutes until the D lines vanished in the noise. After finishing one measurement the process of atom accumulation was repeated. Even after several accumulations we did not observe differences in the sample properties. Moreover exchange reaction rates measured for different HD films were quite reproducible. The D atom decay curves obtained at different temperatures are presented in Fig 3. The rather high temperature during discharge (0.7 K) provided a problem for the lowest temperature measurements because the system required 1-2 h to cool down to TmK during which the D concentration had already decreased considerably.
Absolute concentrations of atoms were determined via the effect of broadening the ESR lines due to dipole-dipole interaction between the atomsAhokas et al. (2010). At the high densities considered in this work this broadening mechanism is substantially stronger than other effects related with the nuclear dipolar moments of the matrix, and provides reliable calibration of the ESR line area versus concentration of atoms. Independent verification of this calibration was performed calorimetrically, measuring the heat released in recombination of H atoms in the gas phase. We evaluate possible systematic error in the concentration measurement as 20%.
The reaction (4) is described by the kinetic equation
| (5) |
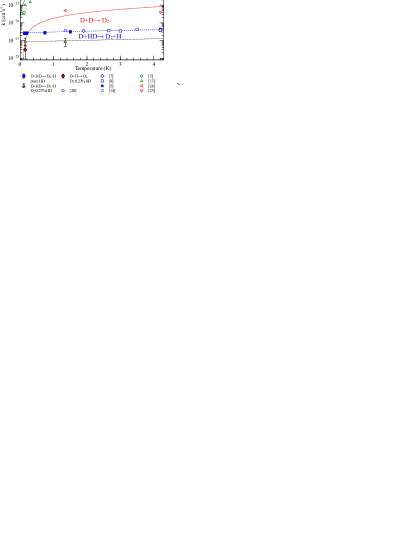
where is the rate constant. Because , can be considered constant and eq. (5) becomes a pseudo first-order reaction. Then slopes of the linear fits of semi-log plot in Fig. 3 give the value of where we used the density of HD molecules equal to Silvera (1980). This measurement is free of errors in the absolute concentration calibration because the first-order reaction rate depends only on the time constant. Possible recombination of atoms is negligibly small since the change of the total concentration was not observed within the accuracy of the measurements. Our results for and values of these rate constants from the literature are presented in Fig.4. Takayanagi et al. carried out theoretical calculations of Takayanagi and Sato (1990). Prior to this work the lowest temperature measurement was done by Kiselev et al. Kiselev et al. (2002) and Bernard et al. Bernard et al. (2005) who studied the reaction (4) in HD-D2 nanoclusters of impurity helium condensates at temperature of 1.35 K. The rates obtained in these works are in a good agreement with our results.
One may expect that electrons and ions resulting from the discharge may also be trapped in our solid samples. Sometimes we observed an extra line in the center of ESR spectrum attributed to the trapped electrons Sheludiakov et al. (2015). Presence of ions was also observed in the studies of HD samples irradiated by and -rays Miyazaki et al. (1995) by Kumada et al. Although such impurities may distort the lattice and severely influence its properties, we do not think that this has any importance in the measurements of the exchange reaction in pure HD, since no any diffusion of reagents is required for the reaction. We have not found differences in the H or D atom properties in samples which exhibit an ESR line at the free electron resonance Sheludiakov et al. (2015).

In a second part of our work we studied the exchange reactions in D2 sample prepared from the pure D2 gas, the most pure commercially available: with an HD admixture of 0.23% () as specified by the manufacturer (Linde AG). It turned out that due to the exchange reaction (4) even this tiny amount of HD results in a rather large concentrations of H atoms in the matrix.
A 200 nm D2 film was condensed directly from the room temperature
reservoir similar to that described before. The measurement was started
after accumulating atoms in the film by running a discharge in the
sample cell for two days and subsequently cooling to T=150 mK
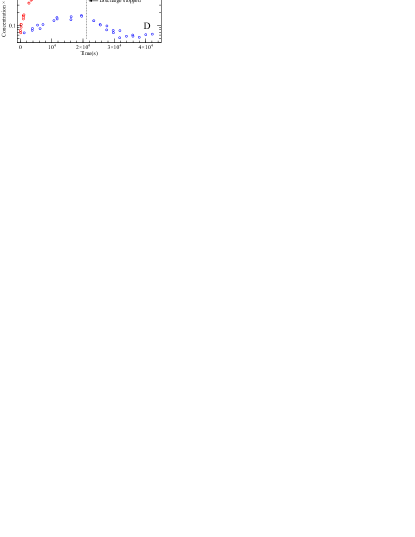
(Fig.5). The concentrations of D and
H atoms approached 2.31019cm-3 and 2.11018cm-3
after 200 h of measurement. The H:D ratio is much greater
than what one should expect from direct dissociation of H and D atoms
during discharge and assuming that no exchange reaction was taking
place. Based on the gas composition the D:H ratio should be about
1700:1. The total H and D atom concentration remained constant in
the course of measurement when discharge was kept off which means
that neither H nor D recombination was taking place.
The concentrations of the reactants D and HD in the D2+0.23%
HD sample were of the same order during the measurement. Therefore,
for determination of the reaction rates we need to solve the equation
(5) assuming true second order process. The solution
can be presented in a form
| (6) |
where [HD]0 and [D]0 are the concentrations at the beginning of measurement while [HD] and [D] are the time dependent concentrations of the reactants during the course of measurement. Concentration of D atoms we determined from the ESR lines area using the absolute density calibration as described above. The values of [HD] were estimated indirectly from the [H] growth as [HD]=[HD]0-[H], assuming that the exchange reaction is the only process leading to the decrease of [HD]. Using experimental data in Fig.5 we determined the effective exchange reaction rate at 150 mK cm3s-1. We repeated the described above measurement of the exchange reaction at temperature of 1.35 K and observed practically same time dependence, as can be seen in Fig. (5). Unfortunately, the long-term stability of our ESR spectrometer degraded at temperatures above 1 K, and was not sufficient for accurate monitoring of the H and D densities. Therefore, in Fig.5 we plotted the fractional ratios of densities [H]/([H]+[D]) and [D]/([H]+[D]), which were not sensitive to the slow drifts of the spectrometer sensitivity and better represent the changes caused by the exchange reactions. Using the 1.35 K data in Fig. 5 we extracted the rate constant cm3s-1 very close to the value obtained at 150 mK. Such behaviour indicates that the exchange reaction proceeded with the same rate having very weak or no temperature dependence. We attempted similar measurements at higher temperatures of 2.5 and 3.5 K. In addition to the conversion of D into H we also observed a decrease of the total density of atoms caused by their recombination. Since the recombination includes several channels including H+H, H+D, and D+D processes, and also because of the increased drifts at higher temperatures, we have not attempted to extract any quantitative data from these measurements. Such work requires optimization of the experimental setup for operation at higher temperatures and may be performed in the future.
IV Discussion
In this work we performed measurements of the hydrogen isotope exchange reactions in the matrices of pure HD and D2. Other well known reactions which occur in these systems are the reactions of recombination of atoms into molecules. These reactions are also of the second order in density. This allows direct comparison of the rates, which we perform in Fig.4 where the rate constants of the exchange reaction (4), the recombination rate constant of H in H2, and D in D2 are presented for the temperature range 0.15-4 K. The plot includes results of the present work as well as a compilation of our previous results and results of other groups. The scarcity of the reactants ([H] in H2 [HD] in pure HD) requires a much longer time to detect the H atom decay although the reaction rate turns out to be greater than that of the exchange reaction (4) (Fig.4).
The measurements in pure HD demonstrate that the exchange reaction takes place at the lowest temperature at the same rate as at 1.5 K without any clear temperature dependence. Such behaviour is expected for tunnelling reaction and means that the chemical reactions of this type may proceed down to absolute zero of temperature. In this case we studied the pure exchange reaction (4), because each D atom is surrounded by 12 HD molecules needed for the reaction, and diffusion stage is not required. The total H and D atom concentration in the HD samples we studied was about 310 which corresponds to the mean distance of 3 nm or 8 lattice constants between them. The H-D or D-D interaction at such distances becomes negligibly small and cannot influence the rate of the exchange reaction (4) Kumada et al. (2002).
In the samples of D2 with small concentration of HD dissociation of atoms by the discharge produces mainly D atoms which on the average are located quite far away from HD impurities. We may neglect production of H and D atoms by the direct dissociation of HD, because its concentration in the matrix is much smaller than D2. Since each D atom has 12 neighbours, the probability that one of the neighbours is HD may be estimated as . However, as we can see from Fig. 5, almost 10% of D atoms were converted to H which provides evidence for D atom diffusion. The complete sequence of the D-to-H conversion in this case includes the diffusion process and the exchange reaction (4) itself. This provides an opposite limit to the described above experiments with pure HD where diffusion is not required at all.
Absence of temperature dependence in our data on the exchange reaction rate in the D2 matrix indicate that the process is not diffusion limited, and the reaction itself is the limiting stage. Then, comparing the absolute values of the rate constant we note that in the HD matrix it is only a factor of 3 larger than in D2. Since the diffusion stage could further slow down the effective rate of the exchange reaction in the D2 matrix, the difference in the tunnelling rates of the reaction may be even smaller. Considering that in hcp lattice of pure HD each D impurity is surrounded by 12 neighbours, one may expect that in D2 matrix the exchange reaction should be at least 12 times slower. We would like to point out also on a substantial difference in the initial and final states of the reactants in these two matrices. For the exchange reaction (4) in pure HD the initial state has a single crystal defect, which can be represented in 1 dimensional case as …HD-HD-D-HD-HD… After the act of the exchange reaction we obtain two defects: …HD-HD-D2-H-HD…, which in total create much larger distortion of the lattice than in the initial state. On the contrary, in the D2 matrix we have initially …D2-D2-D-HD-D2…, which after the exchange is converted to: …D2-D2-H-D2-D2… Now the situation is opposite, two lattice defects are converted into one. Although, the mass is conserved in the exchange reactions, the volume of the lattice distortion is much larger in the case if two neighbouring defects, which may lead to a larger difference in the energies of the initial and final states for the reaction in the HD matrix. We consider this as a possible explanation for the observed difference in the exchange reaction probabilities in HD and D2 matrices.
The recombination of H atoms in H2 solids also includes two stages: approaching of H atoms towards each other by a distance of one lattice constant by a series of tunnelling reactions followed by the formation of a H2 molecule by the recombination reaction with a transfer of recombination energy to the lattice. For spin-polarized atoms in the lattice there appears to be several fast depolarization processes which lead to a flip of the electron spin of one of the atoms and subsequent recombination. It has been shown that the rate of this process does not depend on magnetic field at temperatures above 1.3 K Ivliev et al. (1985), and the diffusion stage is always the limiting stage of the recombination.
Hydrogen migration in a perfect H2 crystal proceeds via resonant tunnelling when the initial and final states of a tunnelling event coincide. The presence of H atoms (or other crystal imperfections) in the lattice causes the mismatch of the initial and final levels which greatly reduces the tunnelling rate. The mismatch increases when H atoms approach each other and finally it prevents them from occupying the neighbouring lattice sites where they are able to recombine. The level mismatch can be overcome by phonon assistance via a single-phonon direct process or a two-phonon Raman process, which lead to a strong temperature dependence of the recombination rate.
Data for the recombination of H atoms in solid H2 summarized in Fig. 4 showed a strong temperature dependence with two distinct ranges: 1.3-4 K where it depends linearly on temperature and below 1 K where the rate constant decreases substantially and become immeasurably small at 150 mKAhokas et al. (2006). Recombination becomes strongly inhibited at the lowest temperatures, about 150 mK where no phonons are available to compensate for the level mismatch. Ahokas et al. showed that H-atom recombination can be initiated at temperatures below 500 mK if phonons are injected into the system Ahokas et al. (2010) as a result of recombination of the gas-phase H atoms on the H2 film surface.
Recombination of atomic deuterium in solid D2 has similar dependence on temperature, and is also diffusion limited. The absolute values of the rate constants are two orders of magnitude smaller, and approaching to 1 K one cannot detect any recombination making its measurement impossible. The upper limit estimate for the D atom recombination constant at 150 mK found from Fig.5 is equal to The value of at T=150 mK is much smaller than that measured at 4.2 K and 1.5 K reported earlier (Fig.4)Khmelenko et al. (2007), Iskovskikh et al. (1986) which gives evidence for a strong temperature dependence of the recombination constant of D atoms below 1.5 K, similar to that observed for H in H2 below 1 KAhokas et al. (2010). Heavier D atoms in a D2 crystal have smaller tunneling probability than for H in H2 and diffuse much slower.
As we see, the diffusion rate of the reactants of the exchange reaction (4) in the D2 matrix is substantially faster than the diffusion of two D atoms approaching each other for recombination. We suggest two possible reasons for that. First, there is a smaller mass difference between a HD molecule and hosting D2 molecules relative to the mass of the host molecule: compared to that of a for D in D2 (and also for H in H2). This implies a smaller perturbation of the periodic potential of the matrix in the former case. Second, it is known that the HD molecules in their ground state may rapidly move in the D2 crystals via tunnelling exchange with ortho-D2Kisvarsanyi and Sullivan (1995). This process may go even faster than the diffusion of D atoms due to the reaction (2). In this case, the energy level mismatch should be overcome as well. As a result, it becomes easier to approach each other for D atom and HD molecule than for two D atoms. The recombination rate of D atoms in a D2 matrix should be slower than the rate of the exchange reaction (4) as observed in the present work.
The exchange reaction (3) is expected to proceed two orders of magnitude faster than the reaction (4) and cannot be measured in a pure H2 matrix with the accumulation technique used in our experiments. Measurements of samples with a small fraction of H2 are diffusion limited and therefore do not represent the true reaction rate Kumada (2006). But such measurements will yield information on the diffusion of D if the reaction (3) remains fast at ultralow temperatures. One should be able to make lower limit estimates of the reaction (3) by comparing the yields of D and H in samples with different mixtures. For H2 fractions above 25% no D lines are expected Khmelenko et al. (2007).
V Conclusions
In conclusion, we have reported on the first experimental observation of the isotopic exchange tunnelling reaction, , taking place in a solid matrix of hydrogen deuteride at temperatures below 1 K. The reaction rate, , was measured within the temperature range 1.5 K - 130 mK where it was found to be nearly temperature independent, cm3s-1. The exchange reaction also takes place at T=150 mK and 1.35 K in a D2 matrix with 0.23% HD admixture where D atoms need to migrate by the distance of several lattice constants in order to participate in the reaction. The reaction rate did not change upon raising temperature from 150 mK to 1.35 K. The fact that the isotopic exchange reaction DHDD2+H proceeds there suggests that the exchange reaction DD2D2D which governs D atom diffusion in a D2 matrix is substantially faster than the exchange reaction . Recombination of D atoms becomes suppressed due to the energy level mismatch appearing when two atoms approach each other. The level mismatch depends on the mass difference between the atomic impurity and the molecule of the host lattice, and is substantially smaller for the case of HD in the D2 matrix.
These observations have a bearing on the rate of the exchange reaction HHH2+H also does not depend on temperature if H and H2 occupy neighboring sites even though the rate of the atomic hydrogen recombination reaction, , is substantially reduced upon lowering temperature below 1 K and it almost completely vanishes at 150 mK. Therefore we anticipate that recombination of H atoms in solid H2 is mainly limited by the diffusion stage, the exchange reaction , which is inhibited in samples with high atomic concentration at low temperatures where the condition of resonant tunneling becomes violated.
The experiments show strong decreasing of recombination rates of H (D) atoms in solid H2 (D2) due to suppression of diffusion of atoms at temperatures below 1 K. New theoretical approaches are needed to understand this phenomenon.
Acknowledgements
We acknowledge the funding from the Wihuri Foundation and the Finnish academy grants No. 258074, 260531 and 268745. This work is also supported by NSF grant No DMR 1209255. S.S. thanks UTUGS for support.
References
- Kumada (2003) T. Kumada, Phys. Rev. B 68, 052301 (2003).
- Gordon et al. (1983) E. B. Gordon, A. A. Pel’menev, O. F. Pugachev, and V. V. Khmelenko, JETP Lett. 37, 282 (1983).
- Ivliev et al. (1983) A. V. Ivliev, A. S. Iskovskikh, A. Y. Katunin, I. I. Lukashevich, V. V. Sklyarevskii, V. V. Suraev, V. V. Filippov, N. I. Filippov, and V. A. Shevtsov, JETP Lett. 38, 379 (1983).
- Tsuruta et al. (1983) H. Tsuruta, T. Miyazaki, K. Fueki, and N. Azuma, J. Phys. Chem. 87, 5422 (1983).
- Takayanagi and Sato (1990) T. Takayanagi and S. Sato, Journal of Chemical Physics 92, 2862 (1990).
- Hancock et al. (1989) G. C. Hancock, C. A. Mead, D. G. Truhlar, and A. J. C. Varandas, Journal of Chemical Physics 91, 3492 (1989).
- Lee et al. (1987) K. P. Lee, T. Miyazaki, K. Fueki, and K. Gotoh, J. Phys. Chem. 91, 180 (1987).
- Kumada et al. (1996) T. Kumada, K. Komaguchi, Y. Aratono, and T. Miyazaki, Chemical Physics Letters 261, 463 (1996).
- Kumada (2006) T. Kumada, The Journal of Chemical Physics 124, 094504 (2006).
- Kagan and Prokof’ev (1992) Y. Kagan and N. V. Prokof’ev, “Quantum tunnelling diffusion in solids,” (North-Holland, Amsterdam, 1992) pp. 37–143.
- Kumada et al. (2002) T. Kumada, M. Sakakibara, T. Nagasaka, H. Fukuta, J. Kumagai, and T. Miyazaki, J. Chem. Phys. 116, 1109 (2002).
- Ivliev et al. (1982) A. V. Ivliev, A. Y. Katunin, I. I. Lukashevich, V. V. Sklyarevskii, V. V. Suraev, V. V. Filippov, N. I. Filippov, and V. A. Shevtsov, JETP Lett. 36, 472 (1982).
- Ahokas et al. (2006) J. Ahokas, J. Järvinen, V. V. Khmelenko, D. M. Lee, and S. Vasiliev, Phys. Rev. Lett. 97, 095301 (2006).
- Ahokas et al. (2010) J. Ahokas, O. Vainio, S. Novotny, J. Järvinen, V. V. Khmelenko, D. M. Lee, and S. Vasiliev, Phys. Rev. B 81, 104516 (2010).
- Sheludiakov et al. (2014a) S. Sheludiakov, J. Ahokas, O. Vainio, J. Järvinen, D. Zvezdov, S. Vasiliev, V. V. Khmelenko, S. Mao, and D. M. Lee, Rev. Sci. Instrum. 85, 053902 (2014a).
- Vasilyev et al. (2004) S. Vasilyev, J. Jarvinen, E. Tjukanoff, A. Kharitonov, and S. Jaakkola, Rev. Sci. Instrum. 75, 94 (2004).
- Silvera (1980) I. F. Silvera, Rev. Mod. Phys. 52, 393 (1980).
- Sheludiakov et al. (2014b) S. Sheludiakov, J. Ahokas, J. Järvinen, D. Zvezdov, O. Vainio, L. Lehtonen, S. Vasiliev, S. Mao, V. V. Khmelenko, and D. M. Lee, Phys. Rev. Lett. 113, 265303 (2014b).
- Kiselev et al. (2002) S. I. Kiselev, V. V. Khmelenko, and D. M. Lee, Phys. Rev. Lett. 89, 175301 (2002).
- Bernard et al. (2005) E. Bernard, R. Boltnev, V. Khmelenko, and D. Lee, Journal of Low Temperature Physics 138, 829 (2005).
- Sheludiakov et al. (2015) S. Sheludiakov, J. Ahokas, J. Järvinen, O. Vainio, L. Lehtonen, D. Zvezdov, V. Khmelenko, D. M. Lee, and S. Vasiliev, Journal of Low Temperature Physics 183, 120 (2015).
- Miyazaki et al. (1995) T. Miyazaki, K. Yamamoto, and Y. Aratono, Chem. Phys. Lett. 232, 229 (1995).
- Ivliev et al. (1985) A. V. Ivliev, A. Y. Katunin, I. I. Lukashevich, V. V. Sklyarevskii, V. V. Suraev, V. V. Filippov, N. I. Filippov, and V. A. Shevtsov, JETP 62, 1268 (1985).
- Khmelenko et al. (2007) V. V. Khmelenko, E. P. Bernard, S. A. Vasiliev, and D. M. Lee, Russian Chemical Reviews 76, 1107 (2007).
- Iskovskikh et al. (1986) A. S. Iskovskikh, A. Y. Katunin, I. I. Lukashevich, V. V. Sklyarevskii, V. V. Suraev, V. V. Filippov, N. I. Filippov, and V. A. Shevtsov, JETP 64, 1085 (1986).
- Kisvarsanyi and Sullivan (1995) E. G. Kisvarsanyi and N. S. Sullivan, Phys. Rev. B 51, 3462 (1995).