Three dimensional solar anisotropy of galactic cosmic rays near the recent solar minimum 23/24
Abstract
Three dimensional (3D) galactic cosmic ray (GCR) anisotropy has been studied for 2006-2012. The GCR anisotropy, both in the ecliptic plane and in polar direction, were obtained based on the neutron monitors (NMs) and Nagoya muon telescopes (MT) data. We analyze two dimensional (2D) GCR anisotropy in the ecliptic plane and north-south anisotropy normal to the ecliptic plane. We reveal quasi-periodicities - the annual and 27-days waves in the GCR anisotropy in 2006-2012. We investigate the relationship of the 27-day variation of the GCR anisotropy in the ecliptic plane and in the polar direction with the parameters of solar activity and solar wind.
1 Introduction
Diurnal variation, being the measure of the galactic cosmic ray (GCR) anisotropy, arises from the Earth’s rotation as a ground-based detector’s viewing direction through the sky during each 24-hours period. Three-dimensional (3D) anisotropy vector is determined by the distribution of the stream of cosmic rays in the 3D heliosphere. An average anisotropy vector has been explained based on the diffusion-convection theory of GCR modulation in the heliosphere [1]-[3]. That is a consequence of the equilibrium established between the radial convection by solar wind and the inward diffusion of GCR particles along the interplanetary magnetic field (IMF) owing to the radial gradient of GCR.
Scientific staff of IZMIRAN’s cosmic ray laboratory
(http://helios.izmiran.troitsk.ru/cosray/main.htm), have calculated the components , , and of the 3D anisotropy by Global Spectrographic Method (GSM) [4]-[6] based on hourly data from all operating neutron monitors (NMs). Unfortunately, the derivation of the component is possible with an accuracy up to constant, and so, a value of the north-south anisotropy obtained by GSM method is not accurate (http://cr20.izmiran.rssi.ru/AnisotropyCR/index.php). That is, sorrowfully, a deficiency of the GSM related to the nature of NMs data.
In general determination of the two dimensional (2D) anisotropy in the ecliptic plane is feasible based on establishing the radial and tangential components by the harmonic analysis method for an individual detector (e.g., NM or Muon Telescope (MT)). Alania et al., [7] demonstrated that the 2D GCR anisotropy calculated by the radial and tangential components determined using GSM basically do not differ from the values of anisotropy found by harmonic analysis method for individual NM with cut-off rigidities GV near the solar minimum epoch.
Swinson [8] first suggested that the north-south anisotropy could be related to the cosmic ray flow caused by a positive heliocentric radial density gradient of cosmic rays and the component of the interplanetary magnetic field (IMF) , as expressed by the vector product, x . Since the average and the lie in the ecliptic plane, the direction of the vector product x (or the north-south anisotropy) is expected to be perpendicular to the ecliptic plane and to reverse direction with changes of the magnetic field direction. It is directed upward when is positive (IMF away from the Sun-) and vice versa when is negative (IMF toward the Sun-).
Papers [9]- [12] studied the cosmic ray anisotropy vector in three dimensions. They have determined north-south anisotropy using data from polar located NMs. They concluded that a magnitude of the north-south anisotropy varies with -years period and there is not any dependence on solar magnetic polarity.
An alternative method to study north-south anisotropy is proposed by Mori and Nagashima [13]. They have introduced an index calculated from Nagoya MT data as:
| (1) |
The terms represent the counting rate differences for telescopes pointing in North, South, and East directions at zenith angle. The index is free of noise in isotropic intensity caused by Forbush decreases, periodic variations, atmospheric temperature effects, and geomagnetic cut-offs. index mainly reflects change of difference between the intensity from north polar direction and that from north and parallel to the equatorial plane directions. Counting rate differences of the north-south and north-equatorial could not be precisely contained the same type of information. In spite, a is accepted by cosmic ray community as a good alternative index to study the north-south (or north-equatorial) asymmetry of the cosmic ray flux e.g., [14].
The present paper investigates the annual and 27-day waves of the GCR anisotropy based on ground observations of secondary cosmic rays by NMs and MTs near the recent solar minimum 2006-2012. We investigate the relationship of the 27-day variation of the GCR anisotropy in the ecliptic plane and in the polar direction with parameters of solar activity and solar wind.
2 Data
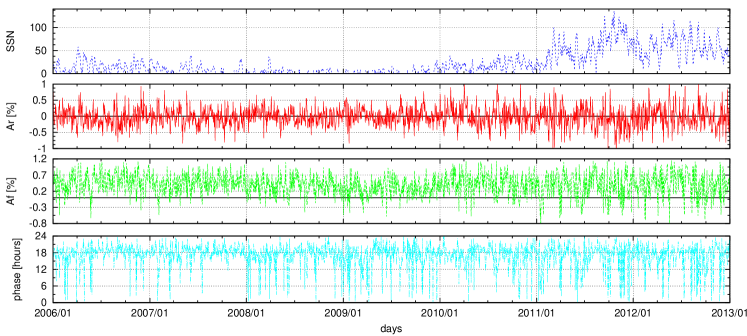
Figure 1 presents the temporal changes of the daily sunspot numbers (SSN), daily radial and tangential components, and phase of the 2D GCR anisotropy obtained by Oulu NM for 2006-2012. Figure 1 shows that components of the daily ecliptic plane GCR anisotropy obtained from hourly data of NM experience large dispersions during the Sun’s rotation period. However, one can recognize that the average daily radial component oscillate near zero, which is caused by a sign dependent drift effect in well established sector structure of the IMF; the tangential component () represents diffusive corotational anisotropy and phase (time of maximum intensity) indicates that GCR stream is directed averagely from .
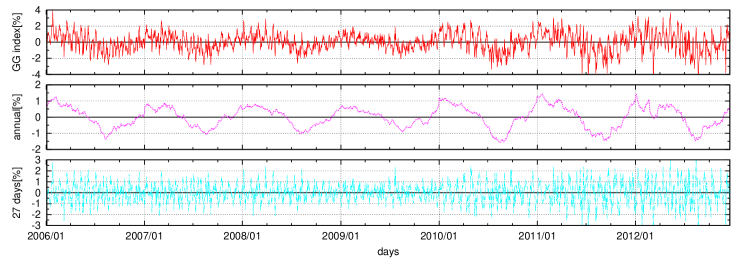
Figure 2 (top panel) presents daily data of the index for 2006-2012. Figure 2 shows that a clear annual trend is seen in changes of the index.
Our aim is to study both annual wave and 27-day variation in index. We reveal annual trend by smoothing daily data over 27 days (Fig. 2 middle panel). Finally for studying the 27-day variation of the index we exclude the annual trend and present detrended daily in the bottom panel of Fig. 2.
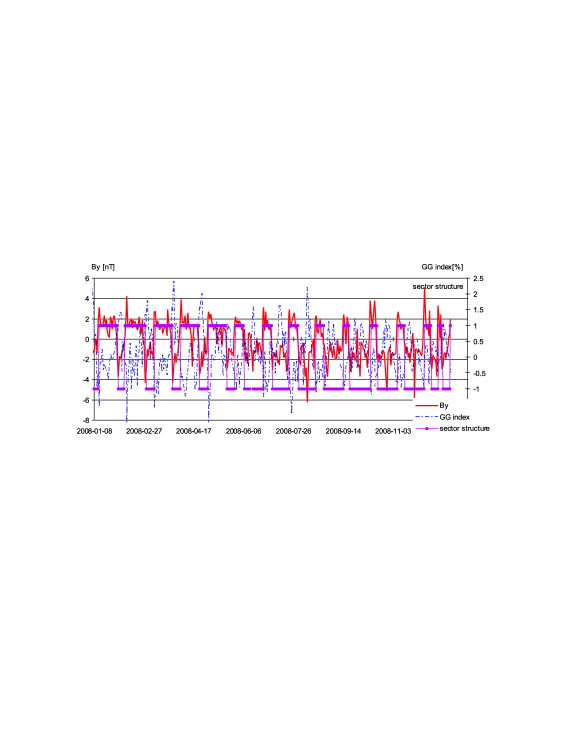
As far the formulation of the north-south anisotropy is based on the drift model, it has been established that there is a good correlation between index and the polarity of the IMF during each solar rotation [13]. Consequently the index being the measure of the north-south asymmetry is inversely related with component of the IMF. It is also well pronounced in the recent solar minimum 23/24. As an example Fig. 3 presents daily index, component and the sector structure of the IMF in 2008.
3 27-day wave in GCR anisotropy near the solar minimum 23/24: 2007-2012
The 27-day variation of the GCR anisotropy has been studied less intensively up to present, in general. It partially is connected with the complexity of the reliable revealing of the 27-day variation of the GCR anisotropy by means of small amplitudes of the diurnal variations of GCR (, measured by NMs), and with a large dispersion of the amplitudes of diurnal variation comparable with the accuracy of hourly data of NMs. In papers Alania et al., [7], [18] studied the 27-day variation of the 2D GCR anisotropy in the ecliptic plane. They demonstrated that the average amplitude in the minimum epoch of solar activity is polarity dependent, as it is expected from the drift theory.
The 27-day variation of the north-south anisotropy was studied in the series of papers by Swinson and coauthors [20]-[22]. They showed that 27-day variation of the north-south anisotropy is correlated with solar activity and this correlation is not clearly dependent upon solar magnetic polarity.
The recent solar minimum provided an unique opportunity to study recurrent variations under relatively stable low solar activity conditions. Recurrent variations connected with corotating structures ( days) are clearly established in all solar wind and interplanetary parameters. Consequently the 27-day recurrent variations of cosmic ray intensity were clearly seen in a variety of cosmic ray counts detected by neutron monitors (e.g., [15], [16]) and space probes (e.g., [17]). Recently, Yeeram et al., [23] studied recurrent ’trains’ (trend) of enhanced GCR anisotropy under influence of corotating solar wind structures near the recent solar minimum.
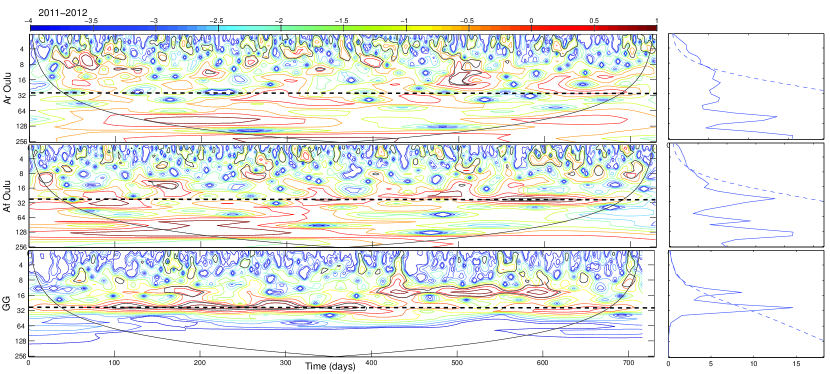
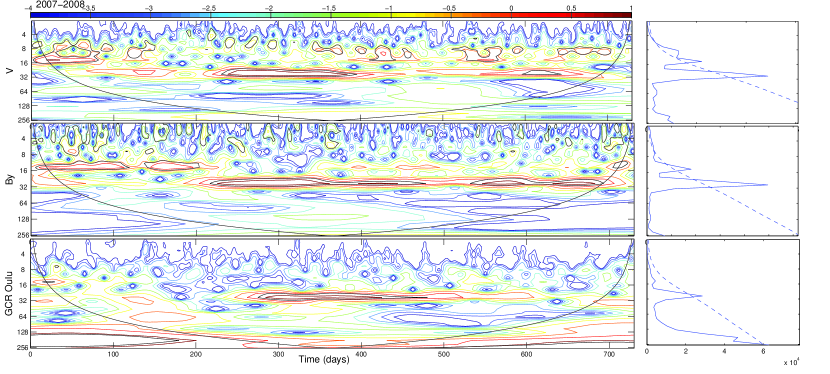
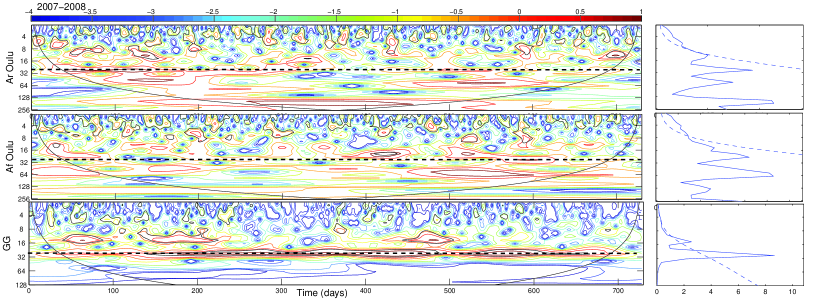
To reveal the quasi-periodic variation of the 2D GCR anisotropy in ecliptic plane and north-south asymmetry of GCR stream by means of index near the recent solar minimum 2007-2012, we employ the wavelet time-frequency spectrum technique developed by Torrence and Compo [24]. The wavelet software is available at the website [http://paos.colorado.edu/research/wavelets/software.html]. In our calculation we used the Morlet wavelet mother function.
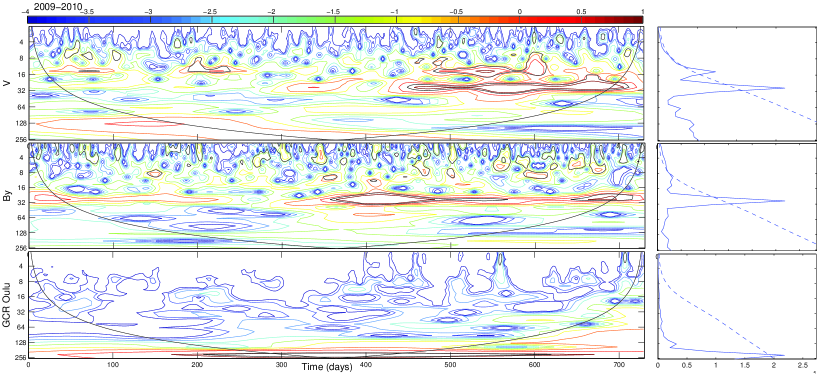
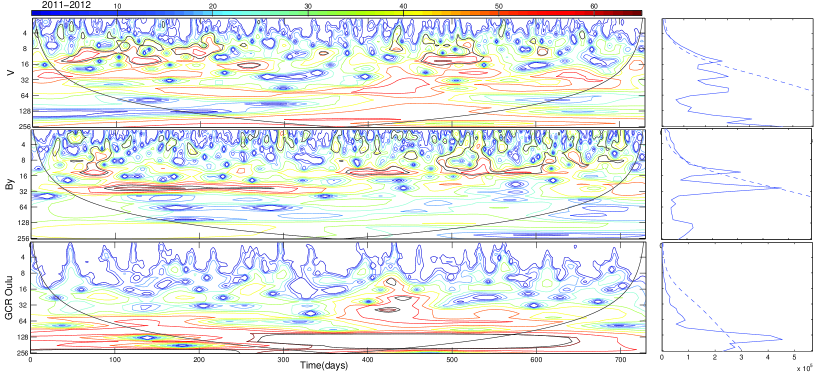
We performed wavelet analysis for the daily solar wind velocity , component of the IMF, GCR intensity for Oulu NM, index, and components of the 2D GCR anisotropy during 2007-2012 considering as a sampling time interval equaling two years (2007-2012). In our case a time interval of two years gives a good enough statistics as far our aim is to reveal recurrences 27-day period, which is from whole sampling period of 26 solar rotations (two years).
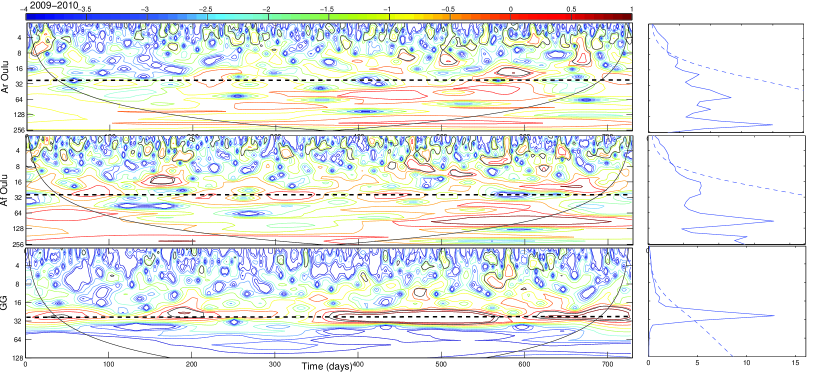
Results of calculation for , and GCR intensity are presented in Fig. 4 for 2007-2008, Fig. 6 for 2009-2010, Fig. 8 for 2011-2012, respectively. Wavelet analysis of and components of the 2D GCR anisotropy for Oulu NM and index are presented in Figs. 5 for 2007-2008, Fig. 7 for 2009-2010, Fig. 9 for 2011-2012, respectively. Figures 5, 7, 9 panel (c) present very clear quasi-periodic changes in index related to the Sun’s rotation ( days) for almost whole time interval 2007-2012. Similar quasi periodic character is clearly visible in and component of the IMF. 27-day variation of GCR intensity is well established at the end of 2007 and in 2008. Although recurrent variations connected with corotating structures ( days) are clearly established in almost all solar wind parameters, 2D GCR anisotropy shows a weak 27-day variation, only in some periods. This is connected with large dispersion of daily and components of the 2D GCR anisotropy.
4 Annual waves in index near the solar minimum 23/24: 2006-2012
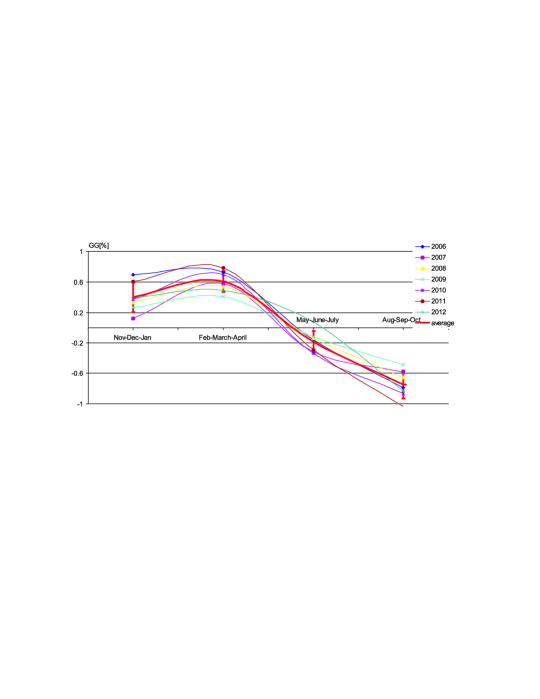
We have also studied a feature of the north-south asymmetry based on the GG index depending on the position of the Earth ( in September and March) during its annual motion around the Sun. For this purpose we calculated 3 month average of the index for each year during 2006-2012. In each year 1st point is the average of November-December-January, 2nd point is the average of February-March-April, 3rd point is the average of May-June-July and 4th point is the average of August-September-October. Results of calculations for superimposed index are presented in Fig. 10. Figure 10 shows that index exhibits clear annual wave with evident maximum phase near the February-March-April period. We suppose that it is an indication of the asymmetry of a heliolatitudinal distribution of solar activity having minimum in south hemisphere near ; being some source of north-south asymmetry of the GCR flux in 2007-2012. Unfortunately, we could not make a precise quantitative estimation due to some uncertainty character of data used in this paper. At the same time, one can suppose that this finding is an indication of an existence of north-south asymmetry of the GCR flux.
5 Conclusions
-
1.
We study recurrent variations of the GCR anisotropy in the ecliptic plane and in the polar direction connected with corotating structures observed in the heliosphere near the recent solar minimum in the period 2007-2012.
-
2.
2D GCR anisotropy generally does not show a clear evidence of the 27-day variation, but in some periods weak recurrent character is visible. This is partially connected with large dispersion of daily and components of the 2D GCR anisotropy.
-
3.
Using wavelet time-frequency method we reveal clear 27-day waves in the index, being the measure of the north-south anisotropy, for almost whole analyzed period 2007-2012. Similar recurrent properties are observed in solar wind velocity and interplanetary magnetic field.
-
4.
We show that index exhibits a clear annual wave with an evident phase of maximum near the February-March-April period. One can suppose that possibly it is an indication of the asymmetry of a heliolatitudinal distribution of solar activity having minimum in south hemisphere near ; this heliolatitudinal asymmetry can be considered as a some source of north-south asymmetry of the GCR flux in 2007-2012.
Acknowledgments
We thank the principal investigators of Oulu neutron monitor and Nagoya muon telescope for the ability to use their data. We acknowledge authors of the wavelet software which is available at URL: http://paos.colorado.edu/research/wavelets/. We would like to thank the reviewers for helpful suggestions.
References
References
- [1] Ahluwalia H S and Dessler A J 1962 Planetary and Space Science 9 195-210
- [2] Krymsky G F 1964 Geomagnetism and Aeronomy 4 763-769
- [3] Parker E N 1964 Planetary and Space Science 12 735-749
- [4] Belov A V Baisultanova L Eroshenko E A et al., 2005 Journal of Geophysical Research 110 A09S20
- [5] Krymski G F Kuzmin A I Chirkov N P et al., 1966 Geomagnetism and Aeronomy 6 991-996
- [6] Krymski G F Kuzmin A I Chirkov N P et al., 1967 Geomagnetism and Aeronomy 7 11-16
- [7] Alania M V Gil A and Modzelewska R 2008 Adv. Space Res. 41 280-286
- [8] Swinson D B 1969 Journal of Geophysical Research 74 5591
- [9] Duggal S P and Pomerantz M A 1977 J. Geophys. Res. 82 2170-2174
- [10] Pomerantz M A Owens A J Tolba M F Tsao C H and Duggal S P 1982 J. Geophys. Res. 87 10325-10330
- [11] Bieber J W and Pomerantz M A Astrophys. J. 303 843-848
- [12] Chen J and Bieber J W Astrophys. J. 405 375-389
- [13] Mori S and Nagashima K 1979 Planetary and Space Science 27 39-46
- [14] Munakata K Kozai M Kato C Kota J Astrophys. J. 791 22, doi:10.1088/0004-637X/791/1/22
- [15] Alania M V Modzelewska R and Wawrzynczak A 2010 Adv. Sp. Res. 45 421-428
- [16] Modzelewska R and Alania M V 2013 Solar Physics 286 593-607
- [17] Leske R A Cummings A C Mewaldt R A and Stone E C 2013 Space Science Reviews 176 253 263
- [18] Alania M V Gil A Iskra K and Modzelewska R 2005 Proceedings of the 29th International Cosmic Ray Conference SH3.4 215-218
- [19] Swinson D B and Yasue S-I 1991 Proceedings of the 22nd International Cosmic Ray Conference SH 481-484
- [20] Swinson D B and Yasue S-I 1992 Journal of Geophysical Research 92 A12 19 149-19 155
- [21] Swinson D B Yasue S and Fujii Z 1993 Proceedings of the 23rd International Cosmic Ray Conference SH 671-674
- [22] Swinson D B and Fujii Z 1995 Proceedings of the 24th International Cosmic Ray Conference SH 576-579
- [23] Yeeram T Ruffolo D Saiz A Kamyan N and Nutaro T 2014 Astrophys. J. 784 136-147
- [24] Torrence C and Compo G P 1998 Bull. Am. Meteorol. Soc. 79 61 78