VLT-FORS2 optical imaging and spectroscopy of 9 luminous type 2 AGN at 0.3z0.6: I. Ionized gas nebulae††thanks: Based on observations carried out at the European Southern Observatory (Paranal, Chile) with FORS2 on VLT-UT1 (programme 087.B-0034)
Abstract
We present optical imaging and long slit spectroscopic observations of 9 luminous type 2 AGNs within the redshift range 0.3z0.6 based on VLT-FORS2 data. Most objects (6/9) are high luminosity Seyfert 2, and three are type 2 quasars (QSO2), with our sample extending to lower luminosity than previous works.
Seven out of nine objects (78%) show morphological evidence for interactions or mergers in the form of disturbed morphologies and/or peculiar features such as tidal tails, amorphous halos, or compact emission line knots. The detection rate of morphological evidence for interaction is consistent with those found during previous studies of QSO2 at similar , suggesting that the merger rate is independent of AGN power at the high end of the AGN luminosity function.
We find the emission line flux spatial profiles are often dominated by the often spatially unresolved central source. In addition, all but one of our sample is associated with much fainter, extended line emission. We find these extended emission line structures have a variety of origins and ionization mechanisms: star forming companions, tidal features, or extended ionized nebulae. AGN related processes dominate the excitation of the nuclear gas. Stellar photoionization sometimes plays a role in extended structures often related to mergers/interactions.
keywords:
1 Introduction
The coevolution and interplay of galaxies with their nuclear black hole is a topic of key importance for understanding galaxy evolution. Negative feedback from an active galactic nucleus (AGN hereinafter) may impact on the evolution of the stellar and gaseous components of the host galaxy, by heating or expelling cold gas that may otherwise have formed stars or fed the AGN, potentially hindering mass assembly activity. Feedback such as this has been invoked to explain the deviation of the observed galaxy stellar mass function from the theoretical function (White & Frenk 1991; Puchwein & Springel 2013), to account the observed correlation between the black hole mass and the stellar mass of the stellar spheroidal component of the host galaxy (Magorrian et al. 1998), and to facilitate the transformation of dusty, obscured galaxies to unobscured, optical galaxies (e.g. Sanders et al. 1988; Bessiere et al. 2014). Although some negative feedback clearly does take place in galaxies as they undergo a phase of AGN activity, the dominant mechanism and strength of this feedback remains a matter of debate in the literature. Positive feedback, where star formation is triggered or enhanced due to AGN-related processes, has also been suggested to take place under some circumstances (Rees 1989; Silk 2013), with a few tentative detections in the literature (Croft et al. 2006; Stroe et al. 2014).
Triggering is another key issue for understanding AGN activity and its relationship with the evolution of the host galaxy. Gas-rich major mergers are thought able to trigger powerful nuclear activity, insofar as they provide a mechanism to displace large quantities of cold gas into the central few kiloparsecs of one (or more) of the merging galaxies (e.g. Heckman et al. 1986), and there is a growing body of evidence to support this idea (e.g. Tadhunter et al. 2011; Ramos Almeida et al. 2011; 2012; Bessiere et al. 2012; 2014).
| Target | Short name | z | log( | SDSS | FIRST | NVSS | Class |
|---|---|---|---|---|---|---|---|
| (g mag) | (mJy) | (mJy) | |||||
| SDSS J090307.83+021152.2 | SDSS J0903+02 | 0.329 | 8.79 | 19.5 | 22.50.1 | 24.20.8 | QSO2 |
| SDSS J092318.06+010144.8 | SDSS J0923+01 | 0.386 | 8.78 | 20.4 | 1.00.2 | 2.30.5 | QSO2 |
| SDSS J095044.69+011127.2 | SDSS J0950+01 | 0.404 | 8.22 | 21.1 | 1.70.1 | HSy2 | |
| SDSS J101403.49+024416.4 | SDSS J1014+02 | 0.573 | 8.29 | 22.6 | 2.40.1 | HSy2 | |
| SDSS J101718.63+033108.2 | SDSS J1017+03 | 0.453 | 8.27 | 21.4 | 2.80.2 | HSy2 | |
| SDSS J124749.79+015212.6 | SDSS J1247+01 | 0.427 | 8.23 | 21.2 | 8.00.1 | 34.11.6 | HSy2 |
| SDSS J133633.65-003936.4 | SDSS J1336-00 | 0.416 | 8.64 | 20.7 | 0.5 | QSO2 | |
| SDSS J141611.77-023117.1 | SDSS J1416-02 | 0.305 | 8.03 | 21.2 | 1.40.1 | HSy2 | |
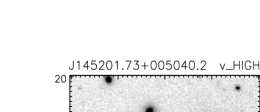
| SDSS J145201.73+005040.2 | SDSS J1452+00 | 0.315 | 7.82 | 21.3 | 0.50.2 | HSy2 |
| Name | z | Night | Obs. | Filter / Grism | PA (∘) | Exp. (s) | Seeing (″)im | Seeing(″)dimm | kpc/″ |
| (1) | (2) | (3) | (4) | (5) | (6) | (7) | (8) | (9) | (10) |
| SDSS J0903+02 | 0.329 | 28 | BB | v_HIGH | 730 | 0.810.03 | 0.880.05 | 4.71 | |
| 28 | NB | H_Alpha/4500+61 | 900 | 0.950.02 | 0.890.05 | ||||
| 28 | LSS | 600RI 1.3 ″ slit | -65.5 (PA1) | 4200 | 1.000.29 | ||||
| 28 | LSS | 600RI 1.3″ slit | 63.4 (PA2) | 1400 | 1.050.22 | ||||
| 28 | LSS | 300I 1.0 ″ slit | -65.5 (PA1) | 2800 | 0.930.24 | ||||
| HST | F814W | 1200 | |||||||
| SDSS J0923+01 | 0.386 | 28 | BB | v_HIGH | 600 | 0.660.06 | 0.790.10 | 5.23 | |
| 28 | LSS | 300I 1.0″ slit | 40.9 | 3578 | 0.850.15 | ||||
| HST | F814W | 1200 | |||||||
| SDSS J0950+01 | 0.404 | 27 | BB | v_HIGH | 600 | 0.960.05 | 1.090.12 | 5.38 | |
| 27 | IB | FILT_530_25 | 900 | 1.050.04 | 1.160.11 | ||||
| 27 | LSS | 600RI 1.3″ slit | 9.9 | 4200 | 1.050.13 | ||||
| SDSS J1014+02 | 0.573 | 26 | BB | v_HIGH | 600 | 0.810.04 | 0.780.07 | 6.52 | |
| 26 | NB | HeI+53 | 900 | 0.640.03 | 0.890.08 | ||||
| 26 | LSS | 600RI 1.0″ slit | -5.9 (PA1) | 2142 | 0.580.07 | ||||
| 26 | LSS | 600RI 1.0″ slit | 42.1 (PA2) | 1400 | 0.760.10 | ||||
| SDSS J1017+03 | 0.453 | 28 | BB | v_HIGH | 600 | 0.740.03 | 0.690.02 | 5.76 | |
| 28 | LSS | 300I 1.0″ slit | 37.7 | 2100 | 0.710.06 | ||||
| SDSS J1247+01 | 0.427 | 25 | BB | v_HIGH | 600 | 1.200.02 | 1.350.08 | 5.56 | |
| 25 | NB | HeI+53 | 900 | 1.240.05 | 1.360.12 | ||||
| 25 | LSS | 600RI 1.3″ slit | 60.7 | 1443 | 1.500.21 | ||||
| SDSS J1336-00 | 0.416 | 26 | BB | v_HIGH | 600 | 0.660.05 | 0.690.07 | 5.47 | |
| 26 | IB | FILT_530_25 | 300 | 0.630.02 | 0.840.07 | ||||
| 26 | LSS | 600RI 1.0″ slit | 57.4 | 2800 | 0.620.07 | ||||
| SDSS J1416-02 | 0.305 | 27 | BB | v_HIGH | 600 | 1.100.05 | 1.010.07 | 4.47 | |
| 27 | IB | FILT_485_37 | 900 | 1.040.04 | 0.950.04 | ||||
| 27 | LS | 600RI 1.3″ slit | 90.0 | 2800 | 0.840.08 | ||||
| SDSS J1452+00 | 0.315 | 28 | BB | v_HIGH | 600 | 0.600.04 | 0.610.03 | 4.56 | |
| 28 | LSS | 300I 1.0″ slit | -64.6 | 2100 | 0.590.05 |
Radio quiet, type 2 quasars are a potential goldmine of information to improve our understanding of several important aspects of the evolution of massive galaxies, including the triggering and impact of AGN activity therein. One of their main advantages is that the fortuitous obscuration by an optically thick structure of the highly luminous central engine, which can otherwise outshine the entire stellar content of the host galaxy, affords a cleaner picture of the galaxy. Moreover, compared to their radio-loud cousins (powerful radio galaxies), the space density of radio-quiet type 2 quasars is roughly an order of magnitude higher (Reyes et al. 2008), making them far more representative of powerful active galaxies. In addition, the absence of powerful radio jets removes substantial ambiguity about whether or not observed properties of the host galaxy are induced by the radio jets, which often impacts studies of radio loud quasars and radio galaxies. However, their lack of powerful radio emission or highly luminous optical emission meant that, even after their existence was hypothesized during efforts to unify the seemingly disparate varieties of active galaxy radio quiet, type 2 quasars remained relatively elusive for decades (see e.g. Halpern et al. 1999).
It was not until the advent of the Sloan Digital Sky Survey (SDSS) that type 2 radio quiet quasars were identified in significant numbers. Using selection criteria designed to find galaxies that contain gas photoionized by a powerful but obscured AGN, Zakamska et al. (2003) were able to identify 300 candidate type 2 quasars within the range 0.3z0.8, of which 85% are radio-quiet (see also Reyes et al. 2008). Subsequent observations at various wavelengths confirmed that these galaxies are indeed type 2 quasars, with unobscured luminosities that places them among the most luminous quasars at similar redshifts (Zakamska et al. 2004, 2006; Ptak et al. 2006; Lal & Ho 2010). Complementary to the above, radio quiet type 2 quasars have now also been found in significant numbers by using data from infrared, X-ray and radio surveys to select heavily obscured AGN (e.g., Ohta et al. 1996; Norman et al. 2002; Martínez-Sansigre et al. 2005; 2006a; 2006b), or by using redshifted ultraviolet emission lines (e.g. Ly) to select type 2 quasars at z2 (Alexandroff et al. 2013). At the time of writing, almost 1000 optically-selected type 2 quasars have now been identified (e.g. Reyes et al. 2008).
The bright optical emission lines that facilitate the identification of type 2 quasars at low to intermediate redshift also carry information about the properties of the gaseous component of the host galaxy. Spatially extended (10 kpc) regions of warm (T10,000 K) ionized gas are frequently detected (e.g. Humphrey et al. 2010; Villar-Martín et al. 2011a, hereafter VM11a; Liu et al. 2013a,b; Harrison et al. 2014; McElroy et al. 2015). In most cases, the excitation of this gas is dominated by photoionization by the hard radiation field of the central AGN, with an occasional contribution from young stars (Villar-Martín et al. 2008) or, in at least one case, a contribution from shock ionization (Humphrey et al. 2010). Many of these quasars show evidence for outflows in their nuclear narrow line region (Villar-Martín et al. 2011b (VM11b hereafter), 2012; Humphrey et al. 2010; Liu et al. 2013b; see also e.g. Arribas et al. 2014). In addition, some intermediate redshift type 2 quasars also contain a large mass of molecular gas, as detected in CO line emission (Villar-Martín et al. 2013a,b; Rodríguez et al. 2014).
The host galaxies of the majority of intermediate redshift type 2 quasars show elliptical morphologies, with around half showing morphological disturbances identifiable with galaxy merger or interaction (Villar-Martín et al. 2012; Bessiere et al. 2012). Although their stellar populations are dominated by old stars, young or post-starburst populations are also prevalent (e.g. Bian 2007; Bessiere et al. 2016, in prep.), suggesting roughly synchronous triggering of the AGN and starburst activity during a merger event, albeit with rather different delays from the starburst to AGN triggering from quasar to quasar (see, e.g., Bessiere et al. 2014). Arguments from environmental clustering amplitudes suggest that all massive elliptical galaxies go through a short-lived phase as a radio-quiet quasar (Ramos Almeida et al. 2013).
In 2008 we started an observational program with the Very Large Telescope (VLT) based on optical imaging and spectroscopy of QSO2, with the goal of investigating, quantifying and characterizing 1) the existence of ionized outflows, 2) the incidence of interactions/mergers and 3) the existence, properties and origin of extended ionized structures in the most powerful radio quiet type 2 active galaxies. In this paper, we extend the work published in four earlier papers (Villar Martín et al. 2010; 2012; VM11a; VM11b), focusing now on a somewhat less luminous sample. Here we concentrate on the optical morphology and merger status of the quasar host galaxies, and the spatial distribution and excitation of narrow-line emitting gas therein. In a future paper (Villar-Martín et al., in prep.; Paper II) we will present a detailed kinematic analysis and discuss the properties of ionized gas outflows.
The paper is organized as follows. The sample is described in Sect. 2. The observations and data reduction are explained in Sect. 3. Analysis and results are presented in Sect. 4 both for the individual objects. The overall results are discussed in Sect. 5 and the conclusions are presented in Sect. 6.
We adopt =71 km s-1 Mpc-1, =0.73 and =0.27. At the redshifts of our sample, this gives an arcsec to kpc conversion ranging from 4.47 kpc/arcsec to 6.52 kpc/arcsec.

2 The Sample
The sample consists of 9 luminous type 2 AGN selected from the SDSS sample of high luminosity type 2 AGN selected by Reyes et al. (2008). They are objects with narrow (2000 km s-1) emission lines without underlying broad components for the recombination lines suggestive of a BLR, and with line ratios characteristic of non-stellar ionizing radiation. Some basic information is presented in Table 1. All objects have redshift z0.3-0.6 such that there was an adequate narrow- or intermediate-band VLT-FORS2 filter containing one of the strongest emission lines in the optical spectrum ([O II]3727 or [O III]5007). The [OIII] luminosities are in the range =log=7.8-8.8 (luminosities taken from Reyes et al. (2008) Vizier online catalogue). We selected our targets to have large emission line equivalent widths.
For completeness, in Table 1 we also give the flux density of each target at 1.4 GHz, as measured by the Faint Images of the Radio Sky at Twenty-Centimeters survey (FIRST: Becker et al. 1995) and, where available, as measured by the NRAO VLA Sky Survey (NVSS: Condon et al. 1998). Issues such as the radio-loudness of the targets will be explored in Paper II.
The sample is similar to that studied by VM11a and VM11b. The main difference is that here we focus on somewhat less luminous objects. Our previous sample had a range of [OIII] luminosities with median value corresponding to =8.84, while the current sample has 8.27. Zakamska et al. (2003) and Reyes et al. (2008) used slightly different criteria to select SDSS QSO2 based on their spectroscopic properties, imposing 8.5 and 8.3 respectively. Although these numbers are only indicative, and there might be a gradual transition of properties with increasing luminosity, we have divided our sample in QSO2 and high luminosity Seyfert 2s (HSy2, hereafter) adopting Reyes et al. (2008) criteria (i.e. a transition value of =8.3). The classification does not change if we use criteria Zakamska et al. (2003) instead. As a result, while the sample of VM11a and VM11b consisted of 12 QSO2 and 2 HSy2, the current sample contains 3 QSO2 and 6 HSy2.
3 Observations and data reduction
3.1 Very Large Telescope observations
The VLT observations were made during the dark nights of 25-28 April 2011 at the Antu unit of the Very Large Telescope, as part of the programme 087.B-0034. The Focal Reducer and Low Dispersion Spectrograph (FORS2: Appenzeller et al. 1998) was used in long-slit spectroscopy and imaging modes. The seeing FWHM varied between 0.6 and 1.1″ during the run (Table 2).
For each quasar the observing procedure involved first obtaining an image through the v_HIGH broad band filter, and in most cases an image through an intermediate or narrow band filter chosen to contain the redshifted [OII] 3727 or [OIII] 5007 lines. Aside from the valuable scientific information they provide, the images were used during the observing run to identify extended structures and possible companion objects, the presence and positions of which motivated our choice of slit position angle during the subsequent long-slit spectroscopic exposures.
The spectroscopic observations used one of two grisms. The 600RI grism gave a useful wavelength range of 5000-8000 Å, and a spectral resolution of 5.20.2 Å (FWHM) when using the 1.0″ slit, or 7.20.2 Å when using the 1.3″ slit. The 300I grism provided a useful range of 6000-10000 Å, and a resolution of 9.60.3 Å with the 1.0″ slit. The spatial pixel scale is 0.25 arcsec pixel-1.The data were processed and calibrated using IRAF to apply standard data reduction techniques (see Villar-Martín et al. 2012 for details).
A total of ten luminous type 2 AGN at 0.3z0.6 were observed during this VLT programme; the results for one of these (SDSS J143027.66-005614.8) have been published in a separate paper (Villar-Martín et al. 2012).
3.1.1 Seeing and slit effects
One of the main objectives of this observational programme is to examine the spatial properties of the narrow emission line gas of our sample (this paper), and to determine whether extended ionized outflows are present (Paper II). For this, a careful characterization of the seeing size (FWHM) and shape and its uncertainties is crucial.
The seeing was very variable during the VLT observations (FWHM in the range 0.6″-1.3″). To account for the uncertainties, we quote in Table 2 the seeing size measured from the broad band and narrow/intermediate band images using several stars in the field (column 8) and the average FWHM seeing conditions calculated over the exposure time as measured by the Differential Image Motion Monitor (DIMM) station (column 9). The dispersion in these values will be carefully taken into account, especially when it could have an impact on our conclusions regarding the spatial extension of a given object.
In addition, we have reconstructed the spatial profile of the seeing disk along the slit, using a non-saturated star in images taken immediately before or after the spectroscopic observation of the science target. Because our study of the spatial extension of the ionized gas will be based primarily on [OIII]5007, whenever possible the narrow or intermediate band image containing this line was used, in order to minimize the effects of the wavelength dependence of the seeing profile. In the absence of either a narrow band or intermediate band image, the broad band image was instead used. In all cases, the selected star was sufficiently bright to detect and trace adequately the faint wings of the seeing profile. The stellar flux was extracted from apertures centered on the stellar centroid and mimicking the slit: 4 (1.0) or 5 pixels (1.3) wide depending on the slit used for the science target’s spectroscopic observation. Finally, the sky background was removed from the stellar spatial profiles.
For some of our science targets, the [OII]3727 line was within the observed spectral range, and should provide some useful information to complement that to be obtained using [OIII], provided the wavelength dependence of the seeing profile is understood and taken into account. To this end, we have used standard star spectra, obtained during the observing run (albeit at different air masses), and studied the star’s seeing point spread function as a function of wavelength. We find that the FWHM of the seeing profile can vary by 9-16% between the observed wavelengths of the [OII] and [OIII] lines. In our science analysis, this will be taken into account when relevant.
The slit width was chosen between 1.0″ and 1.3″ to reach a compromise between optimizing the observing time, obtaining an adequate spectral resolution and avoiding significant flux loses. The slit was often wider than the seeing disk as a consequence (see Table 2). This introduces additional uncertainties for spatially unresolved sources on the kinematic measurements. On one hand, if the objects are clumpy, the image of a spatially unresolved clump will be smaller than the slit width and the instrumental profile at that particular spatial position will be narrower than the profile measured using the sky or arc lines. This would lead to an underestimation of the intrinsic FWHM of the emission lines, which is the result of subtracting the instrumental profile in quadrature. The resulting uncertainties have been carefully taken into account and will be mentioned when relevant.
3.2 Auxiliary data
SDSS J0903+02 and SDSS J0923+01 have also been observed using the Wide Field and Planetary Camera 2 on the Hubble Space Telescope (). These data were retrieved from the Hubble Legacy Archive (HLA). The images were obtained for the HST program with identification 10880 and principal investigator Henrique Schmitt. In both cases the broad band F814W filter was used.
4 Analysis and Results
Figs. 1-10 show our FORS2 images along with the corresponding image where available. Sections of the two-dimensional spectra are also shown to highlight extended nebular features, if detected.
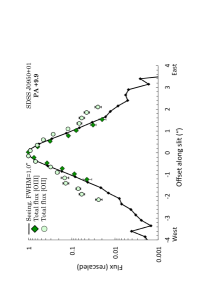
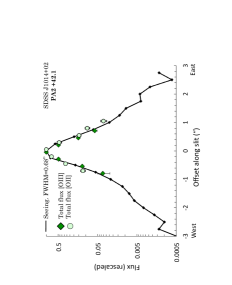
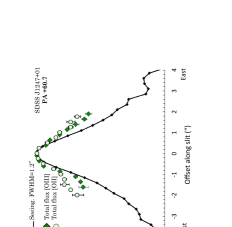
In addition, in Fig. 12 we show emission line spatial profiles (usually [OIII] 5007), with the spatial point spread function during each observation also plotted for comparison. The spatial profiles of the emission lines were derived by extracting a one-dimensional spectrum at each spatial position along the slit, and by then integrating across the entire velocity profile of the emission line, or by fitting one or more Gaussian profiles to the line velocity profile.
Table 3 summarizes the general results of our analysis that will be described in detail below.
4.1 Notes on individual objects
4.1.1 SDSS J0903+02
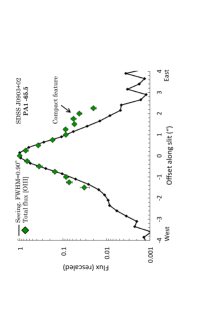
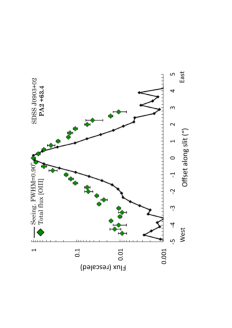
The VLT and broad band images of this QSO2 show a tadpole morphology comprising a spatially asymmetric light profile, with several bright knots along PA110∘ in the central 3″ (14 kpc; Fig. 1). A low surface brightness tail along this same PA extends 16″ (75 kpc) from the position of the quasar. Very faint, diffuse emission is also seen to extend 16″ (75 kpc) to the north east. In addition, a faint tongue also extends 3″ (14 kpc) to the south east. The narrow band image, containing [OIII] 5007 and continuum emission, reveals a morphology that is broadly similar to that seen in the broad band images.
A visual inspection of our spectra reveals spatially extended line emission along both slit position angles (see Fig. 1). This is also obvious in Fig. 12 where the [OIII] spatial profile is shown in comparison with the seeing profile. Along slit PA1=-65.5, the emission is dominated by a spatially unresolved central source. In addition, we detect a compact feature of line emitting gas in H, [NII], [OIII], H and [OII], located 1.8″ (8 kpc) South East from the quasar. Showing line ratios [OIII] 5007 / H 1.50.2 and [NII]6583 /H 0.470.05, this feature falls within the ‘composite’ region defined by Kewley et al. (2001) in the Baldwin, Philips & Televich (1981) (BPT) diagram. Strong underlying continuum is detected possibly associated with this knot (although it extends further out, so this is not certain). The lines are very narrow with FWHM200 km s-1, taking into account possible slit effects (see 3.1.1). Based on the compact morphology (at least along the slit), the apparent spatial detachment from the nuclear region, the narrow lines and the composite line ratios, we argue this is most likely a star forming object within the quasar ionization cone. The lack of spatial information perpendicular to the slit does not allow us to differentiate whether it could be a star forming companion nucleus, a giant star forming region or even a star forming tidal feature, spatially unresolved along the slit.
The lines are extended on both sides of the QSO2 along slit PA2=63.4 (Fig. 1). Very faint (not plotted in this figure due to its weakness) [OIII] reaches a maximum extension of 4.8″ (22 kpc) from the quasar towards the West. The [OIII]5007 / H ratio is 1.80.2, indicating relatively low excitation, but insufficient by itself to discriminate between ionization by stars or the AGN. Because it appears as an extended nebula connected with the QSO, we classify this as an extended emission line region (EELR)111Throughout this paper, we define an EELR as a spatially extended nebula of line emitting gas, which shows a clear, continuous physical connection to the line emitting gas in the galaxy’s nucleus.. It shows narrow lines with FWHM180 km s-1.


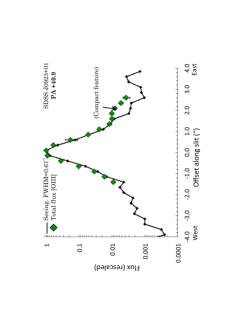
4.1.2 SDSS J0923+01
The broad band morphology of the host galaxy of this QSO2 was described in detail by Bessiere et al. (2012); based on deep Gemini-GMOS broad band optical images, they found a strong morphological disturbance. Our FORS2 optical image shows a galaxy morphology that is elongated along a PA-45∘, with low surface brightness features that resemble tails and broad fans (Fig. 7). In addition, the central few arcsec shows a lopsided flux distribution.
Modeling of the stellar populations in the host galaxy of this QSO2 reveals a large contribution from a young stellar population with an age of between 50 and 100 Myr (Bessiere et al. 2015, in prep.).
The spatial profile of the emission lines along the slit PA=40.9∘ is dominated by a spatially unresolved central component (Fig. 12) with FWHM0.61″, consistent within the errors with the seeing values derived from broad band image (0.660.06″; Table 2). In addition, both [OIII]5007 and H show a faint and compact (along the slit) feature of narrow emission lines (FWHM200 km s-1, taking into account possible slit effects). It is located at 2″ (10 kpc) north east of the AGN, blueshifted by 550 km s-1 (ignoring slit effects) relative to the nuclear emission. Continuum is not detected at the location of the knot. The object is clearly seen in the two-dimensional spectrum (Fig. 1) and also as a faint excess above the seeing profile in Fig. 12.
This knot shows [OIII] 5007 / H 6 and [NII] / H 0.2 ratios that are suggestive of stellar photoionization (e.g., Kewley et al. 2001). The compact appearance along the slit, the narrow lines and the line ratios suggest that this is a star forming object.
Also within the slit is the unrelated irregular galaxy SDSS J092317.57+010136.6 (see Fig. 7) at 11″to the SW. The detected [OIII] 4959,5007 and H lines place it at z0.191.
4.1.3 SDSS J0950+01
This HLSy2 shows a strongly asymmetric light profile in its broad band image (Fig. 2). A low surface brightness tail extends 4″ (22 kpc) North from the quasar, along a similar position angle to that of the high surface brightness regions of the galaxy, and a faint tail (or possibly a poorly resolved companion nucleus) also extends 5″ (27 kpc) southward. The narrow band image, which samples [OII] 3727 and continuum emission, shows similar morphological structure.
[OII] is the only line confirmed to be spatially extended, while the [OIII] profile is consistent with a seeing disk (Fig. 12) of FWHM1.0″. Seeing broadening at decreasing (expected to be 16%, see §3.1.1) cannot explain this difference in the spatial profiles of [OII] and [OIII]. The [OII] spatial profile suggests that the line is emitted by an EELR associated with the HLSy2. The total observed extent is 4.5″ (24 kpc) and maximum extent from the continuum centroid of 2.3″ (12 kpc; Table 3). The line is very narrow in the extended gas, with a total doublet FWHM235 km s-1 and 21545 km s-1 respectively at both sides of the continuum centroid, taking possible slit effects into account.
4.1.4 SDSS J1014+02
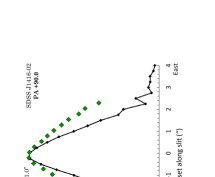
In the broad band image, the host galaxy of this HLSy2 shows a cometary, asymmetrical light profile in its higher surface brightness region, with an arc (or tail) of low surface brightness emission extending North East and then North West, terminating in a knot of emission 3.25″ (21 kpc) North of the galaxy (Fig. 3).
Our spectroscopic data shows that the [OIII] spatial profiles along both position angles are dominated by the central spatially unresolved source. Along PA1=-5.9, this appears somewhat narrower than the seeing derived from the narrow band image (FWHM0.640.03 ″) (Fig. 12). The slightly broader central [OII] spatial profile along PA1 is consistent with seeing broadening at shorter . Along PA2, [OII] appears slightly extended.
In addition, very low surface brightness (too faint to be plotted in Fig. 12), diffuse [OII] is detected along PA2 towards the South-West up to 2.8″or 18 kpc from the continuum centroid. The lines are very narrow in this EELR. The doublet has FWHM140 km s-1 in the EELR – in the most extreme case of maximum possible slit effects, the lines could have at most FWHM=21137 km s-1.
The galaxy 43″ North East from the AGN along PA2 detected in extended [OII] emission with z0.571, confirming its association with the quasar. The galaxies 8″ south and 19″ north along PA1 unrelated star forming galaxies at substantially different redshifts.
4.1.5 SDSS J1017+03
The broad band image of this HLSy2 shows an extended low surface brightness amorphous halo and a compact knot located 3″ (17 kpc) SW of the nucleus (Fig. 4).
The [OIII] 5007 spatial profile is dominated by a central unresolved source (Fig. 12). A faint excess above the seeing profile is detected at 1.2″from the spatial centroid towards the NE. In addition, faint spatially extended emission is detected toward the SW (too faint to be discerned in Fig. 12). It reaches a distance of 3.5″ (20 kpc) from the AGN (Fig. 4) where it seems to connect with the position of the knot seen in the broad band image. This knot also shows line emission. The [OIII] line is very narrow with FWHM140 km s-1 (30930 accounting for the most extreme possible slit effects) along its full extension and it is redshifted by up to 530 km s-1 relative to the [OIII] emission at the position of peak flux. For the [OIII] 5007 / H ratio we obtain a 3 lower limit of 4.
4.1.6 SDSS J1247+01
The broad band image shows several other galaxies within 10″ (56 kpc) of the HLSy2, including a pair of galaxies located 4″ (22 kpc) south west of the HLSy2 (Fig. 6). One member of this galaxy pair fell within the slit, and shows weak [OII] emission and a continuum break consistent with the 4000 Å break at z=0.42, similar to that of the AGN host.
We detect a faint tidal tail extending 2″ west from the western-most of the companion galaxy pair. In addition, after processing the broad band image using the ’smoothed galaxy subtraction’ technique of Ramos Almeida et al. (2011), we detect a tidal tail (or bridge) connecting the HLSy2 to its nearest companion galaxy (see lower panel in Fig. 6). We conclude that this is a triple merger/interacting system.
Our spectroscopic data shows that the [OII] and [OIII] spatial profiles along PA=60.7 are both spatially extended. The [OII] and [OIII] profiles are shown in Fig. 12 together with a seeing profile of FWHM1.2″. Both [OII] and [OIII] show a clear excess above the seeing disk at both sides of the spatial centroid. This is also clear in the 2-dim spectrum (Fig. 6). A visual inspection shows that extended faint [OII] is detected along the slit up to 3″NE from the continuum centroid (17 kpc), with well differentiated kinematics. The lines appear spectrally unresolved with FWHM120 km s-1 (slit effects do not affect this object). For [OIII], the excess is clear towards the east.
This galaxy was detected by the FIRST survey (20 cm / 1.4 GHz) with a flux density of 7.10.1 mJy. In addition to a bright radio core, the FIRST image also shows two diametrically opposed radio lobes with a separation of 70″(400 kpc; Fig. 5). The substantially higher NVSS flux density of 34.11.6 mJy (20 cm / 1.4 GHz) further attests to the presence of large-scale, low surface brightness radio emission (see also Lal & Ho 2010).
The galaxy at 9″to the North East from the AGN has photometric 0.4560.026, according to the SDSS information. This suggests that it could also be associated with the quasar, but spectroscopic z confirmation is needed.
4.1.7 SDSS J1336-00
This apparently isolated galaxy shows an elliptical compact morphology in our broad and intermediate band images (Fig. 8). No spatial structure is apparent, and there are no other bright galaxies visible within a radius of at least 80 kpc. In spite of this unremarkable appearance, the optical spectrum shows strong Balmer absorption lines and a strong Balmer break (Fig. 11), suggesting a burst of star formation occurred 100 Myr ago.


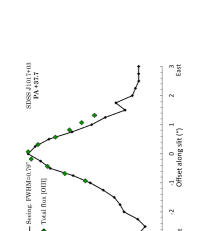
Although several strong nebular emission lines are detected in our spectrum, we find no evidence for any spatial extension along our slit PA. [OII] is not plotted for this object because the strong adjacent stellar features prevent an accurate measurement of the line flux at different spatial locations (Fig. 11), but there is no evidence of spatial extension for this line either. Indeed, the [OIII] emission is rather more centrally-peaked than the 5000-6000 Å continuum emission. It is also narrower (Fig. 12) than the seeing size implied by the images and DIMM values (0.6-0.7″; Table 2).
4.1.8 SDSS J1416-02
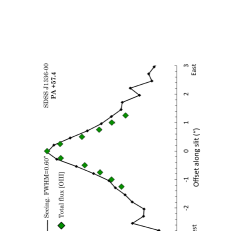
The broad and narrow band images of this HLSy2 show no clear tidal features or possible interacting neighbours (Fig. 9). However, due to its non-uniform surface brightness distribution, with an elongation towards the north west, we consider it plausible that this is a post-interacting system.
The long slit spectrum shows spatially extended emission lines emitted by an EELR (Fig. 9 and (Fig. 12), with the strongest line [OIII] 5007 having a total extent of 6″ (27 kpc) and maximum extension from the continuum centroid of 3.25″or 14.5 kpc. The spatial peaks of the emission lines have a small but significant offset of 0.3″ (1.3 kpc) East of the continuum peak. Across the observed spatial extent of the nebulosity, the [OIII] 5007 / H flux ratio is within the range 5-10. The detection of the HeII4686 line on the Western side of the EELR confirms that the nebula is photoionized by the AGN.
The lines are very narrow in the EELR. [OIII] is unresolved on the West side of the nebula, with FWHM200 km s-1), while FWHM250 km s-1 on the East side, taking slit effects into account.
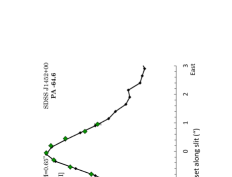
4.1.9 SDSS J1452+00
The broad band image of this HSy2 reveals an arm or tail of faint emission extending out to 4″ (18 kpc) North West (Fig. 10). The association of this extended source is confirmed by its detection in [OIII] emission at a similar redshift to the HSy2.
The [OIII] spatial profile (Fig. 12) is dominated by a compact unresolved (FWHM0.6″) source. In addition, very faint [OIII] extended emission (undetected in the figure) is detected up to 3.5″or 16 kpc from the continuum centroid (see 2-dim spectrum in Fig. 10). This emission overlaps with the tidal feature discussed above. The detection of relatively strong continuum suggests that it is forming stars. Unfortunately, the spectrum of this region is noisy and the line FWHM and ratios cannot be constrained in a useful way.
| Galaxy | Feature | Spectrum | Max. Ext. or Dist. | Max. Ext. or Dist. | Interactions |
| (arcsec) | (kpc) | ||||
| (1) | (2) | (3) | (4) | (5) | (6) |
| SDSS J0903+02 PA2 +63.4 | EELR | ? | 4.8 | 22 | Yes |
| PA1 -65.5 | SF compact object | Composite | 1.8 | 8 | |
| SDSS J0923+01 PA-40.9 | SF compact object | SF | 2 | 10 | Yes |
| SDSS J0950+01 PA-9.9 | EELR | ? | 2.3 | 12 | Yes |
| SDSS J1014+02 PA -42.1 | EELR | ? | 2.8 | 18 | Yes |
| SDSS J1017+03 PA-37.7 | EELR | ? | 3.0 | 17 | Yes |
| PA -37.7 | Compact object | ? | 3.5 | 20 | |
| SDSS J1247+01 PA-60.7 | EELR | ? | 3 | 17 | Yes |
| SDSS J1336+00 PA-57.4 | No | – | – | – | No |
| SDSS J1416-02 PA90 | EELR | AGN | 3.25 | 14.5 | Maybe |
| SDSS J1452+00 PA64.6 | Tidal tail? | ? | 3.5 | 16 | Yes |
5 Overall Results and Discussion
We have presented optical imaging and long slit spectroscopic observations of 9 luminous type 2 AGNs within the redshift range 0.3z0.6. Most (6/9) are high luminosity Seyfert 2 (HSy2) and three are type 2 quasars (QSO2). This work expands a similar study by VM11a towards somewhat less luminous AGN. Thus far we have described the results on an object-by-object basis. Here, we discuss the overall results of this study.
5.1 Morphological signatures of mergers and interactions
The host galaxies of our sample show a variety of optical morphologies, ranging from heavily disturbed morphologies suggestive of a recent or ongoing major merger, to morphologically regular and unremarkable systems.
7 out of 9 objects (78%) show strong morphological evidence for interactions or mergers in the form of disturbed morphologies and/or peculiar features such as tidal features, amorphous halos, compact emission line knots (see Table 3). The two remaining objects – SDSS J1336-00 (a QSO2) and SDSS J1416-02 (a HLSy2) – appear as isolated galaxies and have no unequivocal signs of mergers/interactions at the depth of our images. However, SDSS J1416-02 is associated with extended low surface brightness continuum emission, with a lopsided flux distribution that could be interpreted as a post-merger system (among other possible interpretations).
In comparison, the detection rate of interactions/mergers found by VM11a was 5/13 objects (38%). However, their fraction is a conservative lower limit (stated by the authors), because they had only shallow continuum images, and no narrow band emission line images.
Indeed, our detection rate of interaction signatures is equal to that found by Bessiere et al. (2012) in a complete sample of 20 SDSS selected QSO2 at 30.41 (see also Villar Martín et al. (2012)) and also similar to that found for a control sample of quiescent (i.e. non active) early type galaxies of similar mass. Bessiere et al. (2012) found a significant difference in surface brightness for the interaction features (2 magnitudes brighter for the QSO2). They propose that the mergers witnessed in the comparison sample galaxies could have different progenitors, or that the interactions might be viewed at different stages.
5.2 Extranuclear line emission
Our analysis shows that the spatial distribution of the emission lines is in general dominated by a compact spatially unresolved (i.e. consistent with the seeing disk) central source which emits very strong emission lines associated with the narrow line region. In addition, extranuclear line emission of much lower surface brightness is often detected due to structures of diverse nature: tidal tails, star forming nuclei/knots/companions and extended ionized nebulae. The main results are summarized in Table 3. Specifically, we have detected extranuclear line emission for 8 out of 9 of our sample. The only exception is SDSS J1336+00, which, on the other hand, is an isolated galaxy with no obvious signs of mergers/interactions. The non detection of extranuclear line emission might be due to a real absence of such emission. However, unlike for other objects, given the absence of peculiar/interesting features in the optical images the slit PA was chosen blindly so that extended lines along other PA might have been missed.
Our previous studies (VM11a and Villar Martín et al. 2012) revealed extended emission lines associated with 7/15 QSO2 at similar although this is a gross lower limit, given that the slit was placed blindly for several objects with no obvious peculiar morphological features. On the other hand, we have shown here that [OII]3727 is often more extended (e.g. SDSS J0950+01, SDSS J1014+02, SDSS J1247+01) than [OIII]. Our previous results were based on the analysis of the [OIII] line only. The relatively higher [OII]/[OIII] in the extended gas suggests that the extranuclear ionized gas has lower ionization level than the nuclear ionized gas. Moreover, while the gas in the central, often spatially unresolved region is preferentially photoionized by the active nucleus, the extranuclear gas is often at least partially photoionized by stars (see also McElroy et al. 2015). Both facts favor an easier detection of extranuclear line emission using low ionization lines such as [OII] compared with [OIII].
Integral field spectroscopic works show that extended line emission is common in QSO2 at this , although these authors studied objects with very high [OIII] luminosities (Liu et al. 2013a).
Extranuclear emission line features other than EELR (companion nuclei, knots, tidal tails) are often identified (4/9 in our current sample or 10/24 in the total sample including our prior studies). Thus, in 50% of the objects emission line structures whose nature is linked with mergers/interactions are detected.
EELR (which we differentiate from knots, tails, companion nuclei) are detected for 6/9 objects. The maximum extension from the AGN is in the range 12-22 kpc, with mean (and median) values of 17 kpc. Liu et al. (2013a) detected extranuclear ionized nebulae via [OIII]5007 Å emission in most of the QSO2 they studied in a sample of 11 radio quiet QSO2 at similar to our sample. They measured radii of the ionized gas nebulae ranging from =7.5 to =20 kpc, as seen from the 5 detection values. Their mean value is 14 kpc.
Thus, as shown by our previous studies, luminous type 2 AGN are associated with extranuclear emission line regions, which are often a complex mixture of tidal/interaction/companion features and EELR, with a mixture of excitation mechanisms (AGN related processes and stellar photoionization) whose relative contribution varies spatially (see also McElroy et al. 2015). These regions therefore cannot be interpreted as a single gaseous structure where the morphology, kinematics and excitation are determined by a single mechanism.
5.3 Ongoing star formation
VM11a found evidence for recent star formation in the neighbourhood of 5/14 objects. All show signs of mergers/interactions. The star formation is happening in general in companion galaxies, knots, and/or nuclei. Definite (i.e., confirmed by the emission line spectrum) evidence for recent star formation is confirmed in two objects of the sample investigated here: SDSS 0903+02 and SDSS J0923+01, both with associated compact star forming knots, and possibly also SDSS 1017+03. All three also show evidence of interactions. These fractions are lower limits, given the obviously limited spatial coverage and the lack of sufficient line ratio information for diagnostics of the ionizing mechanisms. It is clear that at least part of the extended SF occurring in luminous type 2 AGN is triggered by mergers/interactions. A more complete study in two spatial dimensions would probably reveal recent star formation at least in some objects (e.g. disk galaxies) not necessarily related to this type of processes (e.g. McElroy et al. 2015). To ascertain the presence of a young stellar population in the nuclear regions it would be necessary to fit the optical nuclear spectrum with spectral synthesis modeling techniques (e.g. Tadhunter et al. 2011); Bessiere et al. 2016, in prep.).
6 Conclusions
We have presented optical imaging and long slit spectroscopic observations of 9 luminous type 2 AGNs within the redshift range 0.3z0.6 based on VLT-FORS2 data. Six out of the nine objects are high luminosity Seyfert 2 (log() and three are QSO2 (log(). This is an extension of the work presented in Villar Martín et al. (2011a,b), who studied mostly QSO2, and we have thus enlarged the sample towards somewhat less luminous type 2 AGN.
-
•
Signatures of mergers/interaction. 7 out of 9 objects (78%) show clear morphological evidence for interactions or mergers in the form of disturbed morphologies and/or peculiar features such as tidal tails, amorphous halos, compact emission line knots, etc. This rate of interaction is consistent with other relevant studies of (more luminous) QSO2 at similar , suggesting the merger rate is independent of the AGN luminosity at the high end of the AGN luminosity function (QSO2 and HLSy2).
-
•
Extended line emission. The emission line spatial profiles are dominated by a bright compact, usually spatially unresolved central source. In addition, much fainter, extranuclear emission line features are detected associated with 8/9 objects. They are of a diverse nature: EELR (6/9 objects) of typical radial sizes 12-22 kpc (consistent with related works focused on more luminous objects) as well as features related to mergers/interactions such as star forming compact knots and tidal tails (4/9). There is a mixture of excitation mechanisms (AGN related processes and stellar photoionization) whose relative contribution varies spatially. While the emission line spectrum of the ionized gas near the central engine (few kpc) is clearly excited by AGN related processes, stellar photoionization can also be present in the extranuclear ionized gaseous structures. Moreover, we have found evidence, based on the [OII]/[OIII] line flux ratio, that the extranuclear ionized gas is often in a lower ionization state than the nuclear ionized gas. In addition, the [OII] emission is often more spatially extended than [OIII], suggesting that low ionization lines (such as [OII]) might be relatively more efficient than [OIII] for detecting extranuclear and extended emissionn line structures in QSO2.
Acknowledgments
We thank the staff at Paranal Observatory for their support during the observations. AH acknowledges Fundação para a Ciência e a Tecnologia (FCT) support through UID/FIS/04434/2013, and through project FCOMP-01-0124-FEDER-029170 (Reference FCT PTDC/FIS-AST/3214/2012) funded by FCT-MEC (PIDDAC) and FEDER (COMPETE), in addition to FP7 project PIRSES-GA-2013-612701. AH also acknowledges a Marie Curie Fellowship co-funded by the FP7 and the FCT (DFRH/WIIA/57/2011) and FP7 / FCT Complementary Support grant SFRH/BI/52155/2013. MVM and SA acknowledge support from the Spanish Ministerio de Economía y Competitividad through the the grants AYA2012-32295 and AYA-2012-39408-C02-01. CRA is supported by a Marie Curie Intra European Fellowship within the 7th European Community Framework Programme (PIEF-GA-2012-327934). RGD acknowledges support through the grant AYA2010-15081.
References
- Alexandroff et al. (2013) Alexandroff R., et al., 2013, MNRAS, 435, 3306
- Arribas et al. (2014) Arribas S., Colina L., Bellocchi E., Maiolino R., Villar-Martín M., 2014, A&A, 568, A14
- Appenzeller et al. (1998) Appenzeller I. et al., 1998, The Messenger, 94, 1
- Baldwin, Philips & Televich (1981) Baldwin J., Philips M., Televich R., 1981, PASP, 93, 5
- Becker, White, & Helfand (1995) Becker R. H., White R. L., Helfand D. J., 1995, ApJ, 450, 559
- Bessiere et al. (2012) Bessiere P. S., Tadhunter C. N., Ramos Almeida C., Villar Martin M., 2012, MNRAS, 426, 276
- Bessiere et al. (2014) Bessiere P. S., Tadhunter C. N., Ramos Almeida C., Villar Martín M., 2014, MNRAS, 438, 1839 Bian W.H., 2007, in ”The Central Engine of Active Galactic Nuclei” ASP Conference Series, Ed. Ho & Wang, Vol. 373, page 675
- Condon et al. (1998) Condon J. J., Cotton W. D., Greisen E. W., Yin Q. F., Perley R. A., Taylor G. B., Broderick J. J., 1998, AJ, 115, 1693
- Hainline et al. (2014) Hainline K. N., Hickox R. C., Greene J. E., Myers A. D., Zakamska N. L., Liu G., Liu X., 2014, ApJ, 787, 65
- Halpern, Turner, & George (1999) Halpern J. P., Turner T. J., George I. M., 1999, MNRAS, 307, L47
- Harrison et al. (2014) Harrison C. M., Alexander D. M., Mullaney J. R., Swinbank A. M., 2014, MNRAS, 441, 3306
- Heckman et al. (1986) Heckman T. M., Smith E. P., Baum S. A., van Breugel W. J. M., Miley G. K., Illingworth G. D., Bothun G. D., Balick B., 1986, ApJ, 311, 526
- Humphrey et al. (2010) Humphrey A., Villar-Martín M., Sánchez S. F., Martínez-Sansigre A., Delgado R. G., Pérez E., Tadhunter C., Pérez-Torres M. A., 2010, MNRAS, 408, L1
- Kewley et al. (2001) Kewley L., Dopita M., Sutherland R., Heisler C. Trevena J., 2001, AJ, 556, 121
- Lal & Ho (2010) Lal D. V., Ho L. C., 2010, AJ, 139, 1089
- Liu et al. (2013a) Liu G., Zakamska N. L.,Greene J. E., Nesvadba N., Liu X., 2013a, MNRAS, 430, 2327
- Liu et al. (2013b) Liu G., Zakamska N. L.,Greene J. E., Nesvadba N., Liu X., 2013b, MNRAS, 436, 2576
- Magorrian et al. (1998) Magorrian J., et al., 1998, AJ, 115, 2285
- Martínez-Sansigre et al. (2005) Martínez-Sansigre A., Rawlings S., Lacy M., Fadda D., Marleau F. R., Simpson C., Willott C. J., Jarvis M. J., 2005, Natur, 436, 666
- Martínez-Sansigre et al. (2006) Martínez-Sansigre A., Rawlings S., Lacy M., Fadda D., Jarvis M. J., Marleau F. R., Simpson C., Willott C. J., 2006a, MNRAS, 370, 1479
- Martínez-Sansigre et al. (2006) Martínez-Sansigre A., Rawlings S., Garn T., Green D. A., Alexander P., Klöckner H.-R., Riley J. M., 2006b, MNRAS, 373, L80
- McElroy et al. (2015) McElroy R., Croom S., Pracy M., Sharp R., Ho, I.T., Medling A., 2015, MNRAS, 446. 2186
- Norman et al. (2002) Norman C., et al., 2002, ApJ, 571, 218
- Ohta et al. (1996) Ohta K., Yamada T., Nakanishi K., Ogasaka Y., Kii T., Hayashida K., 1996, ApJ, 458, L57
- Ptak et al. (2006) Ptak A., Zakamska N. L., Strauss M. A., Krolik J. H., Heckman T. M., Schneider D. P., Brinkmann J., 2006, ApJ, 637, 147
- Puchwein & Springel (2013) Puchwein E., Springel V., 2013, MNRAS, 428, 2966
- Ramos Almeida et al. (2011) Ramos Almeida C., Tadhunter C. N., Inskip K. J., Morganti R., Holt J., Dicken D., 2011, MNRAS, 410, 1550
- Ramos Almeida et al. (2012) Ramos Almeida C., et al., 2012, MNRAS, 419, 687
- Ramos Almeida et al. (2013) Ramos Almeida C., Bessiere P. S., Tadhunter C. N., Inskip K. J., Morganti R., Dicken D., González-Serrano J. I., Holt J., 2013, MNRAS, 436, 997
- Rees (1989) Rees M. J., 1989, MNRAS, 239, 1P
- Reyes et al. (2008) Reyes R., Zakamska N., Strauss M. et al. 2008, AJ, 136, 2373
- Rodríguez et al. (2014) Rodríguez M. I., Villar-Martín M., Emonts B., Humphrey A., Drouart G., García Burillo S., Pérez Torres M., 2014, A&A, 565, A19
- Sanders et al. (1988) Sanders D. B., Soifer B. T., Elias J. H., Madore B. F., Matthews K., Neugebauer G., Scoville N. Z., 1988, ApJ, 325, 74
- Silk (2013) Silk J., 2013, ApJ, 772, 112
- Stroe et al. (2014) Stroe A., Sobral D., Röttgering H. J. A., van Weeren R. J., 2014, MNRAS, 438, 1377
- Tadhunter et al. (2011) Tadhunter C., et al., 2011, MNRAS, 412, 960
- Villar-Martín et al. (2008) Villar-Martín M., Humphrey A., Martínez-Sansigre A., Pérez-Torres M., Binette L., Zhang X. G., 2008, MNRAS, 390, 218
- Villar-Martín et al. (2010) Villar-Martín M., Tadhunter C., Pérez E., Humphrey A., Martínez-Sansigre A., Delgado R. G., Pérez-Torres M., 2010, MNRAS, 407, L6
- (39) Villar-Martín M., Tadhunter C., Humphrey A., Fraga Encina R., González Delgado R., Pérez Torres M., Martínez-Sansigre A., 2011a, MNRAS, 416, 262 (VM11a)
- (40) Villar-Martín M., Humphrey A., González Delgado R., Colina L., Arribas S., 2011b, MNRAS, 418, 2032 (VM11b)
- Villar Martín et al. (2012) Villar-Martín M., Cabrera Lavers A., Bessiere P., Tadhunter C., Rose M., de Breuck C., 2012, MNRAS, 423, 80
- Villar-Martín et al. (2013) Villar-Martín M., Emonts B., Rodríguez M., Torres M. P., Drouart G., 2013a, MNRAS, 432, 2104
- Villar-Martín et al. (2013) Villar-Martín M., et al., 2013b, MNRAS, 434, 978
- Villar Martín et al. (2014) Villar Martín M., Emonts B., Humphrey A., Cabrera Lavers A., Binette L., 2014, MNRAS, 440, 3202
- Villar Martín et al. (2015) Villar Martín M., Bellocchi E., Stern J., Tadhunter C., González Delgado R., 2015, MNRAS, in press. arXiv:1509.01056
- White & Frenk (1991) White S. D. M., Frenk C. S., 1991, ApJ, 379, 52
- Zakamska et al. (2003) Zakamska N. L. et al. 2003, AJ, 126, 2125
- Zakamska et al. (2004) Zakamska N. L., Strauss M. A., Heckman T. M., Ivezić Ž., Krolik J. H., 2004, AJ, 128, 1002
- Zakamska et al. (2006) Zakamska N. L., et al., 2006, AJ, 132, 1496